Review
. 2018 Dec;356(6):518-527.
doi: 10.1016/j.amjms.2018.09.010. Epub 2018 Oct 2.

Glycemic Variability: How to Measure and Its Clinical Implication for Type 2 Diabetes

Affiliations
Review

Glycemic Variability: How to Measure and Its Clinical Implication for Type 2 Diabetes

Guillermo E Umpierrez et al. Am J Med Sci. 2018 Dec.

Abstract

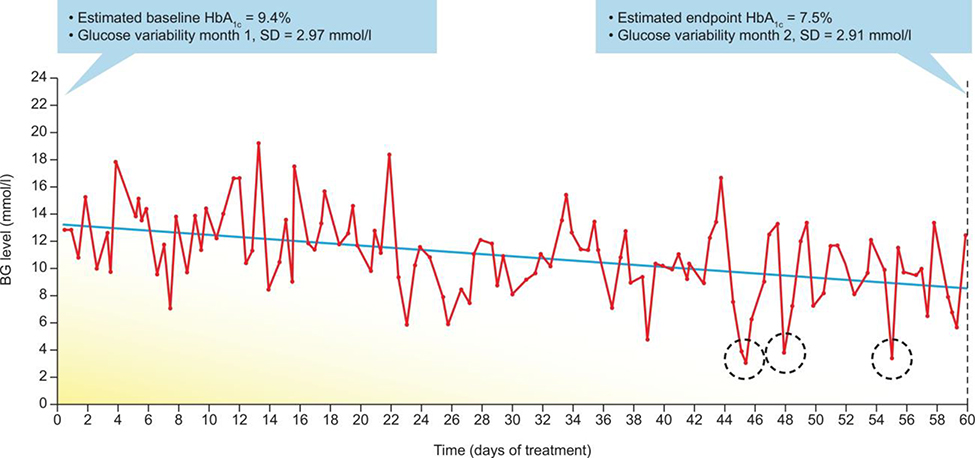
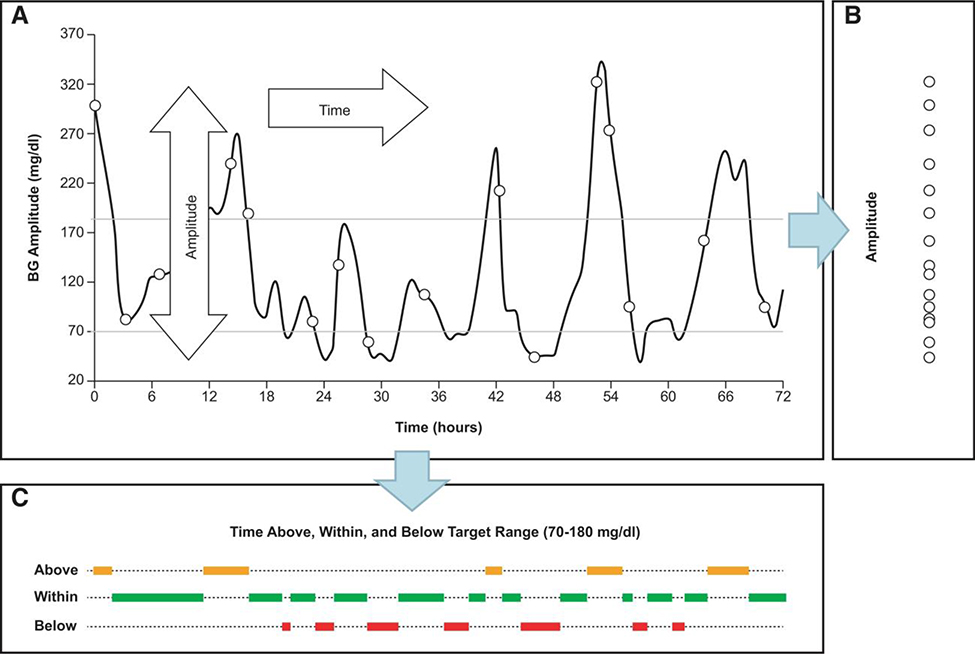
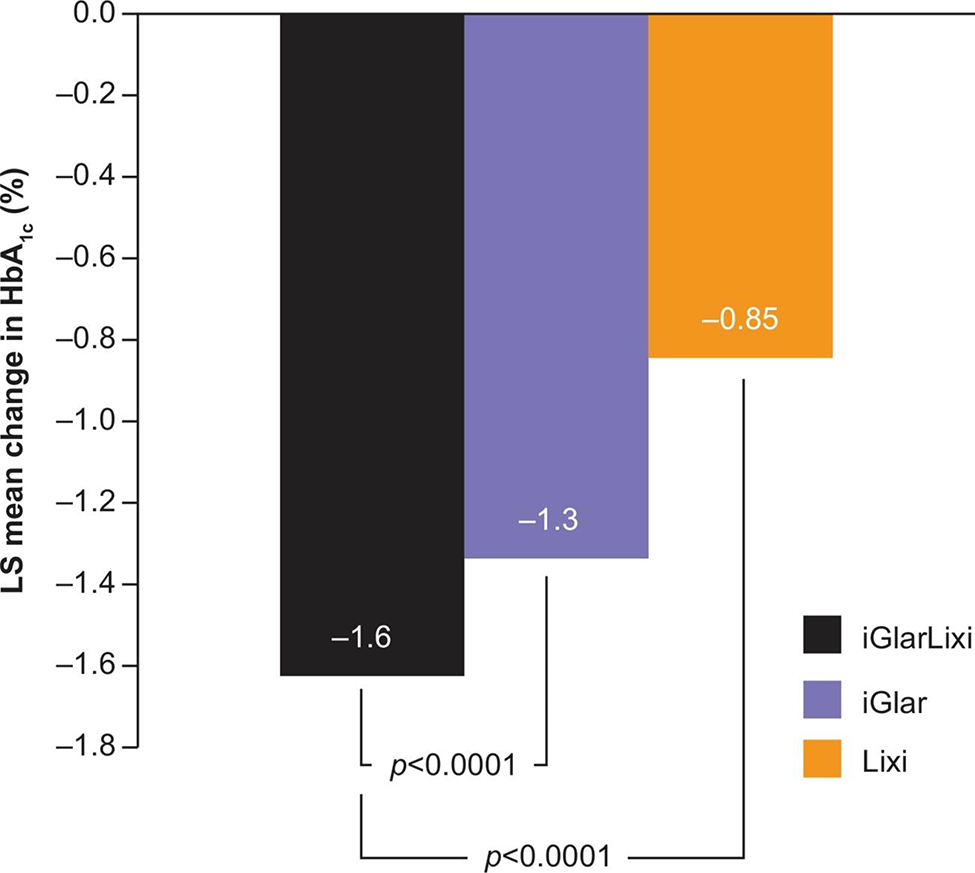
Glycated hemoglobin A1c (A1C) levels have traditionally been the gold standard for assessing glycemic control and treatment efficacy in patients with type 2 diabetes. However, A1C does not take into account fluctuations in blood glucose levels known as glycemic variability (GV). In recent years, GV has become increasingly clinically relevant, because of a better understanding of the need to reach target A1C while avoiding hypoglycemia. GV relates to both hyperglycemia and hypoglycemia, and has been associated with poorer quality of life. Diabetes treatments targeting multiple pathophysiological mechanisms are most beneficial in controlling A1C and reducing GV. In clinical trials, a number of metrics are used to measure GV, many of which are not well understood in the clinical practice. Until a gold standard metric for GV is established, the variety of measurements available may confound the choice of an optimal treatment for an individual patient.

Keywords: Glycated hemoglobin A(1c); Glycemic control; Glycemic variability; Type 2 diabetes.


Figures

FIGURE 1
FIGURE 1
Risk of hypoglycemia and improved glycemic control. Self-monitored blood levels of glucose recorded over 60 days. A downward trend in blood levels of glucose is evident; levels of HbA1c (estimated by the use of a linear formula) decreased from 9.4% at baseline to 7.5% by the end of the observation period. However, glucose variability remained relatively unchanged from the first to the second month of observation, which resulted in 3 hypoglycemic episodes (<3.9 mmol/L) registered by self-monitoring blood glucose at days 45, 48 and 55 (dotted circles). Reproduced with permission from Springer Nature: Nature Reviews Endocrinology, Metrics for glycaemic control—from HbA1c to continuous glucose monitoring, Kovatchev, 2017.Abbreviations: HbA1c, hemoglobin A1c; SD, standard deviation
FIGURE 2
FIGURE 2
Principal components of GV. Glucose fluctuations are a process in time that has 2 dimensions—amplitude and time (A). Projected along its amplitude axis, this process is measured by metrics such as SD or MAGE (B). Projected along its time axis, this process is assessed by temporal characteristics, such as time within target range and time spent in hypoglycemia or hyperglycemia (C). Reproduced with permission from Kovatchev et al. Glucose variability: timing, risk analysis and relationship to hypoglycemia in diabetes, American Diabetes Association, 2016. Copyright and all rights reserved. Material from this publication has been used with the permission of American Diabetes Association. Abbreviations: BG, blood glucose; MAGE, mean amplitude of glycemic excursions; SD, standard deviation.
FIGURE 3
FIGURE 3
Change in A1C with the iGlarLixi fixed ratio combination. Reproduced with permission from Rosenstock et al. Benefits of LixiLan, a titratable fixed-ratio combination of insulin glargine plus lixisenatide, versus insulin glargine and lixisenatide monocomponents in type 2 diabetes inadequately controlled on oral agents: the LixiLan-O randomized trial, American Diabetes Association, 2016. Copyright and all rights reserved. Material from this publication has been used with the permission of American Diabetes Association. LS mean change in HbA1c. Data are mean ± SD. Abbreviations: iGlar, insulin glargine; iGlarLixi, insulin glargine/lixisenatide; LS, least squares; lixi, lixisenatide; mITT, modified intent-to-treat.

References

    1. Cryer P Glycemic goals in diabetes: trade-off between glycemic control and iatrogenic hypoglycemia. Diabetes. 2014;63:2188–2195. - PubMed
    1. Monnier L, Colette C, Owens DR. Glycemic variability: the third component of the dysglycemia in diabetes. Is it important? How to measure it? J Diabetes Sci Technol. 2008;2:1094–1100. - PMC - PubMed
    1. Kovatchev BP. Metrics for glycaemic control—from HbA1c to continuous glucose monitoring. Nat Rev Endocrinol. 2017;13:425–436. - PubMed
    1. Cox DJ, McCall A, Kovatchev B, et al. Effects of blood glucose rate of changes on perceived mood and cognitive symptoms in insulin-treated type 2 diabetes. Diabetes Care. 2007;30:2001–2002. - PubMed
    1. de Ranitz-Greven W, Beulens J, Biesma D, et al. Is higher glycemic variability in type 2 diabetes patients associated with reduced quality of life? Endocr Rev. 2015;36(Suppl 2):2015.

Publication types

MeSH terms