. 2018 Dec 4;115(11):2206-2217.
doi: 10.1016/j.bpj.2018.10.018. Epub 2018 Oct 30.

Light-Activated Dynamic Clamp Using iPSC-Derived Cardiomyocytes

Affiliations

Light-Activated Dynamic Clamp Using iPSC-Derived Cardiomyocytes

Bonnie Quach et al. Biophys J. .

Abstract

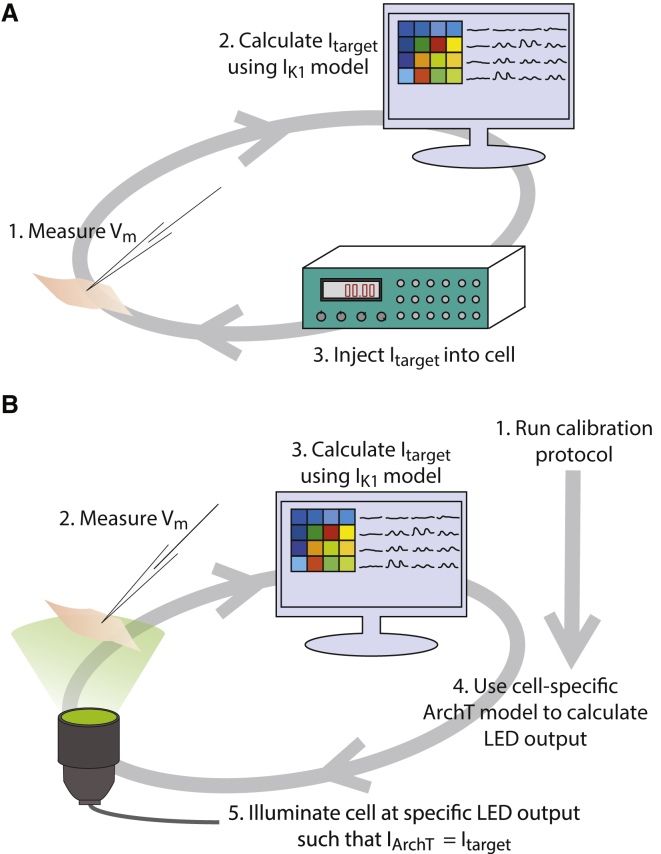
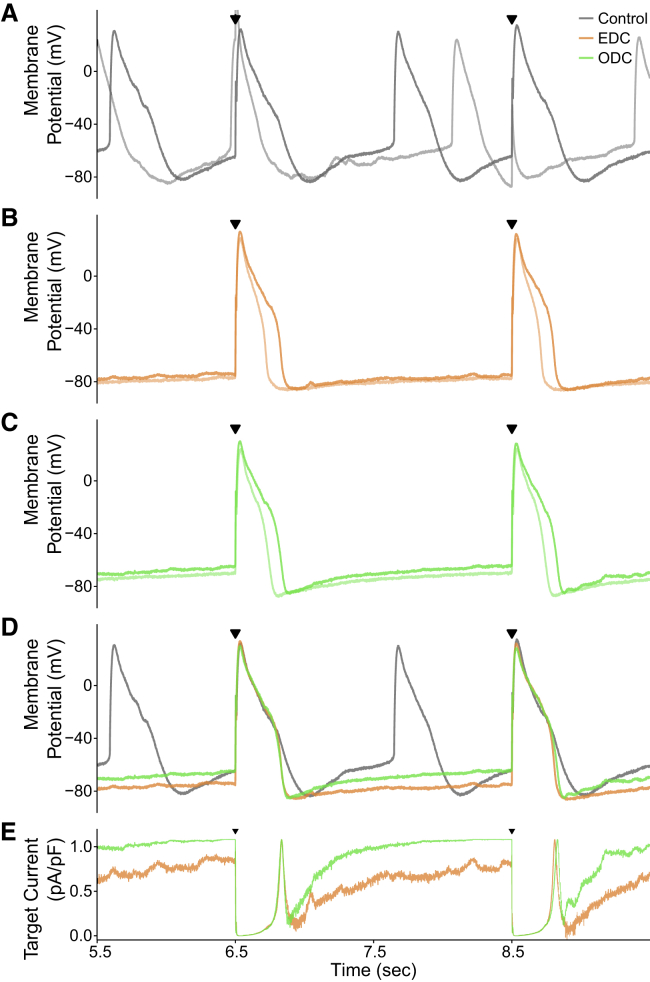
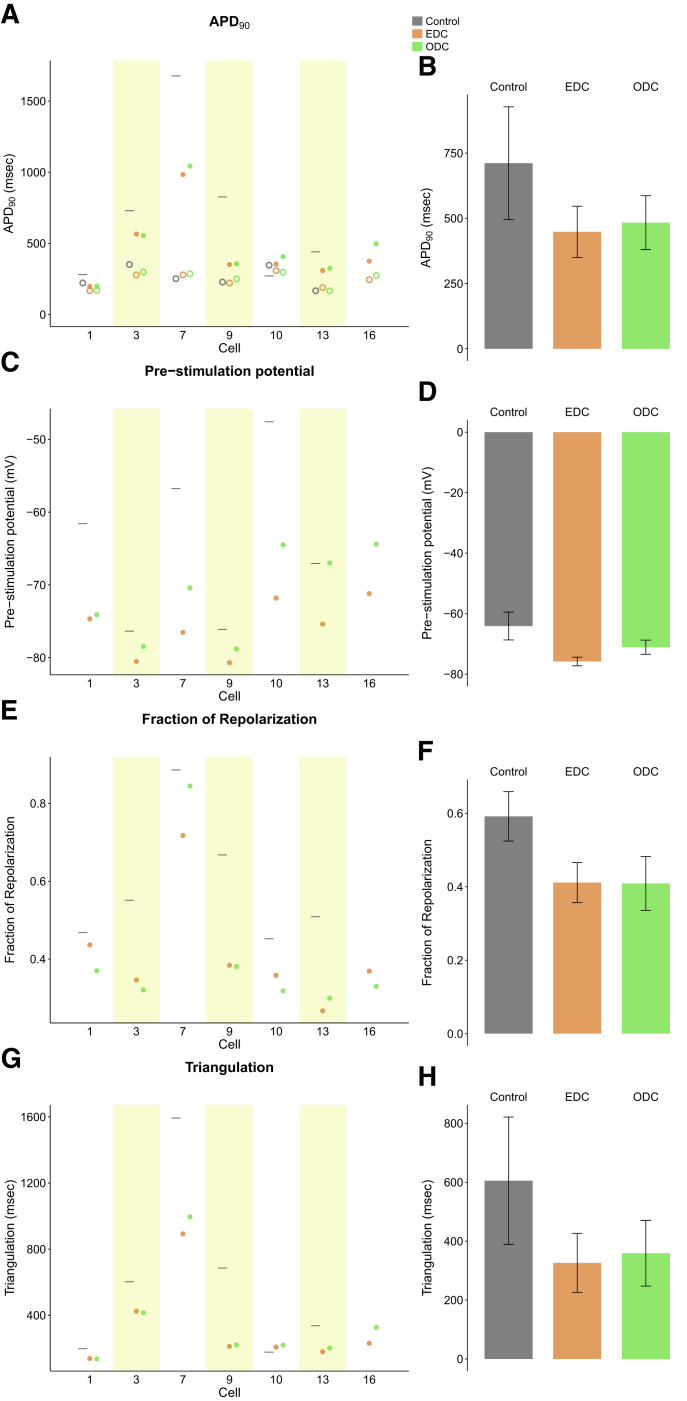
iPSC-derived cardiomyocytes (iPSC-CMs) are a potentially advantageous platform for drug screening because they provide a renewable source of human cardiomyocytes. One obstacle to their implementation is their immature electrophysiology, which reduces relevance to adult arrhythmogenesis. To address this, dynamic clamp is used to inject current representing the insufficient potassium current, IK1, thereby producing more adult-like electrophysiology. However, dynamic clamp requires patch clamp and is therefore low throughput and ill-suited for large-scale drug screening. Here, we use optogenetics to generate such a dynamic-clamp current. The optical dynamic clamp (ODC) uses outward-current-generating opsin, ArchT, to mimic IK1, resulting in more adult-like action potential morphology, similar to IK1 injection via classic dynamic clamp. Furthermore, in the presence of an IKr blocker, ODC revealed expected action potential prolongation and reduced spontaneous excitation. The ODC presented here still requires an electrode to measure Vm but provides a first step toward contactless dynamic clamp, which will not only enable high-throughput screening but may also allow control within multicellular iPSC-CM formats to better recapitulate adult in vivo physiology.


Figures

Figure 1
Figure 1
Description of EDC and ODC systems. Dynamic clamp is used to simulate the target current, IK1, in iPSC-CMs. (A) The EDC system uses the electrode to measure the Vm and inject a current into the cell. (B) The ODC system utilizes the electrode to measure the Vm but uses optical ArchT activation to inject the target current. Before implementing the ODC system, a calibration protocol is executed to obtain the parameters to generate a cell-specific ArchT model.
Figure 2
Figure 2
Calibration protocol to create a cell-specific ArchT model. (A) The calibration protocol consists of changing the light intensity and the holding potential to determine the ArchT model parameters for an individual cell, specifically the light dependence using the light-intensity ramp portion of the protocol (illustrated in blue) and voltage dependence using the voltage-clamp steps in the protocol (illustrated in purple). The bottom panel illustrates an example of the current output measured via patch clamp for one cell during the calibration protocol. (B and C) Currents from the example trace in (A) during the light-intensity ramp and voltage-clamp steps, respectively, are shown. The currents were subtracted from the baseline, defined as an average of 10 ms before illumination.
Figure 3
Figure 3
Example demonstrating the results of the EDC and ODC platforms. Two stimulated APs from an example cell (cell 1, Figs. S6A and S8) showing the effects of adding Itarget (IK1) are shown while paced at three different frequencies: (A) 0.5 Hz, (B) 1 Hz, and (C) 2 Hz. The gray, orange, and green traces represent the control without any current addition, adding Itarget with EDC, and adding Itarget with ODC, respectively. The top panels in each of (A) through (C) overlay the paced APs over time under control and both dynamic-clamp conditions, and the black triangles indicate when a stimulus current was delivered. In the middle panels, the traces represent the calculated target currents for EDC and ODC. The bottom panels show the calculated light intensity used to generate the target current. The time axis corresponds to the time within the full recording shown in Fig. S6A.
Figure 4
Figure 4
Example demonstrating the results of the EDC and ODC platforms. The figure is organized in the same manner as Fig. 3. This example is from cell 13 (Figs. S6B and S8). The time axis corresponds to the time within the full recording shown in Fig. S6B.
Figure 5
Figure 5
Summary of the effects of EDC or ODC on AP morphology. Pre-stimulation potential (A), fraction of repolarization (C), and triangulation (E) of individual cells are shown at 2 Hz pacing in control (gray) and after adding an IK1 target current via EDC (orange) or ODC (green). The results of individual cells at 0.5 and 1 Hz are displayed in Fig. S8. Average of all cells and mean ± standard error of the pre-stimulation potential (B), fraction of repolarization (D), and triangulation (E) are shown by pacing frequency; no stimulated AP could be measured for the control condition of cell 16 because of the high rate of spontaneous activity.
Figure 6
Figure 6
Example demonstrating the results of control, EDC, and ODC after E-4031 addition. An example cell (cell 13, Fig. 7) showing the effects of adding Itarget while paced at 0.5 Hz is shown. The gray (A and D), orange (B, D, and E), and green (CE) traces represent the control without any current addition, adding Itarget with EDC, and adding Itarget with ODC, respectively. (AC) The darker traces represent the stimulated APs after E-4031 addition, whereas the light-colored traces represent the stimulated APs before E-4031 addition. (D) Overlays of AP traces from the three conditions after E-4031 addition are shown. (E) Calculated target currents for EDC and ODC are shown. Black triangles indicate when a stimulus current was delivered and provide a reference to which of the 10 paced APs in Fig. S9 are displayed. The time axis corresponds to the time within the full recording shown in Fig. S9.
Figure 7
Figure 7
Summary of the effect of adding IK1 via EDC or ODC after E-4031 addition on AP morphology paced at 0.5 Hz. The APD90 (A), pre-stimulation potential (C), fraction of repolarization (E), and triangulation (G) were measured without any current addition (gray) and with the addition of Itarget via EDC (orange) or ODC (green) in individual cells. (A) The empty markers represent the APD90 before drug addition, and the dark circles represent the APD90 after E-4031 addition. The average of all cells and mean ± standard error of the APD90 after drug addition (B), pre-stimulation potential (D), fraction of repolarization (F), and triangulation (H) are shown.

Comment in

References

    1. Redfern W.S., Carlsson L., Hammond T.G. Relationships between preclinical cardiac electrophysiology, clinical QT interval prolongation and torsade de pointes for a broad range of drugs: evidence for a provisional safety margin in drug development. Cardiovasc. Res. 2003;58:32–45. - PubMed
    1. Stevens J.L., Baker T.K. The future of drug safety testing: expanding the view and narrowing the focus. Drug Discov. Today. 2009;14:162–167. - PubMed
    1. Laverty H., Benson C., Valentin J. How can we improve our understanding of cardiovascular safety liabilities to develop safer medicines? Br. J. Pharmacol. 2011;163:675–693. - PMC - PubMed
    1. Ferri N., Siegl P., Benghozi R. Drug attrition during pre-clinical and clinical development: understanding and managing drug-induced cardiotoxicity. Pharmacol. Ther. 2013;138:470–484. - PubMed
    1. Mak I.W., Evaniew N., Ghert M. Lost in translation: animal models and clinical trials in cancer treatment. Am. J. Transl. Res. 2014;6:114–118. - PMC - PubMed

Publication types

Substances