. 2018 Dec 4;115(11):2179-2188.
doi: 10.1016/j.bpj.2018.10.024. Epub 2018 Nov 2.

Spatially Resolving the Condensing Effect of Cholesterol in Lipid Bilayers

Affiliations

Spatially Resolving the Condensing Effect of Cholesterol in Lipid Bilayers

Felix Leeb et al. Biophys J. .

Abstract

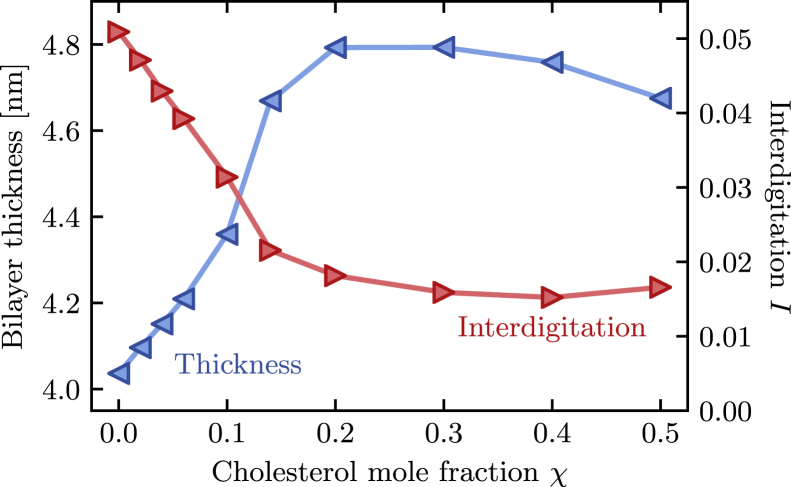
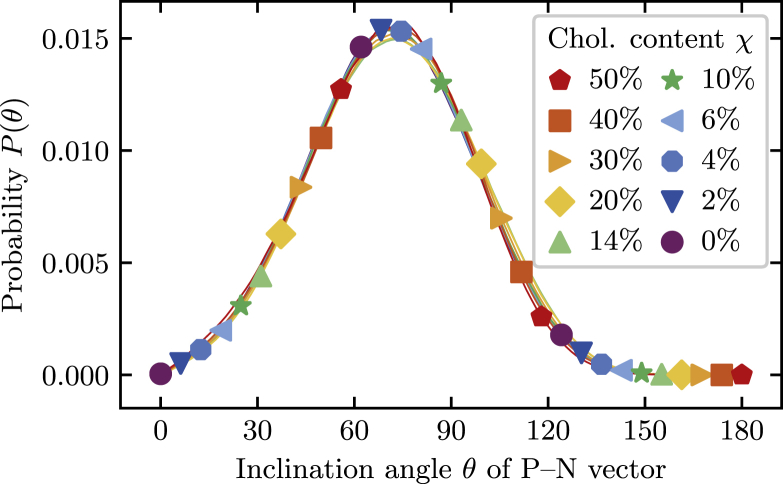
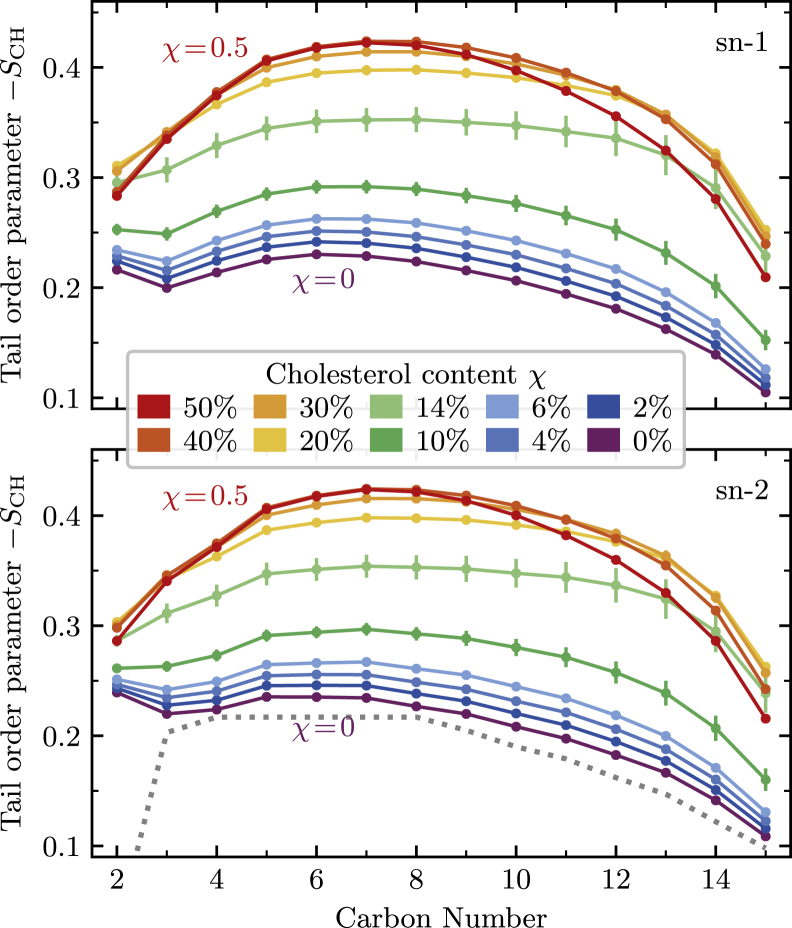
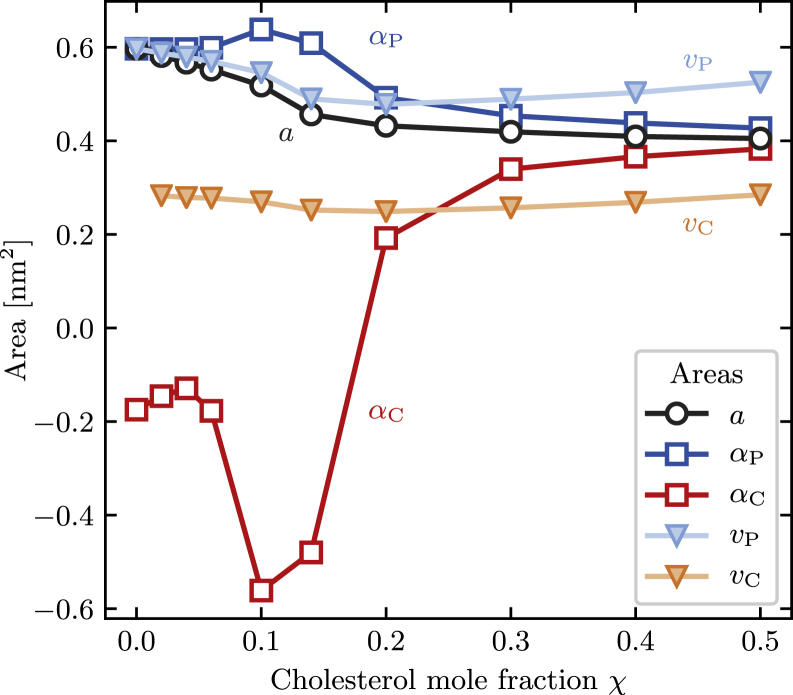
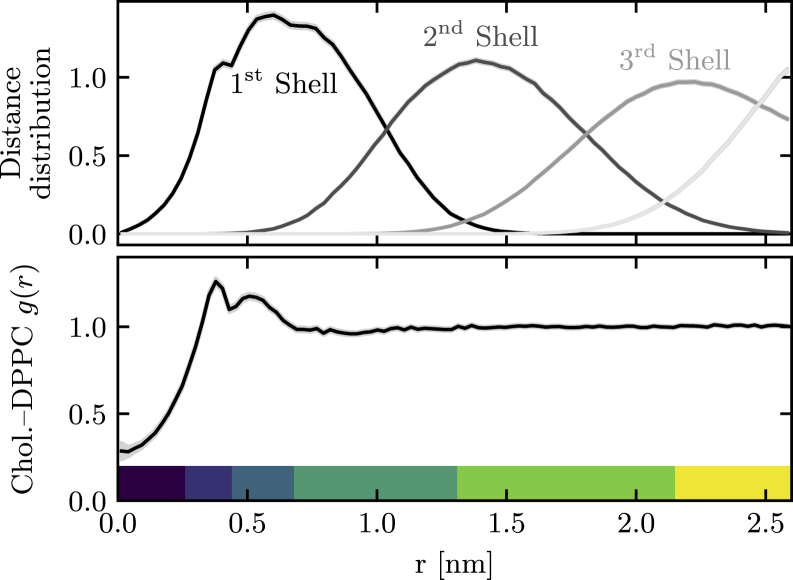
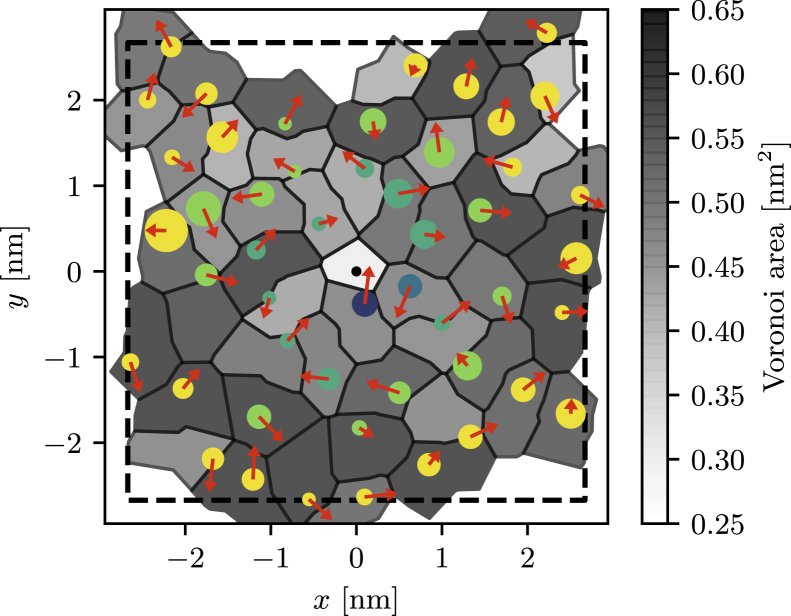
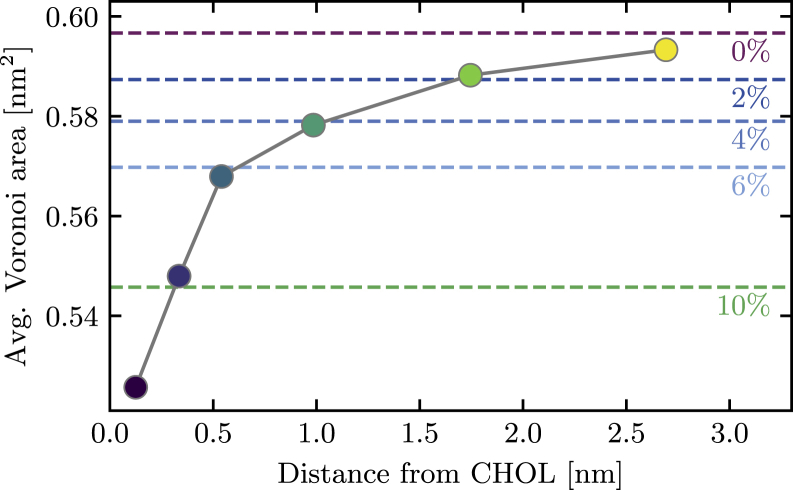
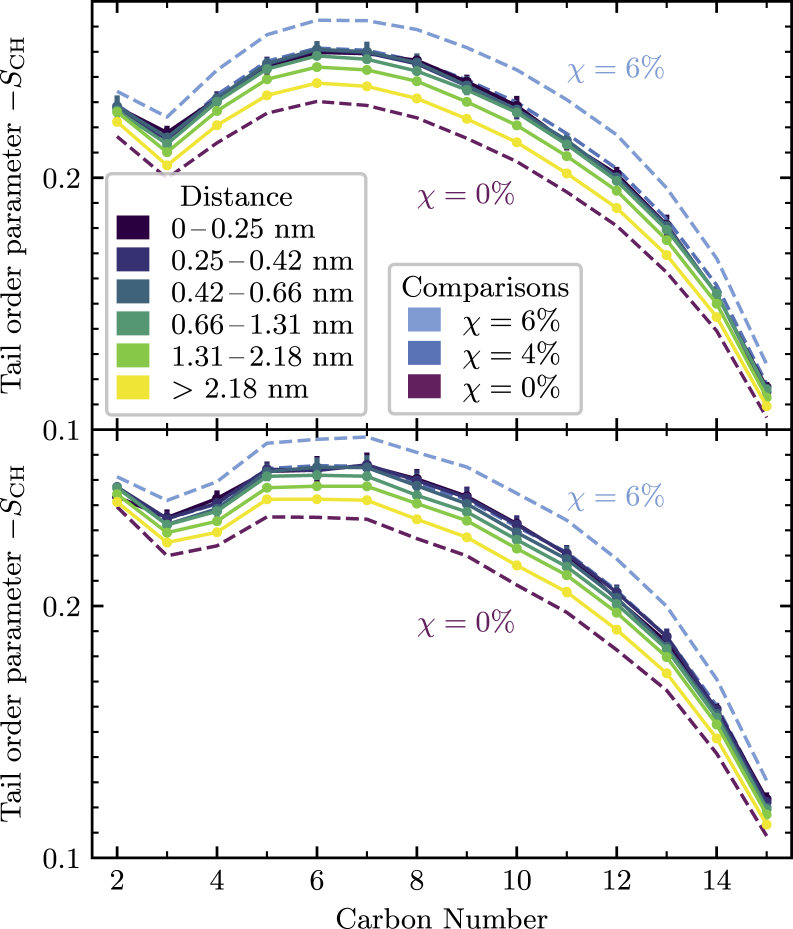
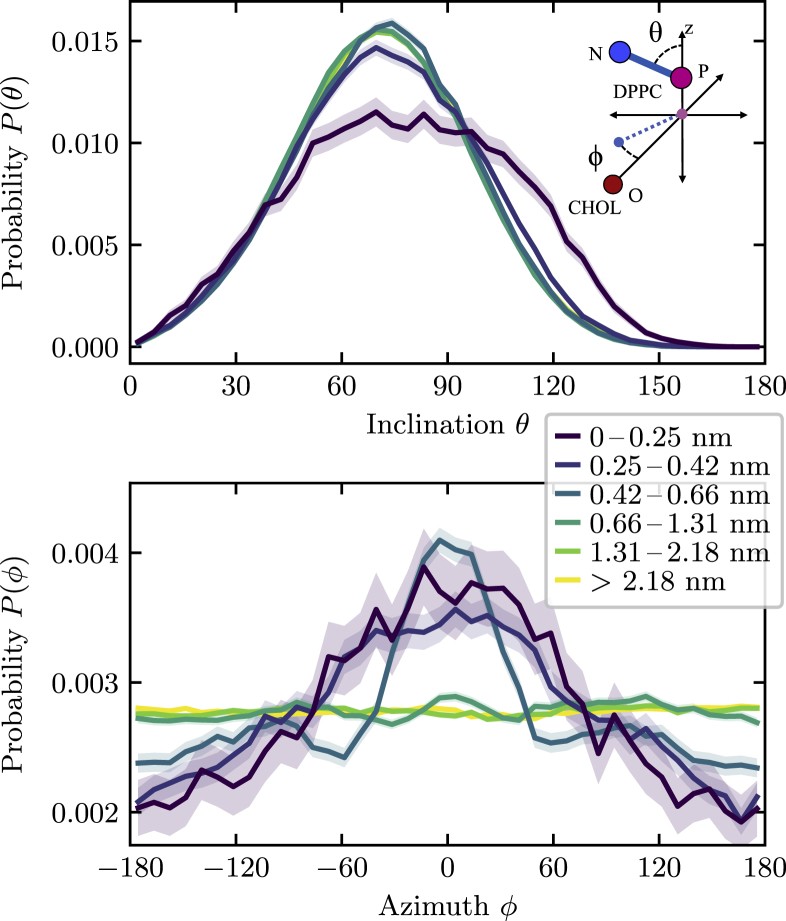
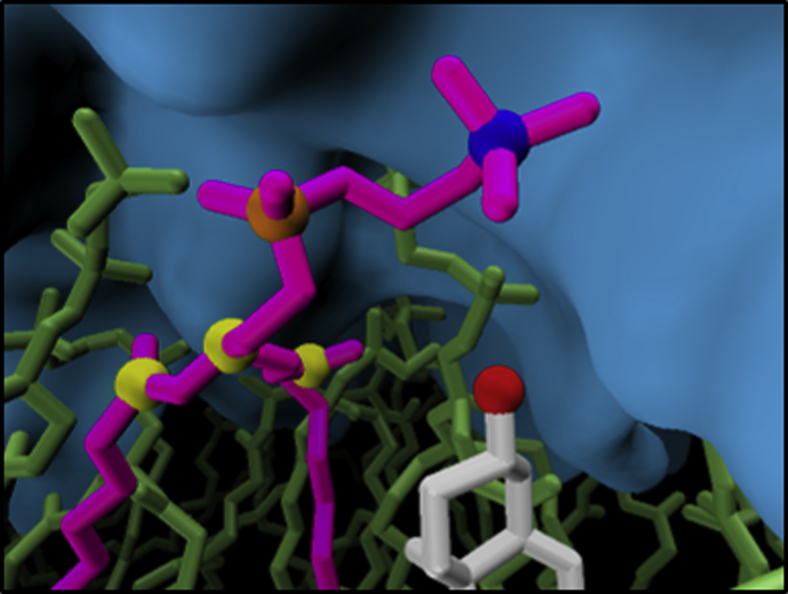
We study the effect of cholesterol on the structure of dipalmitoylphosphatidylcholine phospholipid bilayers. Using extensive molecular dynamics computer simulations at atomistic resolution, we observe and quantify several structural changes upon increasing cholesterol content that are collectively known as the condensing effect: a thickening of the bilayer, an increase in lipid tail order, and a decrease in lateral area. We also observe a change in leaflet interdigitation and a lack thereof in the distributions of dipalmitoylphosphatidylcholine headgroup orientations. These results, obtained over a wide range of cholesterol mole fractions, are then used to calibrate the analysis of phospholipid properties in bilayers containing a single cholesterol molecule per leaflet, which we perform in a spatially resolved way. We find that a single cholesterol molecule affects phospholipids in its first and second solvation shells, which puts the range of this effective interaction to be on the order of 1-2 nm. We also observe a tendency of phospholipids to orient their polar headgroups toward the cholesterol, which provides additional support for the umbrella model of bilayer organization.


Figures

Figure 1
Figure 1
Dependence of bilayer thickness and leaflet interdigitation on composition in binary DPPC/cholesterol membranes. Starting from a pure phospholipid bilayer, thickness increases and interdigitation decreases significantly upon addition of cholesterol up to a mole fraction of 20%. Both properties show a weak reversal of this trend at high cholesterol concentrations. To see this figure in color, go online.
Figure 2
Figure 2
Probability distributions of the inclination angle of the phospholipids’ P-N separation vector for all 10 cholesterol mole fractions studied in this work. The distributions overlap and are nearly indistinguishable, showing that there are no significant changes in the headgroups’ tilt angles as the cholesterol content is varied. To see this figure in color, go online.
Figure 3
Figure 3
Tail order parameters for the sn-1 (top panel) and sn-2 (bottom panel) chains of DPPC for all cholesterol concentrations studied. Starting from a pure DPPC bilayer, increasing the cholesterol content causes the entire tail to become significantly more ordered. At 20–30% cholesterol content, the ordering plateaus for the upper carbon atoms but begins to decrease for carbon atoms near the bilayer center. The dotted line in the bottom panel shows the experimental results of (39). To see this figure in color, go online.
Figure 4
Figure 4
Measures of area in binary DPPC/cholesterol bilayers. Shown are a, the average area per lipid (open circles); αp and αC, the partial specific areas of phospholipids and cholesterol (open squares); and vp and vC, the corresponding Voronoi areas (filled triangles). To see this figure in color, go online.
Figure 5
Figure 5
(Top panel) Distributions of the distances of DPPC phosphorus atoms from cholesterol’s oxygen atom for each solvation shell as defined by the adjacency of the Voronoi tessellation. (Bottom panel) The pair correlation function for these two atom types is shown. The bottom patches show the six regions used in the spatially resolved analysis of local phospholipid properties. To see this figure in color, go online.
Figure 6
Figure 6
Snapshot of one leaflet in a simulation with a single cholesterol molecule (NC = 1) whose oxygen atom is at the center. Shown is the Voronoi tessellation of the bilayer, obtained by merging the three Voronoi segments of each phospholipid (see Methods). For each segment, we show the position of the phosphorus atom by a disk whose size is proportional to the average tail order parameter −SCH and whose color corresponds to the six regions in the local analysis (Fig. 5). Also shown is the projection of the P-N separation vector for each phospholipid headgroup (arrow), and dashed lines are the boundaries of the periodically replicated simulation box. In this particular snapshot, the headgroup of the DPPC molecule right below the central cholesterol is oriented toward the sterol, whose rough β-face points upward. To see this figure in color, go online.
Figure 7
Figure 7
Average Voronoi area vp of phospholipids as a function of distance to the sole cholesterol molecule. The initial sharp increase demonstrates the short range of the ordering effect. The dashed lines show the average Voronoi area of phospholipids in bilayers with the indicated cholesterol content for comparison. To see this figure in color, go online.
Figure 8
Figure 8
Spatially resolved tail order parameters of the sn-1 (top) and sn-2 (bottom) alkyl chains of phospholipids near a single cholesterol molecule. Dashed lines show the average tail order parameter for bilayers containing, 0, 4, and 6% cholesterol for comparison. Phospholipids in close proximity to a single sterol show slightly increased ordering, comparable to those in a bilayer with 4% cholesterol. To see this figure in color, go online.
Figure 9
Figure 9
(Top panel) Distribution of the DPPC headgroup inclination angle θ as a function of distance from a single cholesterol molecule. Except for phospholipids in the closest region, which show a broadening toward larger angles, the distributions remain similar to those obtained in pure bilayers. (Bottom panel) Distribution of the headgroup azimuth ϕ—defined as the angle between the P-N separation vector of the headgroup and the O-P separation vector between cholesterol and DPPC, both projected onto the xy plane (see inset)—is shown. Phospholipids within the first three regions, extending up to 0.66 nm, have a tendency of orienting their headgroups toward the cholesterol, whereas phospholipids further away show a uniform angle distribution. To see this figure in color, go online.
Figure 10
Figure 10
Simulation snapshot of a DPPC bilayer containing a single cholesterol molecule, showcasing a phospholipid whose headgroup is oriented toward the cholesterol. It thereby shields the latter from contact with water, shown as the smooth isodensity surface in the background. Hydrogen atoms are omitted for clarity. Highlighted are the oxygen atom of cholesterol, the phosphate and nitrogen atoms in the DPPC headgroup, and the three carbon atoms used in the Voronoi tessellation for the phospholipid. To see this figure in color, go online.

References

    1. Leathes J.B. On the role of fats in vital phenomena. Lancet. 1925;205:853–856.
    1. McIntosh T.J. The effect of cholesterol on the structure of phosphatidylcholine bilayers. Biochim. Biophys. Acta. 1978;513:43–58. - PubMed
    1. Pencer J., Nieh M.P., Katsaras J. Bilayer thickness and thermal response of dimyristoylphosphatidylcholine unilamellar vesicles containing cholesterol, ergosterol and lanosterol: a small-angle neutron scattering study. Biochim. Biophys. Acta. 2005;1720:84–91. - PubMed
    1. Hung W.C., Lee M.T., Huang H.W. The condensing effect of cholesterol in lipid bilayers. Biophys. J. 2007;92:3960–3967. - PMC - PubMed
    1. Kučerka N., Perlmutter J.D., Sachs J.N. The effect of cholesterol on short- and long-chain monounsaturated lipid bilayers as determined by molecular dynamics simulations and X-ray scattering. Biophys. J. 2008;95:2792–2805. - PMC - PubMed

Publication types

MeSH terms