. 2018 Nov 28;7(5):548-555.e8.
doi: 10.1016/j.cels.2018.10.008. Epub 2018 Nov 14.

Mapping Cellular Reprogramming via Pooled Overexpression Screens with Paired Fitness and Single-Cell RNA-Sequencing Readout

Affiliations

Mapping Cellular Reprogramming via Pooled Overexpression Screens with Paired Fitness and Single-Cell RNA-Sequencing Readout

Udit Parekh et al. Cell Syst. .

Abstract

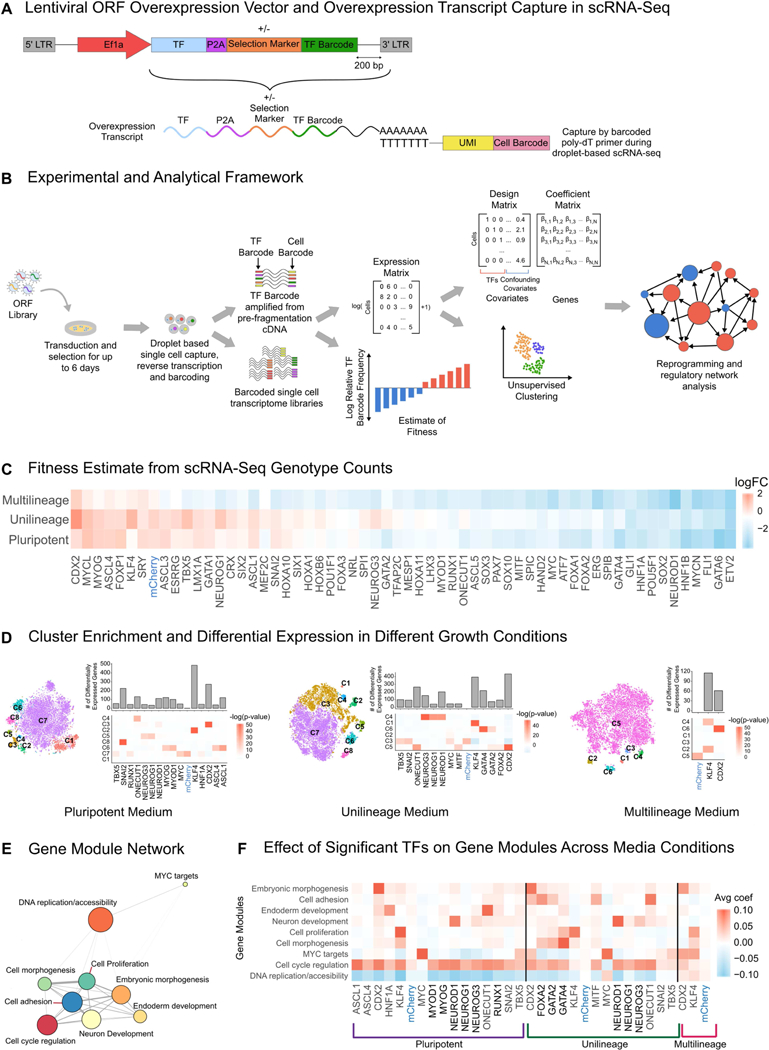
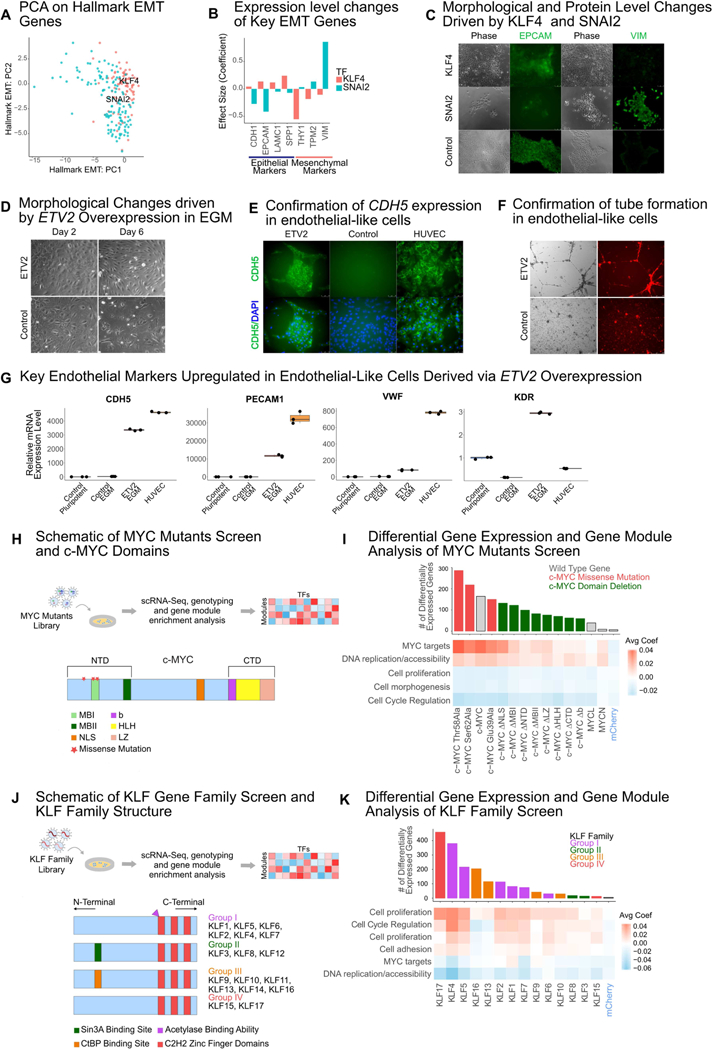
Understanding the effects of genetic perturbations on the cellular state has been challenging using traditional pooled screens, which typically rely on the delivery of a single perturbation per cell and unidimensional phenotypic readouts. Here, we use barcoded open reading frame overexpression libraries coupled with single-cell RNA sequencing to assay cell state and fitness, a technique we call SEUSS (scalable functional screening by sequencing). Using SEUSS, we perturbed hPSCs with a library of developmentally critical transcription factors (TFs) and assayed the impact of TF overexpression on fitness and transcriptomic states. We further leveraged the versatility of the ORF library approach to assay mutant genes and whole gene families. From the transcriptomic responses, we built genetic co-regulatory networks to identify altered gene modules and found that KLF4 and SNAI2 drive opposing effects along the epithelial-mesenchymal transition axis. From the fitness responses, we identified ETV2 as a driver of reprogramming toward an endothelial-like state.

Keywords: ORF overexpression; cellular reprogramming; pluripotent stem cells; single-cell screens.


Figures

Figure 1:
Figure 1:
Schematic of SEUSS workflow, estimates of fitness and transcriptomic effects of TF overexpression, and building co-regulatory gene module networks. (A) Schematic of lentiviral overexpression vector and capture of overexpression transcript during scRNA-seq. While the vector used in the screens contained a hygromycin resistance selection marker, it may also be designed without a selection marker. (B) Schematic of experimental and analytical framework for evaluation of effects of transcription factor (TF) overexpression in hPSCs: Individual TFs are cloned into the barcoded ORF overexpression vector, pooled and packaged into lentiviral libraries for transduction of hPSCs. Transduced cells are harvested at a fixed time point to be assayed as single cells using droplet based scRNA-seq to evaluate transcriptomic changes. Cells are genotyped by amplifying the overexpression transcript from scRNA-seq cDNA prior to fragmentation and library construction and identifying the overexpressed TF barcode for each cell. The cell count for each genotype is used to estimate fitness. Gene expression matrices from scRNA-seq are used to obtain differential gene expression and clustering signatures, which in turn are used for evaluation of cell state reprogramming and gene regulatory network analysis. (C) Fitness effect of TFs: log fold change of individual TFs, calculated as cell counts normalized against plasmid library read counts. (D) t-SNE projection (left panels), and differential gene expression and cluster enrichment of significant TFs (right panels) from screens in different growth medium conditions: pluripotent stem cell medium, unilineage medium and multilineage medium. The TFs were chosen as significant with the following criteria: cluster enrichment with a p-value of less than 10−12, or if the TF drove differential expression of more than 50 genes. (E) Gene module network: Node size indicates the number of genes in the module; Edge size indicates distance between modules. (F) Effect of TF overexpression on gene modules in different medium conditions, effect size was calculated as the average of the linear model coefficients for a given TF perturbation across all genes within a module.
Figure 2:
Figure 2:
Biological effects of TF overexpression: KLF4 and SNAI2 as opposing drivers in EMT, ETV2 as a driver of reprogramming to an endothelial-like state; and application of SEUSS to screen mutant proteins and gene families (A) PC plot of performing PCA on 200 genes from the Hallmark Epithelial Mesenchymal Transition geneset from MSigDB(Subramanian et al., 2005). (B) Effect of KLF4 and SNAI2 on selected epithelial and mesenchymal markers. (C) Transmission and immunofluorescence micrographs of EPCAM- and VIM-labelled day 5 KLF4-, SNAI2- or mCherry-transduced cells. (D) Morphology change for cells transduced with either ETV2 or mCherry in EGM. (E) Immunofluorescence micrograph of CDH5 labelled day 6 ETV2-or mCherry-transduced cells and HUVECs. (F) Tube formation assay for day 6 ETV2- or mCherry-transduced cells. (G) qRT-PCR analysis of signature endothelial genes CDH5, PECAM1, VWF and KDR, at day 6 post-transduction. Data were normalized to GAPDH and expressed relative to control cells in pluripotent stem cell medium. (H) Schematic of workflow for c-MYC mutant library screen and schematic of functional domains of c-MYC: MYC Box I (MBI) and MYC Box II (II) which are essential for transactivation of target genes are housed in the amino-terminal domain (NTD); the basic (b) helix-loop-helix (HLH) leucine zipper (LZ) motif, which is required for heterodimerization with the MAX protein is housed in the carboxy-terminal domain (CTD); the nuclear localization signal domain (NLS) is located in the central region of the protein. (I) Effect of MYC mutant overexpression on number of differentially expressed genes and on gene modules. (J) Schematic of workflow for KLF gene family screen and schematic of KLF gene family protein structure grouped by common structural and functional features (K) Effect of KLF family overexpression on number of differentially expressed genes and on gene modules. For heatmaps in (I), (K) effect size was calculated as the average of the linear model coefficients for a given TF perturbation across all genes within a module.

References

    1. Abujarour R, Bennett M, Valamehr B, Lee TT, Robinson M, Robbins D, Le T, Lai K and Flynn P (2014). Myogenic differentiation of muscular dystrophy-specific induced pluripotent stem cells for use in drug discovery. Stem Cells Translational Medicine, 3(2), 149–60. - PMC - PubMed
    1. Adamson B, Norman TM, Jost M, Cho MY, Nuñez JK, Chen Y, Villalta JE, Gilbert LA, Horlbeck MA, Hein MY, et al. (2016). A Multiplexed Single-Cell CRISPR Screening Platform Enables Systematic Dissection of the Unfolded Protein Response. Cell, 167(7), 1867–1882.e21. - PMC - PubMed
    1. Adamson B, Norman TM, Jost M and Weissman JS (2018). Approaches to maximize sgRNA-barcode coupling in Perturb-seq screens. bioRxiv, 298349.
    1. Barrallo-Gimeno A, Nieto MA and Ip YT (2005). The Snail genes as inducers of cell movement and survival: implications in development and cancer. Development, 132(14), 3151–61. - PubMed
    1. Blondel VD, Guillaume J-L, Lambiotte R and Lefebvre E (2008). Fast unfolding of communities in large networks. arXiv, 1–12.

Publication types