4D liver tumor localization using cone-beam projections and a biomechanical model
- PMID: 30448003
- PMCID: PMC6445758
- DOI: 10.1016/j.radonc.2018.10.040
4D liver tumor localization using cone-beam projections and a biomechanical model
Abstract
Purpose: To improve the accuracy of liver tumor localization, this study tests a biomechanical modeling-guided liver cone-beam CT (CBCT) estimation (Bio-CBCT-est) technique, which generates new CBCTs by deforming a prior high-quality CT or CBCT image using deformation vector fields (DVFs). The DVFs can be used to propagate tumor contours from the prior image to new CBCTs for automatic 4D tumor localization.
Methods/materials: To solve the DVFs, the Bio-CBCT-est technique employs an iterative scheme that alternates between intensity-driven 2D-3D deformation and biomechanical modeling-guided DVF regularization and optimization. The 2D-3D deformation step solves DVFs by matching digitally reconstructed radiographs of the 3D deformed prior image to 2D phase-sorted on-board projections according to imaging intensities. This step's accuracy is limited at low-contrast intra-liver regions without sufficient intensity variations. To boost the DVF accuracy in these regions, we use the intensity-driven DVFs solved at higher-contrast liver boundaries to fine-tune the intra-liver DVFs by finite element analysis-based biomechanical modeling. We evaluated Bio-CBCT-est's accuracy with seven liver cancer patient cases. For each patient, we simulated 4D cone-beam projections from 4D-CT images, and used these projections for Bio-CBCT-est based image estimations. After Bio-CBCT-est, the DVF-propagated liver tumor/cyst contours were quantitatively compared with the manual contours on the original 4D-CT 'reference' images, using the DICE similarity index, the center-of-mass-error (COME), the Hausdorff distance (HD) and the voxel-wise cross-correlation (CC) metrics. In addition to simulation, we also performed a preliminary study to qualitatively evaluate the Bio-CBCT-est technique via clinically acquired cone beam projections. A quantitative study using an in-house deformable liver phantom was also performed.
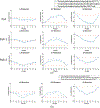
Results: Using 20 projections for image estimation, the average (±s.d.) DICE index increased from 0.48 ± 0.13 (by 2D-3D deformation) to 0.77 ± 0.08 (by Bio-CBCT-est), the average COME decreased from 7.7 ± 1.5 mm to 2.2 ± 1.2 mm, the average HD decreased from 10.6 ± 2.2 mm to 5.9 ± 2.0 mm, and the average CC increased from -0.004 ± 0.216 to 0.422 ± 0.206. The tumor/cyst trajectory solved by Bio-CBCT-est matched well with that manually obtained from 4D-CT reference images.
Conclusions: Bio-CBCT-est substantially improves the accuracy of 4D liver tumor localization via cone-beam projections and a biomechanical model.
Keywords: 2D-3D deformable registration; Biomechanical modeling; Liver CBCT; Liver tumor localization.
Copyright © 2018 Elsevier B.V. All rights reserved.
Figures


Similar articles
-
Enhancing liver tumor localization accuracy by prior-knowledge-guided motion modeling and a biomechanical model.Quant Imaging Med Surg. 2019 Jul;9(7):1337-1349. doi: 10.21037/qims.2019.07.04. Quant Imaging Med Surg. 2019. PMID: 31448218 Free PMC article.
-
U-net-based deformation vector field estimation for motion-compensated 4D-CBCT reconstruction.Med Phys. 2020 Jul;47(7):3000-3012. doi: 10.1002/mp.14150. Epub 2020 Apr 27. Med Phys. 2020. PMID: 32198934
-
Automatic liver tumor localization using deep learning-based liver boundary motion estimation and biomechanical modeling (DL-Bio).Med Phys. 2021 Dec;48(12):7790-7805. doi: 10.1002/mp.15275. Epub 2021 Nov 19. Med Phys. 2021. PMID: 34632589 Free PMC article.
-
A review of dose calculation approaches with cone beam CT in photon and proton therapy.Phys Med. 2020 Aug;76:243-276. doi: 10.1016/j.ejmp.2020.06.017. Epub 2020 Jul 28. Phys Med. 2020. PMID: 32736286 Review.
-
Source-detector trajectory optimization in cone-beam computed tomography: a comprehensive review on today's state-of-the-art.Phys Med Biol. 2022 Aug 16;67(16). doi: 10.1088/1361-6560/ac8590. Phys Med Biol. 2022. PMID: 35905731 Review.
Cited by
-
Real-time liver motion estimation via deep learning-based angle-agnostic X-ray imaging.Med Phys. 2023 Nov;50(11):6649-6662. doi: 10.1002/mp.16691. Epub 2023 Sep 13. Med Phys. 2023. PMID: 37922461 Free PMC article.
-
Medical physics challenges in clinical MR-guided radiotherapy.Radiat Oncol. 2020 May 5;15(1):93. doi: 10.1186/s13014-020-01524-4. Radiat Oncol. 2020. PMID: 32370788 Free PMC article. Review.
-
Enhancing liver tumor localization accuracy by prior-knowledge-guided motion modeling and a biomechanical model.Quant Imaging Med Surg. 2019 Jul;9(7):1337-1349. doi: 10.21037/qims.2019.07.04. Quant Imaging Med Surg. 2019. PMID: 31448218 Free PMC article.
-
Real-time liver tumor localization via a single x-ray projection using deep graph neural network-assisted biomechanical modeling.Phys Med Biol. 2022 May 24;67(11):10.1088/1361-6560/ac6b7b. doi: 10.1088/1361-6560/ac6b7b. Phys Med Biol. 2022. PMID: 35483350 Free PMC article.
-
Advanced 4-dimensional cone-beam computed tomography reconstruction by combining motion estimation, motion-compensated reconstruction, biomechanical modeling and deep learning.Vis Comput Ind Biomed Art. 2019;2(1):23. doi: 10.1186/s42492-019-0033-6. Epub 2019 Dec 12. Vis Comput Ind Biomed Art. 2019. PMID: 32190409 Free PMC article.
References
-
- Coolens C, Dawson LA. Advances in imaging for liver cancer radiation therapy. Imaging in Medicine. 2010;2:29–39.
-
- Siegel RL, Miller KD, Jemal A. Cancer Statistics, 2017. CA: a cancer journal for clinicians. 2017;67:7–30. - PubMed
-
- Meyer J Stereotactic radiation therapy for hepatic malignancies. Minerva gastroenterologica e dietologica. 2016;62:305–15. - PubMed
-
- Beddar AS, Briere TM, Balter P, et al. 4D-CT imaging with synchronized intravenous contrast injection to improve delineation of liver tumors for treatment planning. Radiotherapy and oncology : journal of the European Society for Therapeutic Radiology and Oncology. 2008;87:445–8. - PubMed
Publication types
MeSH terms
Grants and funding
LinkOut - more resources
Full Text Sources
Medical
Research Materials

