. 2019 Mar;156(4):1066-1081.e16.
doi: 10.1053/j.gastro.2018.11.024. Epub 2018 Nov 15.

BHLHA15-Positive Secretory Precursor Cells Can Give Rise to Tumors in Intestine and Colon in Mice

Affiliations

BHLHA15-Positive Secretory Precursor Cells Can Give Rise to Tumors in Intestine and Colon in Mice

Yoku Hayakawa et al. Gastroenterology. 2019 Mar.

Abstract

Background & aims: The intestinal epithelium is maintained by long-lived intestinal stem cells (ISCs) that reside near the crypt base. Above the ISC zone, there are short-lived progenitors that normally give rise to lineage-specific differentiated cell types but can dedifferentiate into ISCs in certain circumstances. However, the role of epithelial dedifferentiation in cancer development has not been fully elucidated.

Methods: We performed studies with Bhlha15-CreERT, Lgr5-DTR-GFP, Apcflox/flox, LSL-Notch (IC), and R26-reporter strains of mice. Some mice were given diphtheria toxin to ablate Lgr5-positive cells, were irradiated, or were given 5-fluorouracil, hydroxyurea, doxorubicin, or dextran sodium sulfate to induce intestinal or colonic tissue injury. In intestinal tissues, we analyzed the fate of progeny that expressed Bhlha15. We used microarrays and reverse-transcription PCR to analyze gene expression patterns in healthy and injured intestinal tissues and in tumors. We analyzed gene expression patterns in human colorectal tumors using The Cancer Genome Atlas data set.

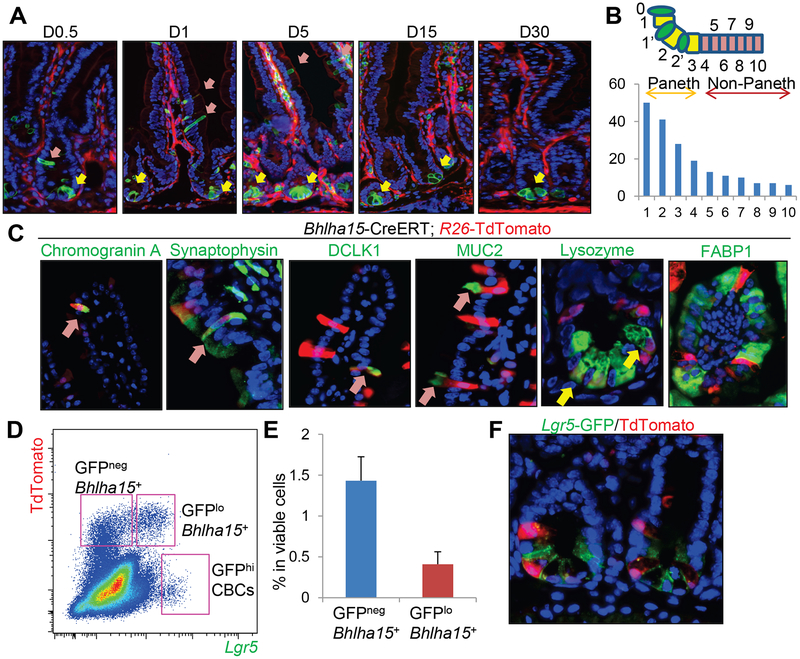
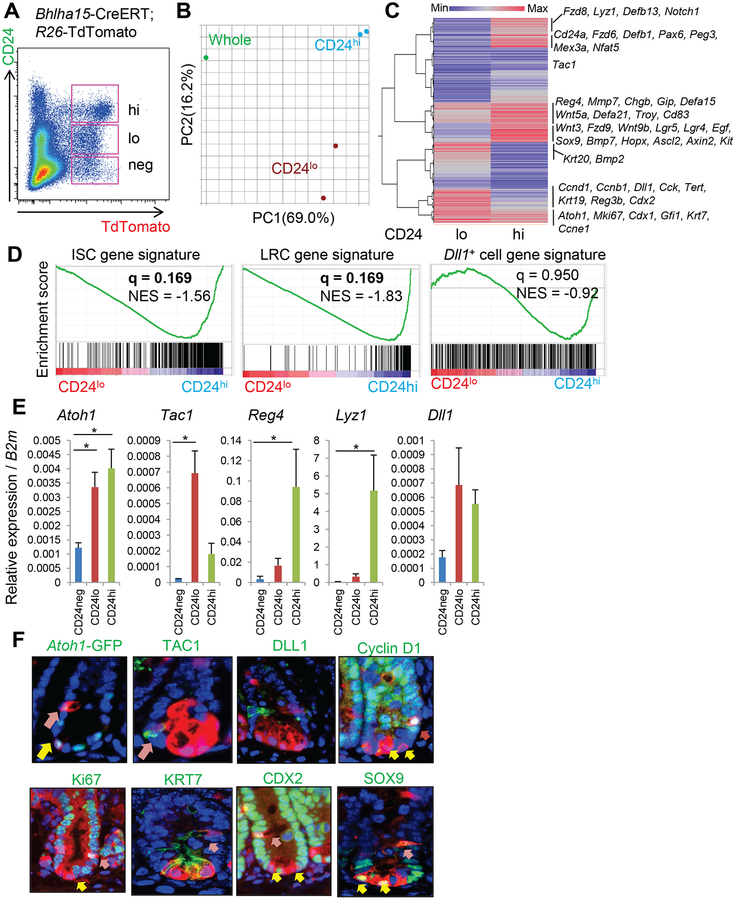
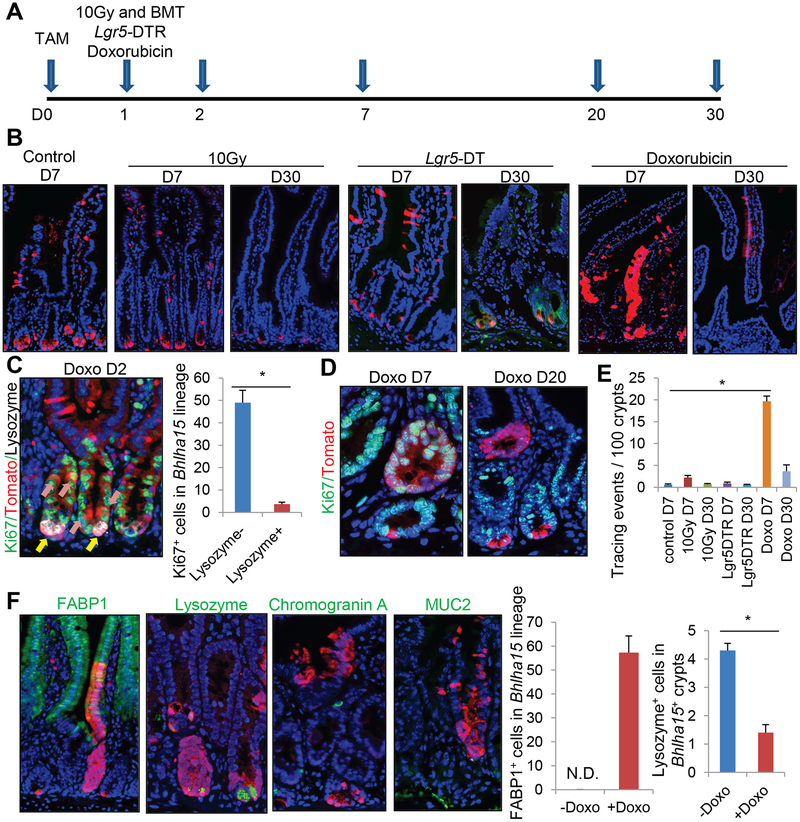
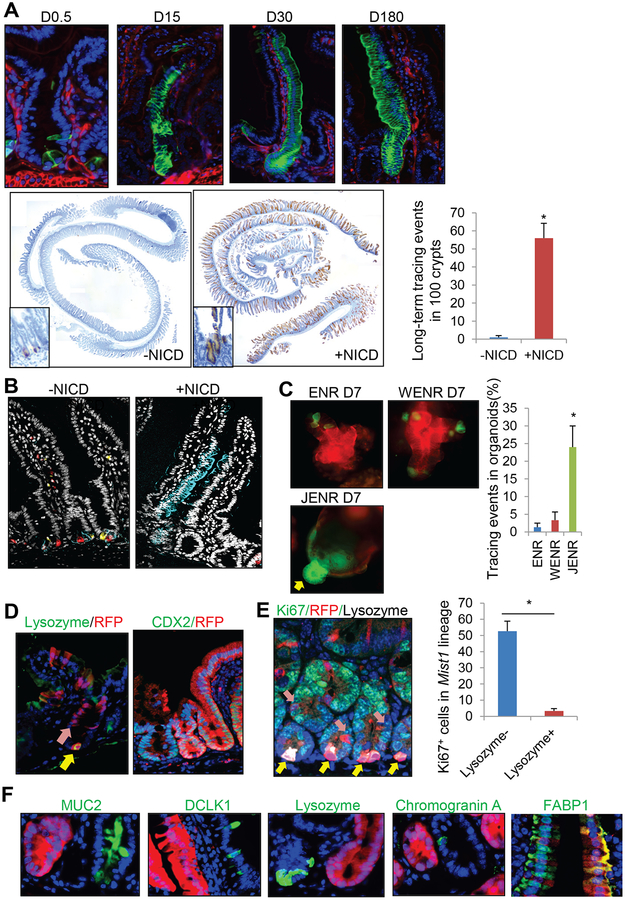
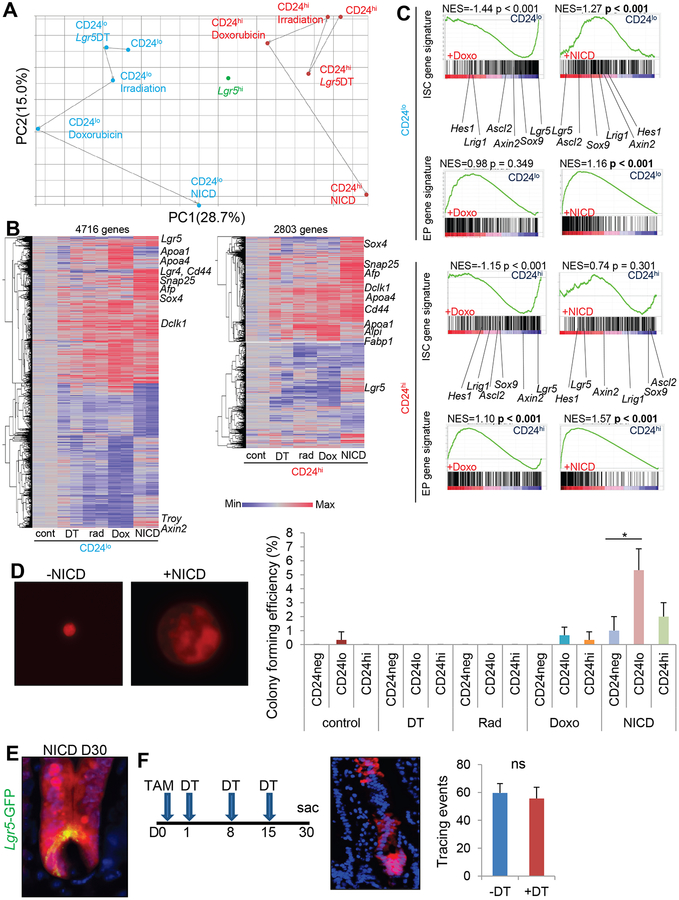
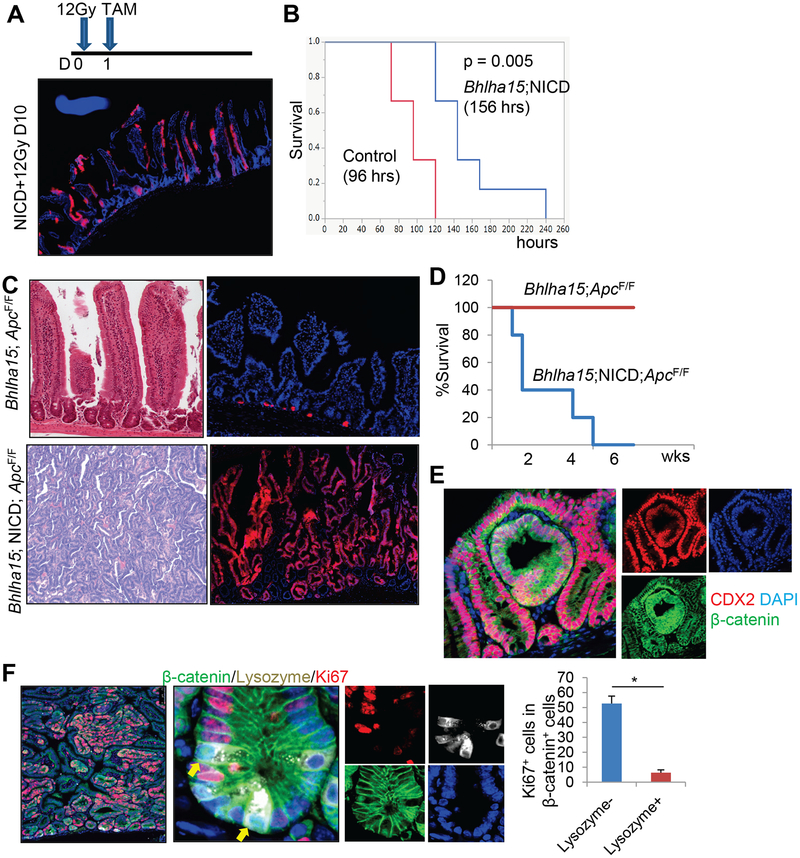
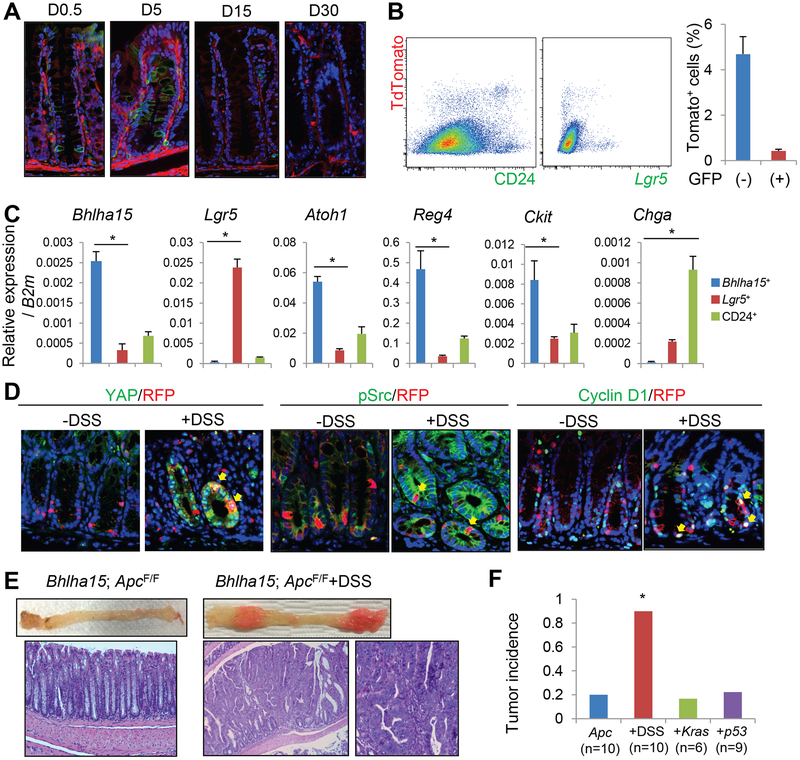
Results: Bhlha15 identified Paneth cells and short-lived secretory precursors (including pre-Paneth label-retaining cells) located just above the ISC zone in the intestinal epithelium. Bhlha15+ cells had no plasticity after loss of Lgr5-positive cells or irradiation. However, Bhlha15+ secretory precursors started to supply the enterocyte lineage after doxorubicin-induced epithelial injury in a Notch-dependent manner. Sustained activation of Notch converts Bhlha15+ secretory precursors to long-lived enterocyte progenitors. Administration of doxorubicin and expression of an activated form of Notch resulted in a gene expression pattern associated with enterocyte progenitors, whereas only sustained activation of Notch altered gene expression patterns in Bhlha15+ precursors toward those of ISCs. Bhlha15+ enterocyte progenitors with sustained activation of Notch formed intestinal tumors with serrated features in mice with disruption of Apc. In the colon, Bhlha15 marked secretory precursors that became stem-like, cancer-initiating cells after dextran sodium sulfate-induced injury, via activation of Src and YAP signaling. In analyses of human colorectal tumors, we associated activation of Notch with chromosome instability-type tumors with serrated features in the left colon.

Conclusions: In mice, we found that short-lived precursors can undergo permanent reprogramming by activation of Notch and YAP signaling. These cells could mediate tumor formation in addition to traditional ISCs.

Keywords: Colon Cancer; Interconversion; Tumorigenesis; Yes Associated Protein 1.


Conflict of interest statement

Disclosures:

The authors disclose no conflicts.

Figures

Figure 1.
Figure 1.. Bhlha15 is expressed in the short-lived secretory precursors.
(A)Lineage tracing in Bhlha15-CreERT;R26-mTmG small intestine at indicated time points after tamoxifen. Yellow allows; Paneth cells, pink arrows; non-Paneth cells. (B)Cell position of Bhlha15+ cells in jejunum. Total 60 crypts from 3 mice were quantified. (C)Immunostaining in Bhlha15-CreERT;R26-TdTomato mice 5 days after tamoxifen. Arrows indicate double-positive cells. (D-F)FACS plot (D), percentage of indicated populations in viable cells (E, n=3), and image (F) of Bhlha15-CreERT;Lgr5-DTR-EGFP;R26-TdTomato mouse intestine 12 hours after tamoxifen. Mean±S.E.M.
Figure 2.
Figure 2.. Transcriptome analysis of Bhlha15-expressing populations.
(A)FACS analysis of Bhlha15-CreERT;R26-TdTomato mouse intestine 2 days after tamoxifen with CD24 immunostaining. Pink boxes indicate CD24neg, CD24lo, and CD24hi population among TdTomato+ cells. (B)PCA analysis of gene expression in TdTomato+CD24lo, TdTomato+CD24hi cells, and whole intestine. (C)Hierarchical clustering of average gene expression in TdTomato+CD24lo and TdTomato+CD24hi cells compared to whole intestine. (D)GSEA analysis for the comparison between TdTomato+CD24lo and TdTomato+CD24hi cells. (E)RT-PCR of sorted TdTomato+CD24neg, TdTomato+CD24lo, and TdTomato+CD24hi population (n=4). (F)Staining (green) in Bhlha15-CreERT;R26-TdTomato mice 1 day after tamoxifen. Yellow arrows; Paneth cells, pink arrows; non-Paneth secretory cells. Mean±S.E.M. *p<0.05.
Figure 3.
Figure 3.. Bhlha15+ precursors show short-term lineage tracing following doxorubicin-induced injury, but do not convert to long-lived ISCs.
(A)Protocol. (B)Lineage tracing images of Bhlha15-CreERT;R26-TdTomato mouse intestine after 10-Gy whole body irradiation, Lgr5-DT ablation, or doxorubicin. WT bone marrow was transplanted after irradiation. (C)Ki67 (green), RFP (red), and Lysozyme (gray) staining on doxorubicin-treated Bhlha15-CreERT;R26-TdTomato mouse at day 2. Numbers of Ki67+ cells in 100 Tomato+Lysozyme+ or Lysozyme cells are quantified. n=3/group. (D)Ki67 (green) and RFP (red) staining on doxorubicin-treated Bhlha15-CreERT;R26-TdTomato mice. (E)Lineage tracing events per 100 glands in Bhlha15-CreERT mouse intestine. n=3/group. (F)Immunostaining (green) of TdTomato-expressing clones in Bhlha15-CreERT;R26-TdTomato mice 7 days after doxorubicin. Numbers of FABP1+ and Lysozyme+ cells in 100 Tomato+ cells are quantified. n=3/group. Mean±S.E.M. *p<0.05.
Figure 4.
Figure 4.. Bhlha15+ precursors show long-term enterocyte-specific lineage tracing with sustained Notch activation.
(A)Lineage tracing images of Bhlha15-CreERT;LSL-Notch1(IC);R26-mTmG (top) and RFP staining and quantification of Bhlha15-CreERT;R26-TdTomato and Bhlha15-CreERT;LSL-Notch1(IC);R26-TdTomato mouse intestine. Tracing events per 100 glands were quantified at 180 days after tamoxifen (n=3). (B)Bhlha15-CreERT;R26-Confetti and Bhlha15-CreERT;LSL-Notch1(IC);R26-Confetti mouse intestines 14 days after tamoxifen. (C)Organoid culture of Bhlha15-CreERT;R26-mTmG mouse intestine. Tamoxifen was given at day 0, and glands were taken after 12 hours. Crypts were cultured with indicated medium for 7 days, and tracing events ratio in total organoids were quantified (n=3). (D)Lysozyme (day5) and CDX2 staining (day30) on Bhlha15-CreERT;LSL-Notch1(IC);R26-TdTomato mice. (E)Ki67 (green), RFP (red), and Lysozyme (gray) staining 4 days after tamoxifen. Numbers of Ki67+ cells in 100 Tomato+Lysozyme+ or Lysozyme cells are quantified. n=3/group. (F)Immunostaining (green) in Bhlha15-CreERT;LSL-Notch1(IC);R26-TdTomato mice. Mean±S.E.M. *p<0.05.
Figure 5.
Figure 5.. Distinct gene profiles in activated Bhlha15+ cells.
(A)PCA analysis of average gene expression (n=2/group) in TdTomato+CD24lo, TdTomato+CD24hi, and Lgr5hi cells after treatment. (B)Hierarchical clustering of gene expression in the individual TdTomato+CD24lo and TdTomato+CD24hi cells compared to the untreated cells. (C)GSEA analysis for the indicated comparison between untreated TdTomato+CD24lo or CD24hi cells and cells after doxorubicin or NICD expression. (D)Representative single cell culture images and colony forming efficiency of each population. Cells were sorted and collected from 3 mice/group, and 1000 singlet cells per well were cultured (3 wells/group). Colony formation rate at day 10 is shown. (E)Bhlha15-CreERT;LSL-Notch1(IC);Lgr5-DTR-EGFP;R26-TdTomato intestines 30 days after tamoxifen. (F)Bhlha15-CreERT;LSL-Notch1(IC);Lgr5-DTR-EGFP;R26-TdTomato intestines 30 days after tamoxifen and DT treatment. Tracing events per 100 glands were quantified. n=3/group. Mean±S.E.M. *p<0.05.
Figure 6.
Figure 6.. NICD+Bhlha15+ progenitors contribute to regeneration and cancer.
(A)Bhlha15-CreERT;LSL-Notch1(IC);R26-TdTomato mice were irradiated at the dose of 12Gy and given tamoxifen at day 1. (B)Survival rate of 12Gy-irradiated Bhlha15-CreERT;R26-TdTomato (n=6) and Bhlha15-CreERT;LSL-Notch1(IC); R26-TdTomato mice (n=5). (C)H&E and TdTomato expression of Bhlha15-CreERT;Apcflox/flox;R26-TdTomato and Bhlha15-CreERT;LSL-Notch1(IC);Apcflox/flox;R26-TdTomato mouse intestine at day 20. (D)Survival curve of Bhlha15-CreERT;Apcflox/flox (red) and Bhlha15-CreERT;LSL-Notch1(IC);Apcflox/flox (blue) mice. (E-F)CDX2 (red) and β-catenin (green) staining (E) and Ki67 (red), Lysozyme (gray), and β-catenin (green) staining (F) of Bhlha15-CreERT;LSL-Notch1(IC);Apcflox/flox mice at day 10. Numbers of Ki67+ cells in 100 β-catenin+Lysozyme+ or β-catenin+Lysozyme cells are quantified (n=3). Mean±S.E.M. *p<0.05.
Figure 7.
Figure 7.. Bhlha15 marks colonic secretary precursors that can lineage trace following injury.
(A)Lineage tracing of Bhlha15-CreERT;R26-mTmG mouse colon. (B)FACS analysis of Bhlha15-CreERT;Lgr5-DTR-EGFP;R26-TdTomato mouse colon 1 day after tamoxifen, gated by CD24 (left) or GFP (right). Percentages of GFP+Tomato+ and GFPTomato+ cells in viable cells are shown (n=3). (C)RT-PCR analysis of sorted TdTomato+CD24+, TdTomatoCD24+, and Lgr5-GFP+ cells (n=3). (D)YAP, pSrc, and cyclin D1 staining (green) of Bhlha15-CreERT;R26-TdTomato mouse colon with or without DSS. Tamoxifen was given 1 day after DSS treatment, then mice were analyzed on next day. (E)Macroscopic images and H&E staining of Bhlha15-CreERT;Apcflox/flox mouse colon with or without DSS treatment. (F)Colon tumor incidence in Bhlha15-CreERT;Apcflox/flox mice with DSS treatment, LSL-KrasG12D, or LSL-Trp53R172H. Mean±S.E.M. *p<0.05.

Similar articles

Cited by

References

    1. Clevers H The intestinal crypt, a prototype stem cell compartment. Cell 2013;154:274–84. - PubMed
    1. Middelhoff M, Westphalen CB, Hayakawa Y, et al. Dclk1-expressing tuft cells: critical modulators of the intestinal niche? Am J Physiol Gastrointest Liver Physiol 2017;313:G285–G299. - PMC - PubMed
    1. Tian H, Biehs B, Chiu C, et al. Opposing activities of Notch and Wnt signaling regulate intestinal stem cells and gut homeostasis. Cell Rep 2015;11:33–42. - PMC - PubMed
    1. Yan KS, Janda CY, Chang J, et al. Non-equivalence of Wnt and R-spondin ligands during Lgr5+ intestinal stem-cell self-renewal. Nature 2017;545:238–242. - PMC - PubMed
    1. Shroyer NF, Helmrath MA, Wang VY, et al. Intestine-specific ablation of mouse atonal homolog 1 (Math1) reveals a role in cellular homeostasis. Gastroenterology 2007;132:2478–88. - PubMed

Publication types

MeSH terms

Substances