

Comparing CMR Mapping Methods and Myocardial Patterns Toward Heart Failure Outcomes in Nonischemic Dilated Cardiomyopathy
- PMID: 30448130
- PMCID: PMC6506397
- DOI: 10.1016/j.jcmg.2018.08.021
Comparing CMR Mapping Methods and Myocardial Patterns Toward Heart Failure Outcomes in Nonischemic Dilated Cardiomyopathy
Abstract
Objectives: In patients with nonischemic dilated cardiomyopathy (NIDCM), native T1, partition coefficient (λGd), and extracellular volume fraction (ECV) mapping may offer prognostic values beyond late gadolinium enhancement (LGE), by scaling the range of myocardial changes.
Background: In patients with NIDCM, LGE is seen in 30% of patients and it indicates adverse prognosis.
Methods: The study mapped 6 anatomical locations using all 4 cardiac magnetic resonance (CMR) tissue-characterizing methods and associated with outcome. The authors performed T1 mapping of the myocardium and the blood pool, before and serially after contrast injection, using a Look-Locker cine gradient-echo technique to obtain T1 and the corresponding reciprocal R1 values. λGd values were derived from the slopes of the least-squares regression lines for myocardial versus blood R1, then adjusted to serum hematocrit to yield ECV.
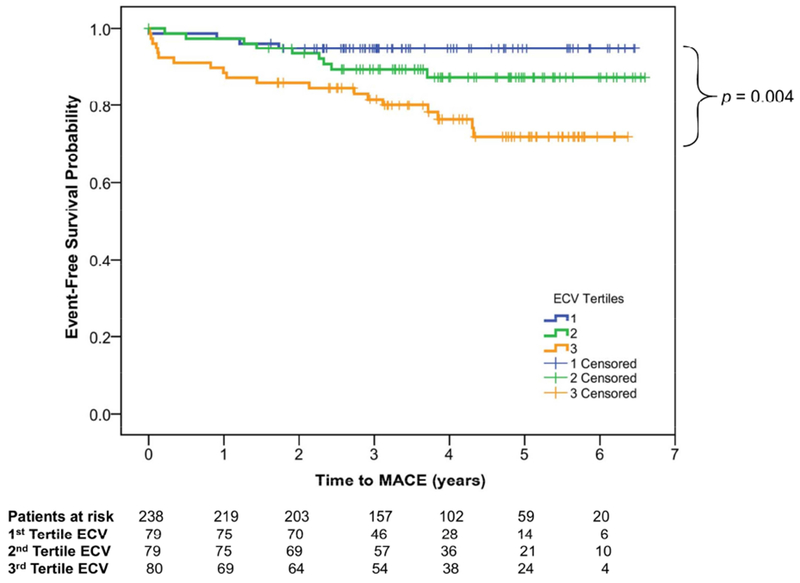
Results: Consecutive 240 NIDCM patients (49 ± 16 years of age; 38% women) underwent CMR for cardiac function, LGE, native T1, λGd, and ECV. After a median of 3.8 years, 36 (15%) experienced major adverse cardiac events (MACE), including 22 heart failure hospitalizations and 14 deaths. Nonischemic LGE was detected in 34%, whereas ECV was elevated (≥1 location) in 58%. Comparing the 4 methods, mean ECV and λGd both demonstrated strong association with MACE (both p < 0.001). In contrast to native T1 and LGE, ECV values from all 6 locations were associated with MACE and death, with the anteroseptum being the most significant (p < 0.0001). The number of abnormal ECV locations correlated linearly with annual MACE rates (p = 0.0003). Mean ECV was the only predictor to enter a prognostic model that contained age, sex, New York Heart Association functional class, and left ventricular ejection fraction. For every 10% increase, mean ECV portended to a 2.8-fold adjusted increase risk to MACE (p < 0.001).
Conclusions: In this study of patients with NIDCM, mapping the myocardial extent of abnormality using ECV offers prognostication toward heart failure outcomes incremental to LGE or native T1 mapping.
Keywords: ECV; NIDCM; dilated cardiomyopathy; native T1; partition coefficient.
Copyright © 2019 American College of Cardiology Foundation. Published by Elsevier Inc. All rights reserved.
Figures


Comment in
-
T1 or ECV?: Depends on the Methods.JACC Cardiovasc Imaging. 2019 Aug;12(8 Pt 2):1670-1672. doi: 10.1016/j.jcmg.2018.10.001. Epub 2018 Nov 15. JACC Cardiovasc Imaging. 2019. PMID: 30448140 No abstract available.
-
Extracellular Volume in Dilated Cardiomyopathy: A New Prognostic Marker on Top of Late Gadolinium Enhancement?JACC Cardiovasc Imaging. 2019 Dec;12(12):2586-2587. doi: 10.1016/j.jcmg.2019.08.029. JACC Cardiovasc Imaging. 2019. PMID: 31806186 No abstract available.
-
The Authors Reply.JACC Cardiovasc Imaging. 2019 Dec;12(12):2587-2588. doi: 10.1016/j.jcmg.2019.09.022. JACC Cardiovasc Imaging. 2019. PMID: 31806187 No abstract available.
References
-
- Wu TJ, Ong JJ, Hwang C et al. Characteristics of wave fronts during ventricular fibrillation in human hearts with dilated cardiomyopathy: role of increased fibrosis in the generation of reentry. J Am Coll Cardiol 1998;32:187–96. - PubMed
-
- Gulati A, Jabbour A, Ismail TF et al. Association of fibrosis with mortality and sudden cardiac death in patients with nonischemic dilated cardiomyopathy. Jama 2013;309:896–908. - PubMed
-
- Kehr E, Sono M, Chugh SS, Jerosch-Herold M. Gadolinium-enhanced magnetic resonance imaging for detection and quantification of fibrosis in human myocardium in vitro. Int J Cardiovasc Imaging 2008;24:61–8. - PubMed
Publication types
MeSH terms
Substances
Grants and funding
LinkOut - more resources
Full Text Sources
Medical
