

Signatures of selection and environmental adaptation across the goat genome post-domestication
- PMID: 30449276
- PMCID: PMC6240954
- DOI: 10.1186/s12711-018-0421-y
Signatures of selection and environmental adaptation across the goat genome post-domestication
Abstract
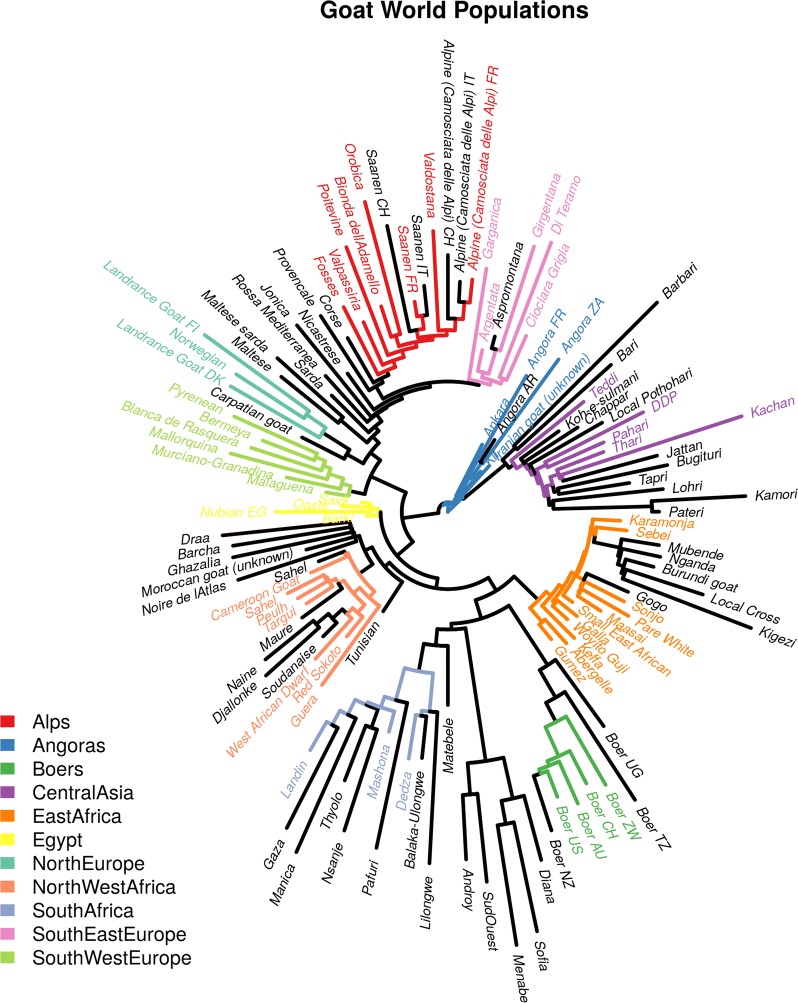
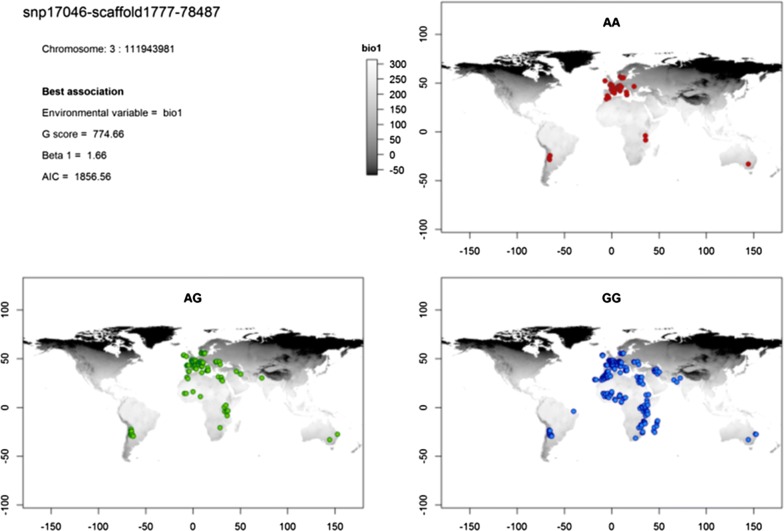
Background: Since goat was domesticated 10,000 years ago, many factors have contributed to the differentiation of goat breeds and these are classified mainly into two types: (i) adaptation to different breeding systems and/or purposes and (ii) adaptation to different environments. As a result, approximately 600 goat breeds have developed worldwide; they differ considerably from one another in terms of phenotypic characteristics and are adapted to a wide range of climatic conditions. In this work, we analyzed the AdaptMap goat dataset, which is composed of data from more than 3000 animals collected worldwide and genotyped with the CaprineSNP50 BeadChip. These animals were partitioned into groups based on geographical area, production uses, available records on solid coat color and environmental variables including the sampling geographical coordinates, to investigate the role of natural and/or artificial selection in shaping the genome of goat breeds.
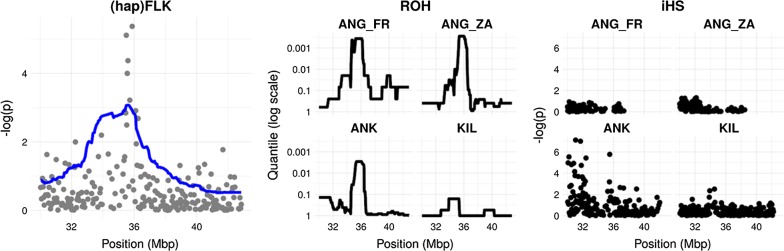
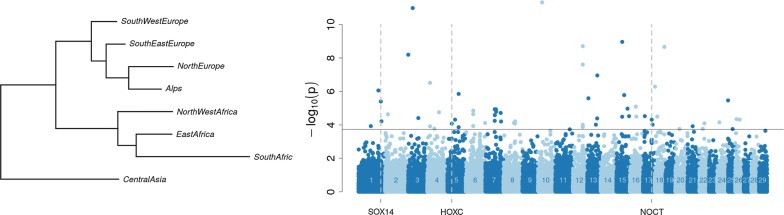
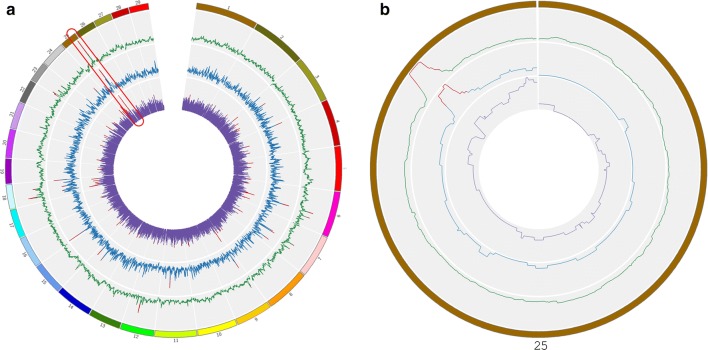
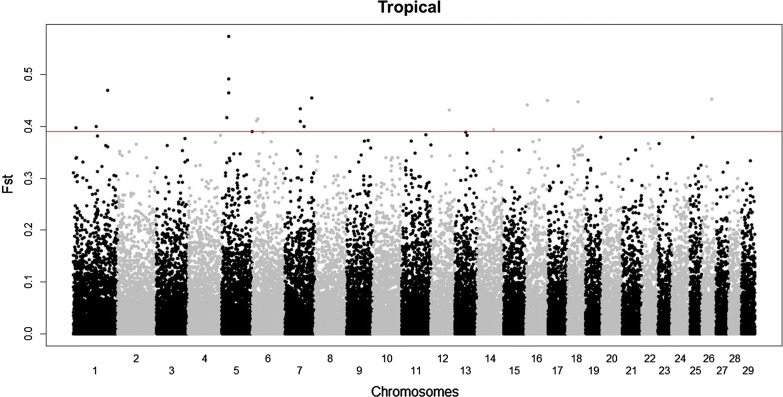
Results: Several signatures of selection on different chromosomal regions were detected across the different breeds, sub-geographical clusters, phenotypic and climatic groups. These regions contain genes that are involved in important biological processes, such as milk-, meat- or fiber-related production, coat color, glucose pathway, oxidative stress response, size, and circadian clock differences. Our results confirm previous findings in other species on adaptation to extreme environments and human purposes and provide new genes that could explain some of the differences between goat breeds according to their geographical distribution and adaptation to different environments.
Conclusions: These analyses of signatures of selection provide a comprehensive first picture of the global domestication process and adaptation of goat breeds and highlight possible genes that may have contributed to the differentiation of this species worldwide.
Figures
References
-
- http://www.fao.org/faostat/en/ Accessed 10 February 2017.
-
- Skapetas B, Bampidis V. Goat production in the World: present situation and trends. Livest Res Rural Dev. 2016;28:200.
-
- FAO. The second report on the state of the world’s animal genetic resources for food and agriculture. BD Scherf, D. Pilling edditors. FAO Commission on Genetic Resources for Food and Agriculture Assessments. Rome. 2015.
MeSH terms
LinkOut - more resources
Full Text Sources
Other Literature Sources
Research Materials
