. 2018 Nov 14;24(5):625-636.e5.
doi: 10.1016/j.chom.2018.10.005. Epub 2018 Oct 25.

Mitochondria-Derived Vesicles Deliver Antimicrobial Reactive Oxygen Species to Control Phagosome-Localized Staphylococcus aureus

Affiliations

Mitochondria-Derived Vesicles Deliver Antimicrobial Reactive Oxygen Species to Control Phagosome-Localized Staphylococcus aureus

Basel H Abuaita et al. Cell Host Microbe. .

Abstract

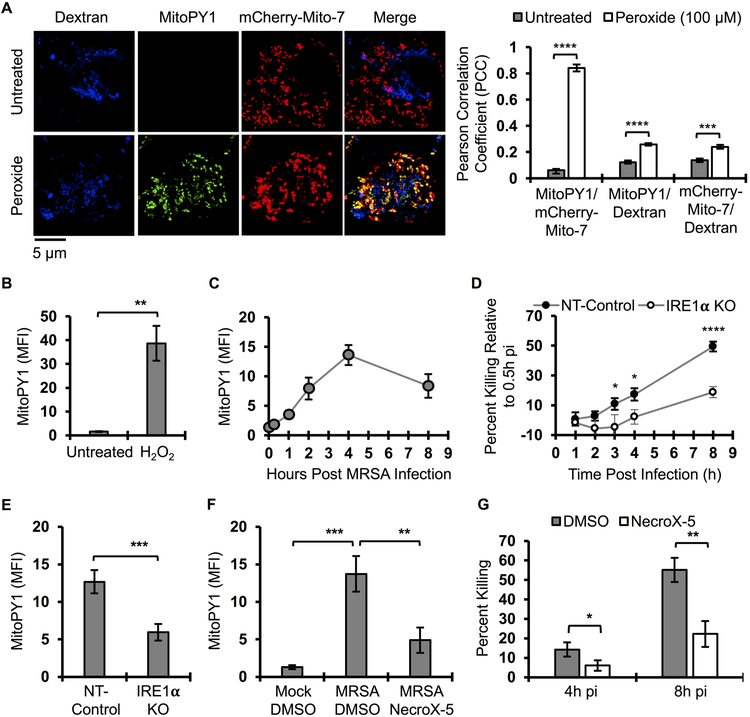
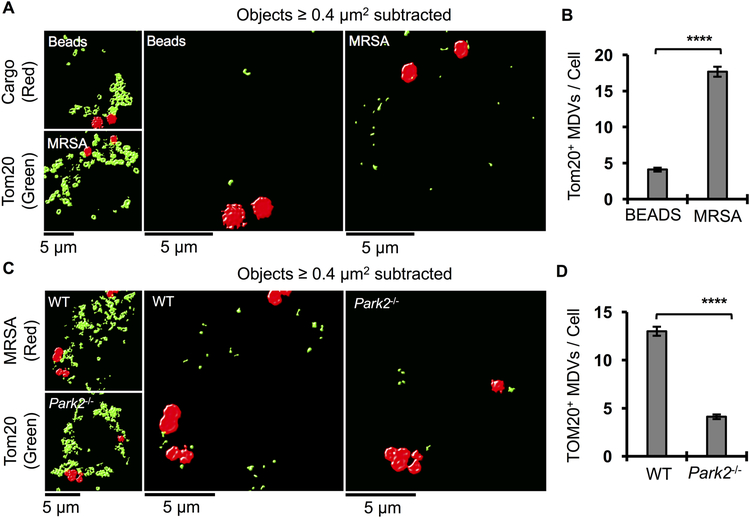
Pathogenic bacteria taken up into the macrophage phagosome are the target of many anti-microbial mechanisms. Although mitochondria-derived antimicrobial effectors like reactive oxygen species (mROS) aid in bacterial killing, it is unclear how these effectors reach bacteria within the phagosomal lumen. We show here that endoplasmic reticulum stress triggered upon methicillin-resistant Staphylococcus aureus (MRSA) infection induces mROS that are delivered to bacteria-containing phagosomes via mitochondria-derived vesicles (MDVs). The endoplasmic reticulum stress sensor IRE1α induces mROS, specifically hydrogen peroxide (mH2O2), upon MRSA infection. MRSA infection also stimulates the generation of MDVs, which require the mitochondrial stress response factor Parkin, and contributes to mH2O2 accumulation in bacteria-containing phagosomes. Accumulation of phagosomal H2O2 requires Toll-like receptor signaling and the mitochondrial enzyme superoxide dismutase-2 (Sod2), which is delivered to phagosomes by MDVs. Sod2 depletion compromises mH2O2 production and bacterial killing. Thus, mitochondrial redox capacity enhances macrophage antimicrobial function by delivering mitochondria-derived effector molecules into bacteria-containing phagosomes.


Conflict of interest statement

Declaration of Interests

The authors declare no competing interests.

Figures

Figure 1.
Figure 1.. MRSA infection stimulates bactericidal mH2O2 via IRE1α
(A) Representative live fluorescence images of RAW264.7 macrophages transfected with mCherry-Mito-7 expressing plasmid, pulsed with Cascade Blue Dextran (molecular weight 10,000) for 24h, followed by a 1h pulse with MitoPY1. Cells were then treated with H2O2 (100 μM) or left untreated. Images were acquired on a Leica TCS SP8 confocal scanning microscope. Quantification of co-localization (Pearson Correlation Coefficient, PCC) between mCherry-Mito-7, Dextran and MitoPY1 was performed with Huygens Essential imaging software. Graph is presented as the mean of at least 150 cells for each condition from n≥3 independent experiments +/− standard error of the mean (SEM). (B) Flow cytometric analysis of mean fluorescence intensity (MFI) of macrophages after a pulse with MitoPY1 for 1h and chased with unlabeled medium with or without H2O2. (C) Time course measurement of MFI of macrophages pulsed with MitoPY1 for 1h, infected with MRSA and monitored over time by flow cytometry. (D) Time course measurement of MRSA intracellular killing by NT-control and IRE1α-deficient macrophages. Percent killing was calculated using the following formula [1 - (CFUindicated time points / CFU0.5h pi)] X 100. (E) Flow cytometric analysis of IRE1α KO macrophages and NT-control after 1 hr labeling with MitoPY1, followed by MRSA infection and analyzed at 4h pi. (F) Flow cytometric analysis of macrophages labeled with MitoPY1 for 1h and infected with MRSA for 4h in the presence or absence of mROS scavenger, NecroX-5. (G) Percent intracellular MRSA killing by macrophages in the presence and absence of NecroX-5. Percent killing was calculated using the following formula [1 - (CFUindicated time points / CFU1h pi)] X 100. MFI of MitoPY1 quantification was determined using FlowJo software, representing the geometric mean. MFI obtained from unstained cells was subtracted from the MFI of all stained samples. Unless otherwise indicated, graphs are presented as the mean of n≥3 independent experiments +/− SD. pValue: *< 0.05, **< 0.01, ***< 0.001 and ****<0.0001.
Figure 2.
Figure 2.. TLR signaling controls mH2O2 accumulation in the bacterial phagosome
(A) Representative fluorescence microscopy of RAW264.7 macrophages pulsed with MitoPY1 (green) for 1h and treated with beads (red), or infected with live MRSA-mCherry or fixed MRSA-mCherry for 4h. Images were acquired on an Olympus IX-70 inverted live-cell fluorescence microscope and analyzed with MetaMorph imaging software. (B) Quantification of MitoPY1 MFI associated with macrophage phagosomes using ImageJ software. Phagosomes were defined by the area in the cell where red fluorescent beads or MRSA were localized. (C) Time lapse imaging of macrophages pulsed with MitoPY1 for 1h (green) and then infected with MRSA-mCherry (red). Time shown as minutes:seconds. (D) Live microscopy images of WT and TLR 2/4/9-deficient (TLR2/4/9 KO) bone marrow-derived macrophages pulsed with MitoPY1 (green) for 1h and then infected with MRSA-mCherry (red) for 4h. (E) Quantification of MFI of MitoPY1 associated with phagosomes from WT and TLR2/4/9-deficient macrophages using similar criteria as in panel B. Graphs represent averages of MitoPY1 MFI from n≥305 phagosomes for each group, pooled from at least 3 independent experiments +/−SEM. pValue: *< 0.05 and ****< 0.0001.
Figure 3.
Figure 3.. MRSA infection induces Parkin-dependent MDVs
(A) Representative images of bone marrow-derived macrophages stimulated with beads (red) or infected with MRSA (red) for 4h and stained with anti-Tom20 (green) antibody. Images were acquired on a Leica TCS SP8 scanning confocal microscope and deconvoluted using Huygens Essential software. Right panels are processed images after subtraction of Tom20+ large objects (surface area ≥ 0.4 μm2). (B) Quantification of the number of Tom20+ small objects (surface area < 0.4 μm2) per macrophage stimulated with beads or infected with MRSA. Deconvoluted confocal images were processed by Huygens Essential software using the following criteria; 10% threshold, 10% seed and garbage of 50. Tom20+ objects with surface area larger than 0.4 μm2 were filtered out and the remaining objects were enumerated per cell. Graph represents the mean of at least 107 cells for each group, pooled from 3 independent experiments +/− SEM. (C) Representative confocal images of WT and Parkin deficient (Park2−/−) bone marrow-derived macrophages infected with MRSA for 4h. Images were processed using similar criteria as in panel A. (D) Quantification of Tom20+ smaller objects (surface area < 0.4 μm2) from WT and Parkin-deficient macrophages infected with MRSA. Confocal microscopy images processed as in panel B and presented as mean +/− SEM from n≥135 cells for each group, pooled from 3 independent experiments. Macrophages were derived from ≥ 2 WT and 2 Park2−/− animals. pValue: ****<0.0001.
Figure 4.
Figure 4.. Parkin promotes bacterial killing and enhances immunity to MRSA infection
(A) Flow cytometric analysis of WT and Parkin-deficient macrophages pulsed with MitoPY1 for 1h, followed by MRSA infection for 4h. Data are represented as geometric mean of n≥3 independent experiments +/− SD. Macrophages were derived from ≥ 2 WT and 2 Park2−/− animals. (B) Representative live fluorescence wide-field microscopy images of WT and Parkin deficient macrophages pulsed with MitoPY1 (green) for 1h followed by infection with MRSA-mCherry (red). Images were acquired at 4h pi and processed with MetaMorph software. (C) Ratiometric measurement of MitoPY1 fluorescent intensity of phagosomes relative to total cellular fluorescent intensity (MFI-phagosome/MFI-cell). Phagosomes were defined by the area of the cell where the red fluorescent MRSA-mCherry were located. Data presented are the mean from n≥384 phagosomes for each group, pooled from 3 independent experiments +/− SEM. Macrophages were derived from ≥ 2 WT and 2 Park2−/− animals. (D) Time course measurement of MRSA intracellular killing by WT and Parkin-deficient bone marrow-derived macrophages. Percent killing indicates percent difference in CFU obtained at the indicated time point relative to 0.5h pi. Data presented are the mean of n≥3 independent experiments +/− SD. Macrophages were derived from ≥ 2 WT and 2 Park2−/− animals. (E-F) Percent of Staphylococcus epidermidis or Salmonella Typhimurium killing by WT and Parkin-deficient macrophages. Percent killing indicates percent difference in CFU obtained at the indicated time point relative to 1h pi, and represents the mean of n≥3 independent experiments +/− SD. Macrophages were derived from ≥ 2 WT and 2 Park2−/− animals. (G) Bacterial burden in abscesses excised from male and female wild-type (WT) and Parkin-deficient C57BL/6 mice (Park2−/−) infected subcutaneously with 107 CFU of MRSA for 3 days. Horizontal lines represent the mean of n=13 WT and n=12 Park2−/− mice. Data are pooled from 2 independent experiments. (H-I) KC or IL1β cytokine levels in subcutaneous skin abscess homogenates of WT and Park2−/− mice. Cytokine levels were measured by ELISA. Data are presented as the mean of n=13 WT and n=12 Park2−/− mice pooled from 2 independent experiments. pValue: *< 0.05, **< 0.01, ***<0.001 and ****< 0.0001.
Figure 5.
Figure 5.. Parkin and Pink1 contribute to MRSA killing independently from mitophagy
(A-B) Percent of MRSA intracellular killing by WT and Park2−/− or WT and Pink1−/− bone marrow-derived macrophages. (C) Immunoblot analysis of cell lysates from RAW264.7 macrophages expressing shRNA specific to mouse Drp1 (Drp1 KD) or non-target control (NT-Control). GAPDH was used as a loading control. (D) Percent of MRSA intracellular killing by NT-Control and Drp1 KD RAW264.7 macrophages as calculated by the difference in CFU obtained at the indicated time point relative to 1h pi. Data shown represent the mean of n≥3 independent experiments +/− SD. (E) Percent of MRSA intracellular killing by RAW264.7 macrophages when treated with 100 μM of control peptide (Ctrl peptide) or NEMO Binding Domain peptide inhibitor (NEMO inhibitor). Percent killing was calculated with the following formula [1 - (CFU indicated time points / CFU 1h pi)] X 100 and presented as the mean of n≥3 independent experiments +/− SD. pValue: *< 0.05, **< 0.01 and ***< 0.001.
Figure 6.
Figure 6.. Sod2 is the mitochondrial payload delivered to the phagosome to promote MRSA killing
(A) Representative confocal microscopy images of RAW264.7 macrophages infected with MRSA (blue) or stimulated with beads (blue) for 4h and stained for Lamp1 (red) and Sod2 (green). Images were acquired using a Leica TCS SP8 confocal scanning microscope and deconvoluted using Huygens Essential software. (B) Confocal microscopy images of a magnified area of macrophages where bead or MRSA-containing phagosomes were observed. Large Sod2+ network objects with surface area larger than 0.4 μm2 were subtracted from the images as described in Fig. S3. (C) Quantification of Sod2+ small objects (surface area < 0.4 μm2) within a 2 μm2 area around beads or MRSA. Large Sod2+ objects were filtered out of the deconvoluted images and the number of remaining Sod2+ objects were enumerated per 2 μm2 areas of the cell where MRSA or beads were localized. Data represent the mean of at least 60 phagosomes for each group from 3 independent experiments. (D) Immunoblots of cell lysate from RAW264.7 macrophages stably transduced with lentivirus-encoded shRNA for non-target (NT-Control) or Sod2 (Sod2 KD), probed with anti-Sod2 antibody, or anti-Actin antibody as a loading control. (E) Flow cytometric analysis of RAW264.7 Sod2 KD or NT-control macrophages after a 1h pulse with MitoPY1, followed by MRSA infection for 4h. Data were analyzed with FlowJo software. MFI represents geometric mean of n≥3 independent experiments +/− SD. (F) Intracellular MRSA killing by Sod2 KD and NT-control macrophages was calculated by the difference in CFU obtained at the indicated time point relative to 1h pi. Graph bars represent the mean percent killing of n≥3 independent experiments +/− SD. (G) MRSA susceptibility to different concentrations of hydrogen peroxide in vitro. Graph represents the mean percent killing from n≥3 independent experiments +/− SD. pValue: *< 0.05, ***< 0.001 and ****< 0.0001.
Figure 7.
Figure 7.. Parkin and Pink1 regulate MRSA-induced Tom20+ and Sod2+ MDV formation
(A) Representative confocal microscopy images of WT and Park2−/− bone marrow-derived macrophages infected with MRSA for 4h (blue) and stained for Tom20 (green) and Sod2 (red). Images were acquired using a Leica TCS SP8 confocal scanning microscope and deconvoluted using Huygens Essential software. Right panels are processed images after subtraction of Tom20+ and Sod2+ large objects (surface area ≥ 0.4 μm2). (B) Quantification of different subsets of MDV formed by WT and Park2−/− macrophages infected with MRSA. Deconvoluted confocal images were processed by Huygens Essential software using the following criteria; 10% threshold, 10% seed and garbage of 50. Tom20+ and Sod2+ objects with surface area larger than 0.4 μm2 were filtered out and the remaining objects enumerated on a per cell basis for whether they were single or double positive for Tom20 and Sod2. Graphs are presented as the mean of n≥114 cells derived from ≥ 2 WT and 2 Park2−/− mice, and pooled from 3 independent experiments +/− SEM. (C) Quantification of MDVs that are single and double positive for Tom20 and Sod2 in WT and Pink1−/− bone marrow-derived macrophages during MRSA infection. Data were acquired using the same criteria as in panel B and presented as the mean of n≥113 cells derived from 1 WT mouse or 1 Pink1−/− mouse, and pooled from 3 independent experiments +/− SEM. pValue: ***< 0.001 and ****< 0.0001.

Comment in

  • MDVs: Spare the SOD and Spoil the Bug.
    Hussain SS, Kashatus DF. Hussain SS, et al. Cell Host Microbe. 2018 Nov 14;24(5):616-618. doi: 10.1016/j.chom.2018.10.013. Cell Host Microbe. 2018. PMID: 30439336

References

    1. Abuaita BH, Burkholder KM, Boles BR, and O’Riordan MX (2015). The Endoplasmic Reticulum Stress Sensor Inositol-Requiring Enzyme 1alpha Augments Bacterial Killing through Sustained Oxidant Production. mBio 6, e00705. - PMC - PubMed
    1. Al-Qahtani AA, Al-Anazi MR, Al-Zoghaibi FA, Abdo AA, Sanai FM, Al-Hamoudi WK, Alswat KA, Al-Ashgar HI, Khan MQ, Albenmousa A, et al. (2016). PARK2 polymorphisms predict disease progression in patients infected with hepatitis C virus. Ann Hepatol 15, 824–833. - PubMed
    1. Bidani A, Reisner BS, Haque AK, Wen J, Helmer RE, Tuazon DM, and Heming TA (2000). Bactericidal activity of alveolar macrophages is suppressed by V-ATPase inhibition. Lung 178, 91–104. - PubMed
    1. Boles BR, and Horswill AR (2008). Agr-mediated dispersal of Staphylococcus aureus biofilms. PLoS pathogens 4, e1000052. - PMC - PubMed
    1. Bronner DN, Abuaita BH, Chen X, Fitzgerald KA, Nunez G, He Y, Yin XM, and O’Riordan MX (2015). Endoplasmic Reticulum Stress Activates the Inflammasome via NLRP3- and Caspase-2-Driven Mitochondrial Damage. Immunity 43, 451–462. - PMC - PubMed

Publication types

MeSH terms