. 2018 Nov 13;11(5):1061-1074.
doi: 10.1016/j.stemcr.2018.09.013. Epub 2018 Oct 25.

Early Human Hemogenic Endothelium Generates Primitive and Definitive Hematopoiesis In Vitro

Affiliations

Early Human Hemogenic Endothelium Generates Primitive and Definitive Hematopoiesis In Vitro

Eva Garcia-Alegria et al. Stem Cell Reports. .

Abstract

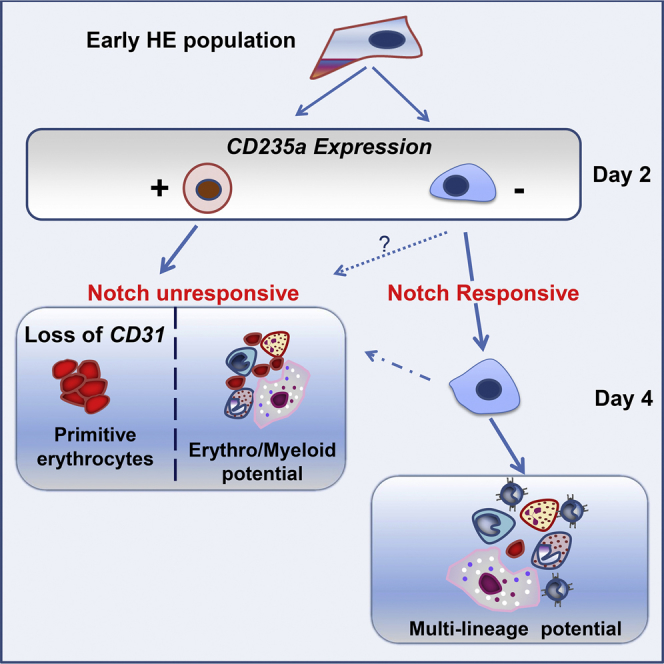
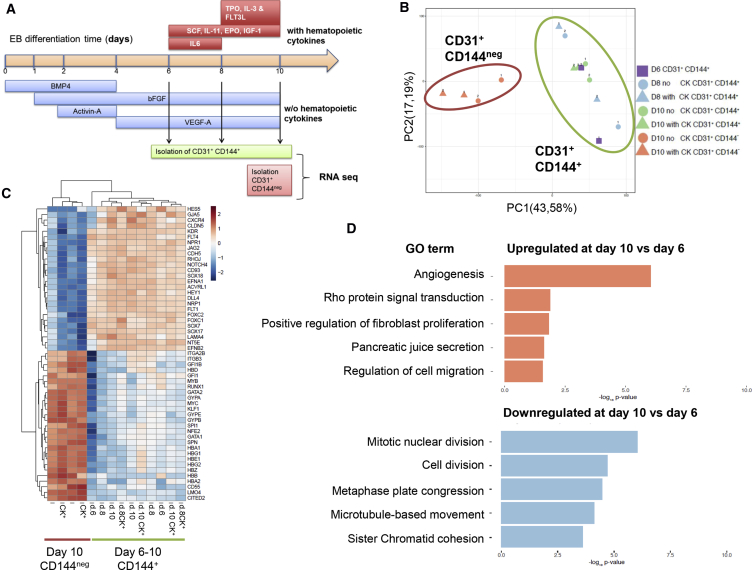
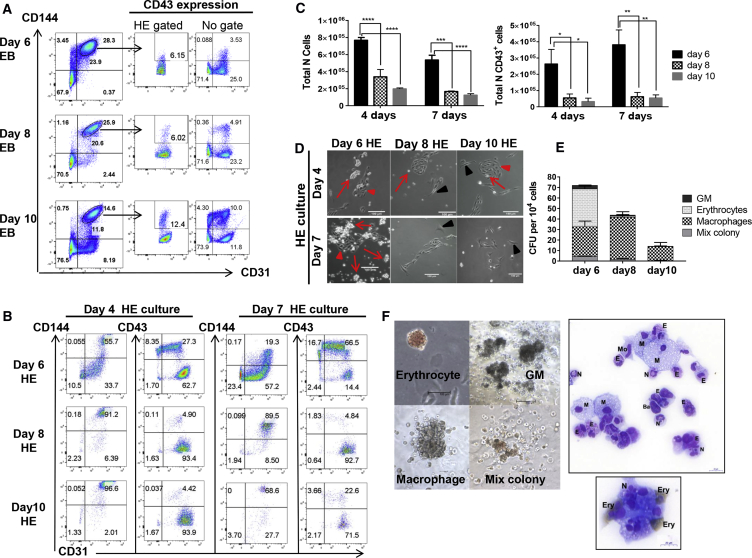
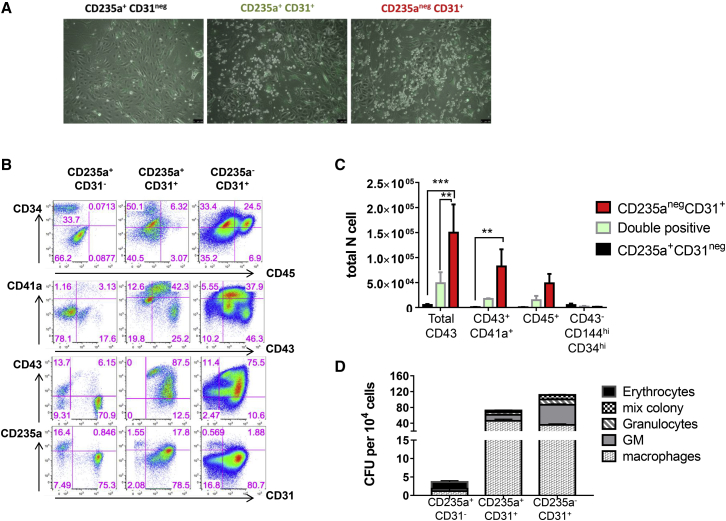
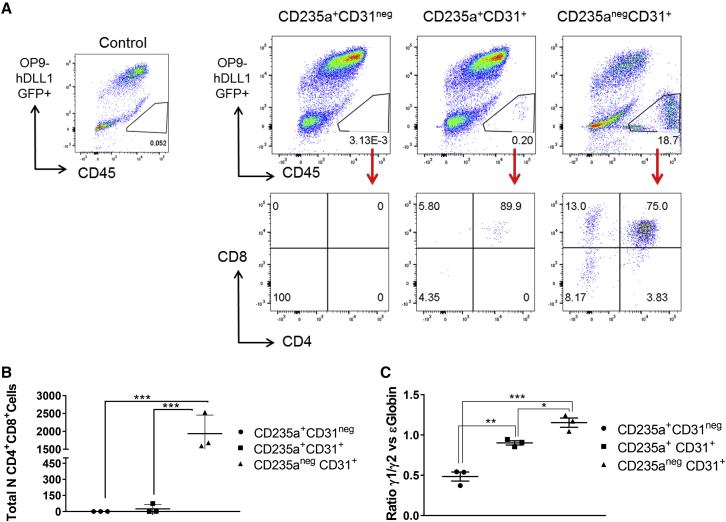
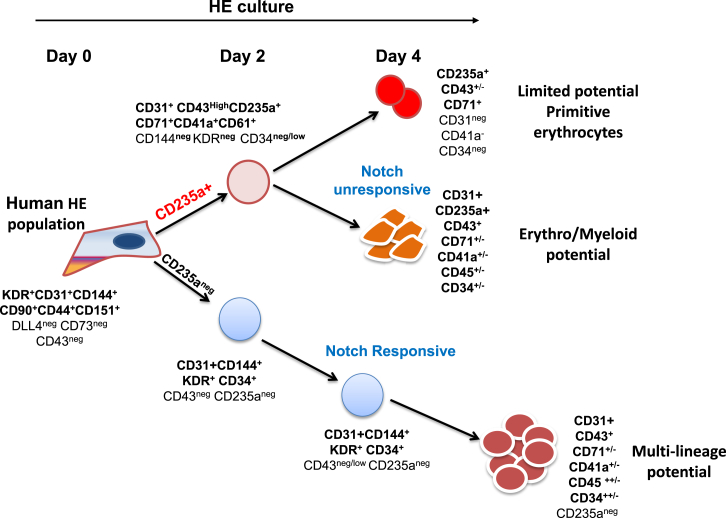
The differentiation of human embryonic stem cells (hESCs) to hematopoietic lineages initiates with the specification of hemogenic endothelium, a transient specialized endothelial precursor of all blood cells. This in vitro system provides an invaluable model to dissect the emergence of hematopoiesis in humans. However, the study of hematopoiesis specification is hampered by a lack of consensus in the timing of hemogenic endothelium analysis and the full hematopoietic potential of this population. Here, our data reveal a sharp decline in the hemogenic potential of endothelium populations isolated over the course of hESC differentiation. Furthermore, by tracking the dynamic expression of CD31 and CD235a at the onset of hematopoiesis, we identified three populations of hematopoietic progenitors, representing primitive and definitive subsets that all emerge from the earliest specified hemogenic endothelium. Our data establish that hemogenic endothelium populations endowed with primitive and definitive hematopoietic potential are specified simultaneously from the mesoderm in differentiating hESCs.

Keywords: definitive hematopoiesis; hESC; hemogenic endothelium; multilineage potential; primitive hematopoiesis.


Figures

None
Graphical abstract
Figure 1
Figure 1
Transcriptional Landscape of CD31+CD144+ Populations along the EB Differentiation Time (A) Design of the experiment: CD31+CD144+ populations were isolated along the embryoid body (EB) differentiation timeline with or without the addition of hematopoietic cytokines at the indicated times. CD31+CD144 populations were obtained from day 10 of differentiation. (B) PCA plot obtained from the transcriptomic analysis of the CD31+CD144+ populations isolated at days 6, 8, and 10 of EB differentiation with or without hematopoietic cytokines (CK) added as well as the hematopoietic-committed CD31+CD144 populations. (C) Heatmap of representative endothelial and hematopoietic genes differently expressed between CD31+CD144+ and CD31+CD144 populations. (D) Gene ontology (GO) of biological process terms enriched or downregulated in connection with the timing of CD31+CD144+ isolation were identified using the annotation on line tool DAVID. Data are based on the DEGs obtained between days 6 and 10 of EB differentiation.
Figure 2
Figure 2
Characterization of Human HE along Human EB Differentiation (A) Flow cytometry analysis of CD31+CD144+ populations at different times of EB differentiation (representative plots from four different experiments). Circled gates indicate the HE-enriched isolated populations along with the percentage of CD43+ cells found within these gated populations or without gating. CD31+CD144+CD43+ cells were excluded during the sort. (B) Kinetic of endothelial (CD31+CD144+) and hematopoietic (CD43+) profiles obtained after re-plating in hematopoietic condition the purified CD31+CD144+ populations obtained at days 6, 8, and 10 of EB differentiation. Data are representative of three independent experiments after 4 and 7 days in culture on gelatin-coated plates. (C) Quantification and statistical analysis of the total number of cells and hematopoietic-committed cells (CD43+) generated at days 4 and 7 of culture. Error bars indicate the SEM of data from three independent experiments. The significance of the difference between samples was confirmed using two-way ANOVA; p value: adjusted p value using SIDAK multiple comparison: p < 0.05, ∗∗p < 0.001, ∗∗∗p = 0.0002, ∗∗∗∗p < 0.0001. (D) Representative pictures of CD31+CD144+ populations isolated at the indicated times of EB differentiation after 4 and 7 days of culture on gelatin-coated plates in hematopoietic-inducing condition. Red arrows indicate endothelial clusters with hemogenic ability. Red arrowheads indicate emerging blood cells and clusters of blood cells. Black arrowheads indicate endothelial cell clusters with no hemogenic potential. (E) Quantification of colony-forming unit (CFU) potential of 104 cells harvested after 4 days of culture from the CD31+CD144+ populations isolated at days 6, 8, and 10 of EB differentiation. Error bars indicate the SEM of data from three independent experiments. (F) Pictures of representative colonies and cytospin of cells stained with O-dianisidine MGG. Scale bars, 100 μm. M, macrophages; N, neutrophils; E, eosinophils; Ba, basophils; Mo, monocytes; Ery, erythrocytes. Brown staining is indicative of hemoglobinization of the erythrocytes. Scale bars, 20 μm.
Figure 3
Figure 3
Hematopoietic Progression from EB Day 6-Sorted HE-Enriched Population (A) Flow cytometric analysis showing the immuno-phenotype of hematopoietic populations obtained at days 2, 3, and 4 of the culture of CD144+CD31+ cells on gelatin-coated plates in hematopoietic-inducing conditions. Data are representative of five independent experiments. (B) Progression of the immuno-phenotype of hematopoietic populations obtained after 7 days of culture on gelatin-coated plates. Data are representative of five independent experiments. (C) Phenotypic characterization of the different cell populations defined by CD235a and CD31 expression after 7 days of HE culture on gelatin. Data are representative of five independent experiments.
Figure 4
Figure 4
Hematopoietic Potential of CD235a/CD31 Populations (A) Schematic of the experimental design. HE-enriched cells were isolated at day 6 of EB differentiation and co-cultured on OP9 or OP9-hDLL1 stroma for 4 days. At this time point, based on their expression of CD235a and CD31, three populations were isolated and their clonogenic and T cell potential was tested. Further co-culture of each isolated population was carried on OP9-hDLL1 during 7 days, at which time further flow cytometry analysis and CFU assays were performed. (B) Clonogenic potential obtained from the CD235a/CD31 populations isolated after 4 days of co-culture OP9 or OP9-hDLL1 on stroma cell. Error bars indicate the SEM of data from three independent experiments. (C) Representative pictures of hematopoietic colonies obtained from the indicated populations after 14 days in clonogenic assay (n = 3). Black arrows indicate erythroid colonies; arrowhead indicates macrophage colony and asterisks indicate granulo-macrophage colonies. Scale bars, 100 μm.
Figure 5
Figure 5
The Multilineage Potential of CD31+ Cells Is Maintained on Stroma Co-culture (A) Representative endothelial and hematopoietic cell morphologies displayed by the different CD235a/CD31 populations after purification and co-culture on OP9-hDLL1 stroma cells (n = 3). Scale bars, 100 μm. (B) Representative flow cytometric analysis of the indicated populations after 7 days of culture on OP9-hDLL1 stroma cells (n = 3). (C) Quantification and statistical analysis of the total number of cells obtained after 7 days of culture. Differences between each population were analyzed by two-way ANOVA. Error bars indicate the SEM from three independent experiments; adjusted p values using Turkey multiple comparison test: ∗∗p < 0.002, ∗∗∗p < 0.0001. (D) Quantification of CFU potential of 104 cells obtained after 7 days of culture from the indicated populations. Error bars indicate the SEM of data from three independent experiments.
Figure 6
Figure 6
Characterization of Definitive Hematopoietic Potential of the CD31/CD235a Populations (A) T lymphoid potential displayed by the indicated populations after culture on OP9-DLL1. After 1 month, cells were harvested and stained for CD45, CD4, and CD8 expression. Flow cytometric analyses are representative of three independent experiments. Stroma cells were excluded based on their high GFP expression as seen on the control OP9-only culture dot plot on the right. (B) Quantification and statistical analysis of the total number of lymphoid cells obtained in each experiment. Differences between each population were analyzed by two-way ANOVA. Error bars indicate the SEM from three independent experiments. Adjusted p value using Turkey multiple comparison test: ∗∗∗p ≤ 0.0006. (C) Globin expression in cells of hematopoietic colonies obtained from the indicated populations after 2 weeks in methylcellulose culture. Quantification and statistical analysis of the ratio between gamma γ1/2 and epsilon ɛ globin expression analyzed by RT-PCR. Error bars indicate the SEM from three independent experiments. Adjusted p value using SIDAK's multiple comparison test: p = 0.0326, ∗∗p = 0.0028, ∗∗∗p = 0.0002.
Figure 7
Figure 7
Simultaneous Waves of Hematopoietic Differentiation from HE-Enriched Cell Population Hematopoietic differentiation from HE isolated at day 6 of differentiation. The first hematopoietic wave differentiates rapidly, is detected within 2 days of culture and is characterized by the expression of the hematopoietic marker CD235a and the loss of CD144 and KDR, endothelial and mesodermal markers, respectively (all positive markers in bold characters). From this first wave, two hematopoietic populations emerge by day 4 and are discriminated by CD31 expression. Loss of this marker is accompanied by a reduced clonogenic potential and restriction to primitive erythrocytes. A second wave of hematopoiesis emerging from the same HE-enriched population does not express CD235a and retains endothelial marker expression. This population does not generate CD235a+ cells, but gives rise to large numbers of CD45+ cells and T cells in culture. The hematopoietic populations generated from this second wave present multilineage potential and are Notch responsive.

References

    1. Ayllon V., Bueno C., Ramos-Mejia V., Navarro-Montero O., Prieto C., Real P.J., Romero T., Garcia-Leon M.J., Toribio M.L., Bigas A. The Notch ligand DLL4 specifically marks human hematoendothelial progenitors and regulates their hematopoietic fate. Leukemia. 2015;29:1741–1753. - PubMed
    1. Cao G., Savani R.C., Fehrenbach M., Lyons C., Zhang L., Coukos G., Delisser H.M. Involvement of endothelial CD44 during in vivo angiogenesis. Am. J. Pathol. 2006;169:325–336. - PMC - PubMed
    1. Choi K.D., Vodyanik M.A., Togarrati P.P., Suknuntha K., Kumar A., Samarjeet F., Probasco M.D., Tian S., Stewart R., Thomson J.A. Identification of the hemogenic endothelial progenitor and its direct precursor in human pluripotent stem cell differentiation cultures. Cell Rep. 2012;2:553–567. - PMC - PubMed
    1. Ditadi A., Sturgeon C.M., Tober J., Awong G., Kennedy M., Yzaguirre A.D., Azzola L., Ng E.S., Stanley E.G., French D.L. Human definitive haemogenic endothelium and arterial vascular endothelium represent distinct lineages. Nat. Cell Biol. 2015;17:580–591. - PMC - PubMed
    1. Ferkowicz M.J., Starr M., Xie X., Li W., Johnson S.A., Shelley W.C., Morrison P.R., Yoder M.C. CD41 expression defines the onset of primitive and definitive hematopoiesis in the murine embryo. Development. 2003;130:4393–4403. - PubMed

Publication types