

Studies in an Early Development Window Unveils a Severe HSC Defect in both Murine and Human Fanconi Anemia
- PMID: 30449320
- PMCID: PMC6234961
- DOI: 10.1016/j.stemcr.2018.10.001
Studies in an Early Development Window Unveils a Severe HSC Defect in both Murine and Human Fanconi Anemia
Abstract
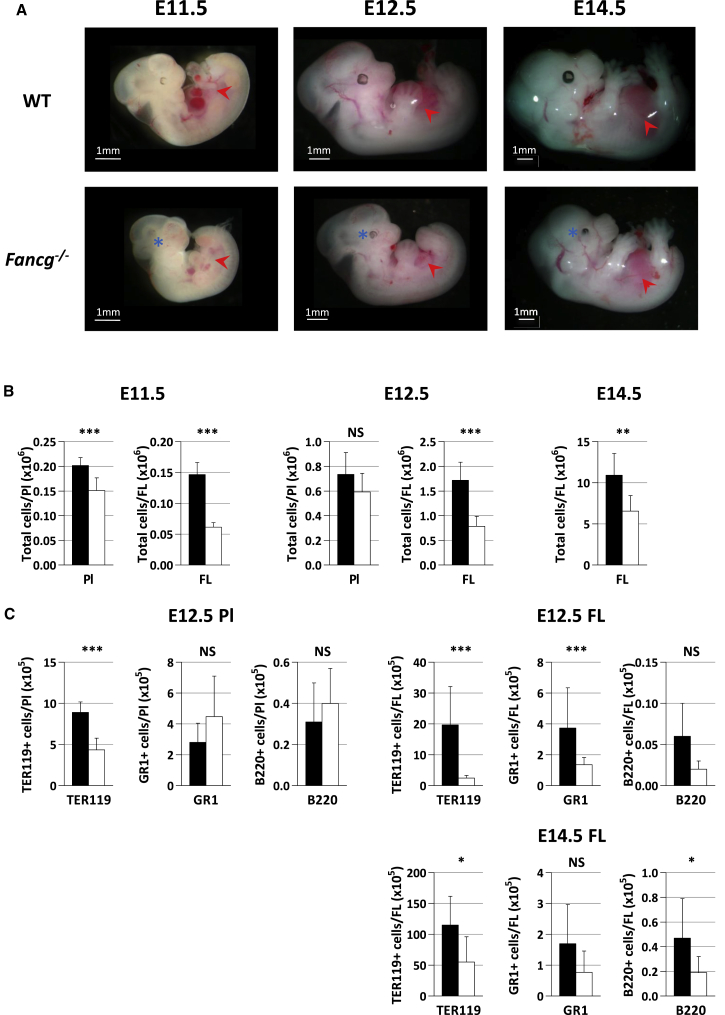
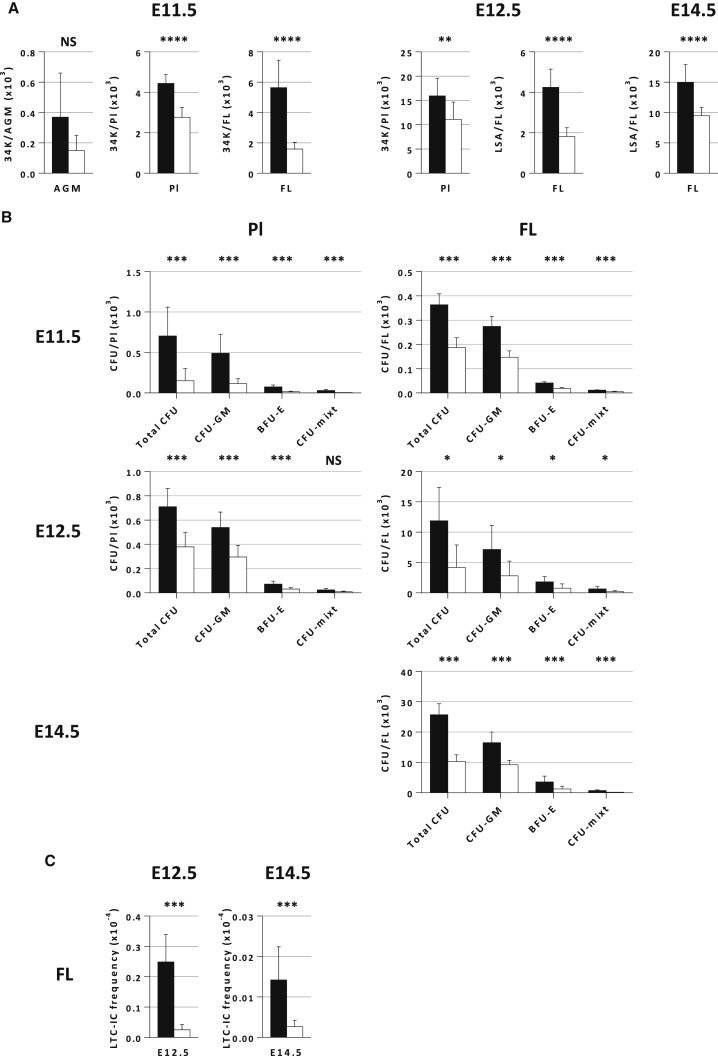
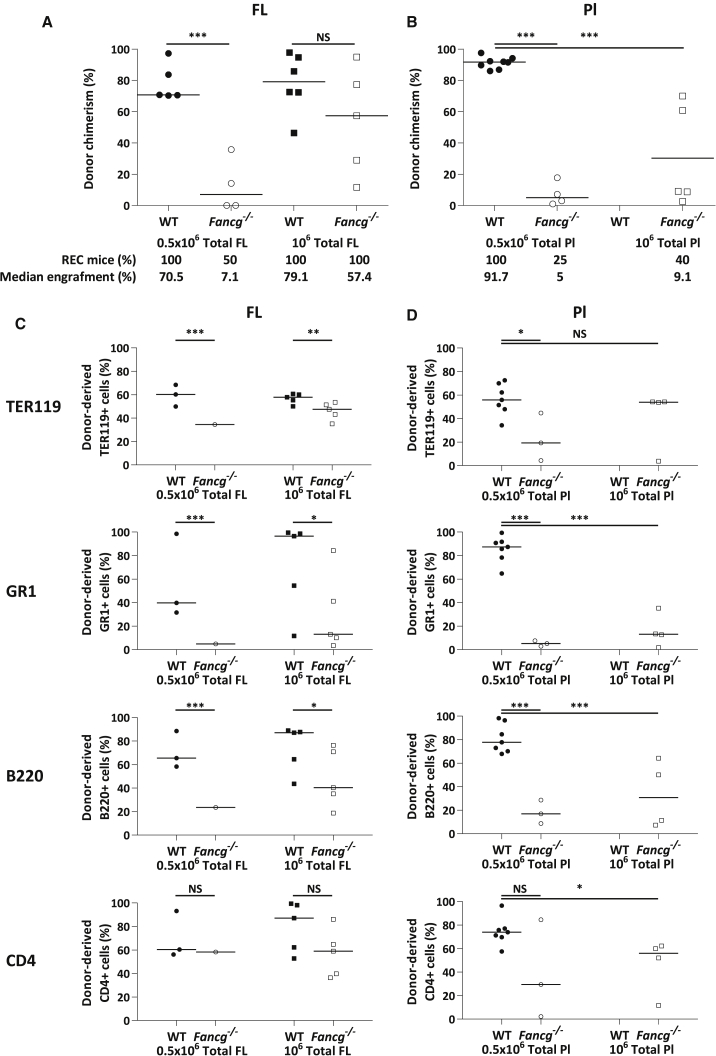
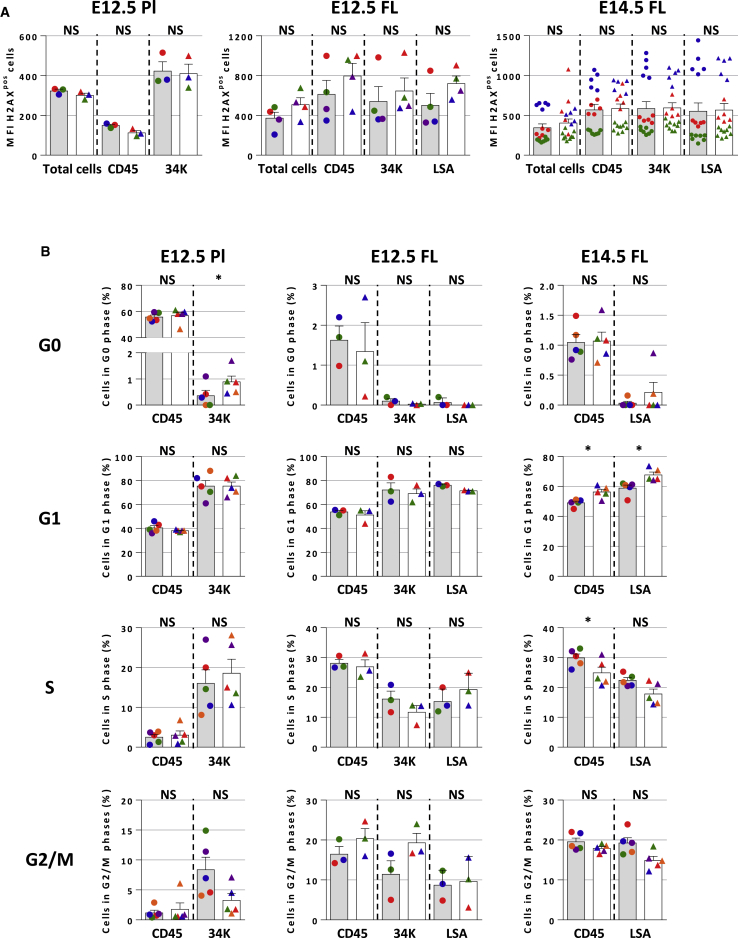
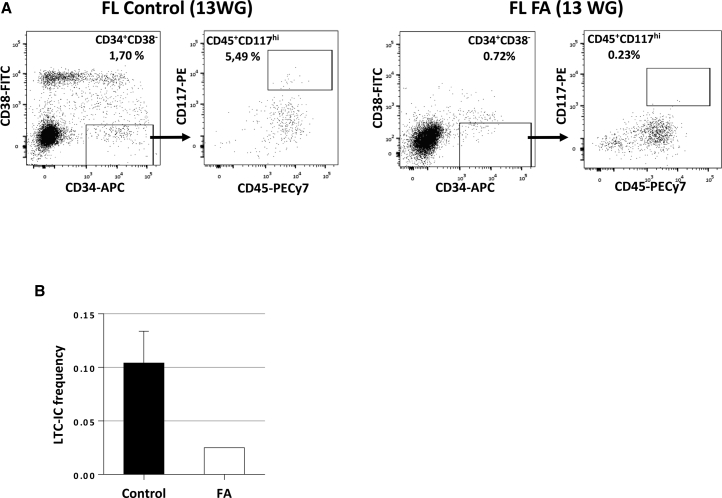
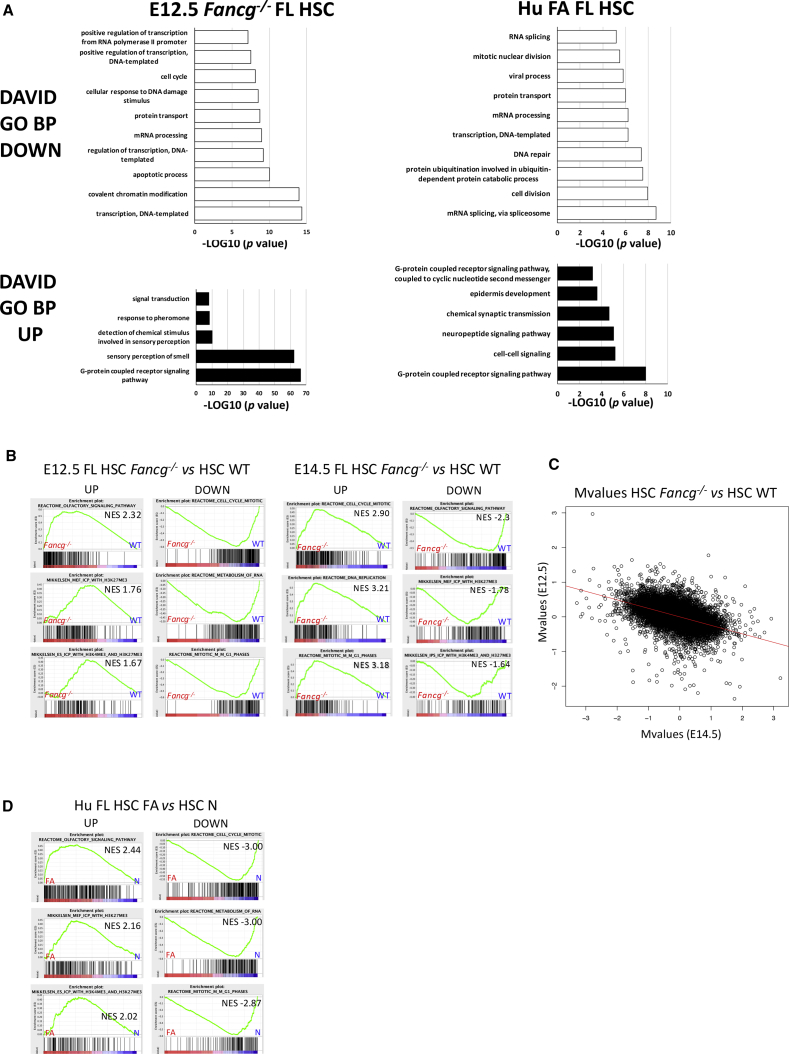
Fanconi anemia (FA) causes bone marrow failure early during childhood, and recent studies indicate that a hematopoietic defect could begin in utero. We performed a unique kinetics study of hematopoiesis in Fancg-/- mouse embryos, between the early embryonic day 11.5 (E11.5) to E12.5 developmental window (when the highest level of hematopoietic stem cells [HSC] amplification takes place) and E14.5. This study reveals a deep HSC defect with exhaustion of proliferative and self-renewal capacities very early during development, together with severe FA clinical and biological manifestations, which are mitigated at E14.5 due to compensatory mechanisms that help to ensure survival of Fancg-/- embryos. It also reports that a deep HSC defect is also observed during human FA development, and that human FA fetal liver (FL) HSCs present a transcriptome profile similar to that of mouse E12.5 Fancg-/- FL HSCs. Altogether, our results highlight that early mouse FL could represent a good alternative model for studying Fanconi pathology.
Keywords: Fanconi anemia; HSC; fetal liver; human embryonic development; mouse embryonic development; placenta; transcriptome.
Copyright © 2018 The Authors. Published by Elsevier Inc. All rights reserved.
Figures
Similar articles
-
Impaired functionality and homing of Fancg-deficient hematopoietic stem cells.Hum Mol Genet. 2012 Jan 1;21(1):121-35. doi: 10.1093/hmg/ddr447. Epub 2011 Oct 3. Hum Mol Genet. 2012. PMID: 21968513
-
p53-TP53-Induced Glycolysis Regulator Mediated Glycolytic Suppression Attenuates DNA Damage and Genomic Instability in Fanconi Anemia Hematopoietic Stem Cells.Stem Cells. 2019 Jul;37(7):937-947. doi: 10.1002/stem.3015. Epub 2019 May 3. Stem Cells. 2019. PMID: 30977208 Free PMC article.
-
Fetal origins of hematopoietic failure in a murine model of Fanconi anemia.Blood. 2013 Mar 14;121(11):2008-12. doi: 10.1182/blood-2012-06-439679. Epub 2013 Jan 11. Blood. 2013. PMID: 23315168 Free PMC article.
-
Gene Therapy in Fanconi Anemia: A Matter of Time, Safety and Gene Transfer Tool Efficiency.Curr Gene Ther. 2017;16(5):297-308. doi: 10.2174/1566523217666170109114309. Curr Gene Ther. 2017. PMID: 28067165 Review.
-
Advances in Gene Therapy for Fanconi Anemia.Hum Gene Ther. 2018 Oct;29(10):1114-1123. doi: 10.1089/hum.2018.124. Hum Gene Ther. 2018. PMID: 30117331 Review.
Cited by
-
Transcription-replication conflicts in primordial germ cells necessitate the Fanconi anemia pathway to safeguard genome stability.Proc Natl Acad Sci U S A. 2022 Aug 23;119(34):e2203208119. doi: 10.1073/pnas.2203208119. Epub 2022 Aug 15. Proc Natl Acad Sci U S A. 2022. PMID: 35969748 Free PMC article.
-
Protein tyrosine phosphatase 4A3 (PTP4A3/PRL-3) promotes the aggressiveness of human uveal melanoma through dephosphorylation of CRMP2.Sci Rep. 2019 Feb 28;9(1):2990. doi: 10.1038/s41598-019-39643-y. Sci Rep. 2019. PMID: 30816227 Free PMC article.
-
XPF-ERCC1 protects liver, kidney and blood homeostasis outside the canonical excision repair pathways.PLoS Genet. 2020 Apr 9;16(4):e1008555. doi: 10.1371/journal.pgen.1008555. eCollection 2020 Apr. PLoS Genet. 2020. PMID: 32271760 Free PMC article.
-
A C57BL/6J Fancg-KO Mouse Model Generated by CRISPR/Cas9 Partially Captures the Human Phenotype.Int J Mol Sci. 2023 Jul 5;24(13):11129. doi: 10.3390/ijms241311129. Int J Mol Sci. 2023. PMID: 37446306 Free PMC article.
-
CD117hi expression identifies a human fetal hematopoietic stem cell population with high proliferation and self-renewal potential.Haematologica. 2020 Jan 31;105(2):e43-e47. doi: 10.3324/haematol.2018.207811. Print 2020. Haematologica. 2020. PMID: 31248971 Free PMC article. No abstract available.
References
-
- Ayas M., Saber W., Davies S.M., Harris R.E., Hale G.A., Socie G., LeRademacher J., Thakar M., Deeg H.J., Al-Seraihy A. Allogeneic hematopoietic cell transplantation for Fanconi anemia in patients with pretransplantation cytogenetic abnormalities, myelodysplastic syndrome, or acute leukemia. J. Clin. Oncol. 2013;31:1669–1676. - PMC - PubMed
-
- Barroca V., Mouthon M.A., Lewandowski D., Brunet de la Grange P., Gauthier L.R., Pflumio F., Boussin F.D., Arwert F., Riou L., Allemand I. Impaired functionality and homing of Fancg-deficient hematopoietic stem cells. Hum. Mol. Genet. 2012;21:121–135. - PubMed
Publication types
MeSH terms
Substances
LinkOut - more resources
Full Text Sources
Medical
Molecular Biology Databases
