

Genetic Engineering of Human Embryonic Stem Cells for Precise Cell Fate Tracing during Human Lineage Development
- PMID: 30449321
- PMCID: PMC6234918
- DOI: 10.1016/j.stemcr.2018.09.014
Genetic Engineering of Human Embryonic Stem Cells for Precise Cell Fate Tracing during Human Lineage Development
Abstract
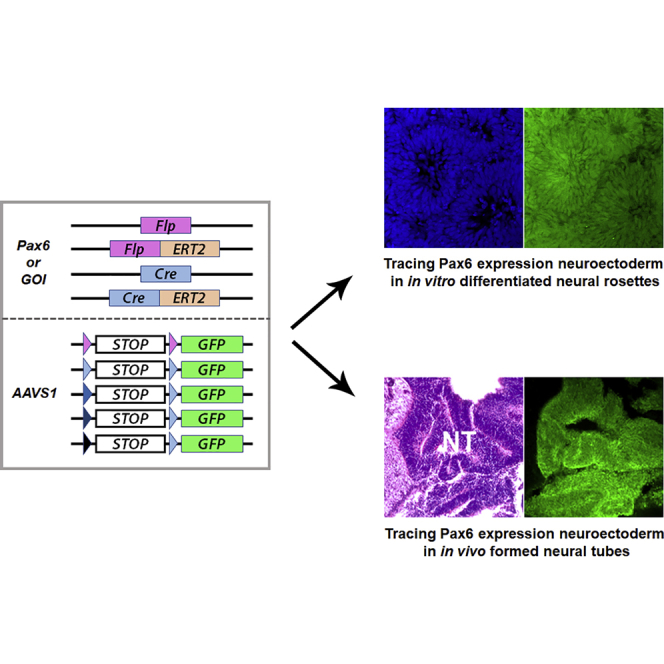
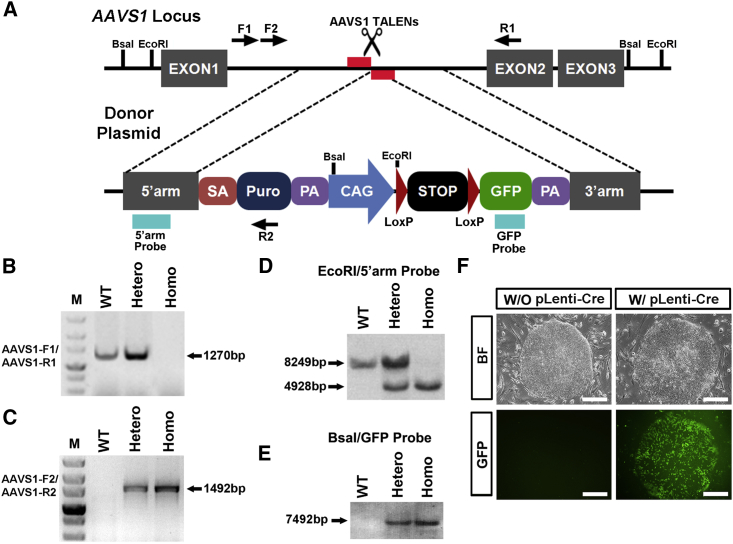
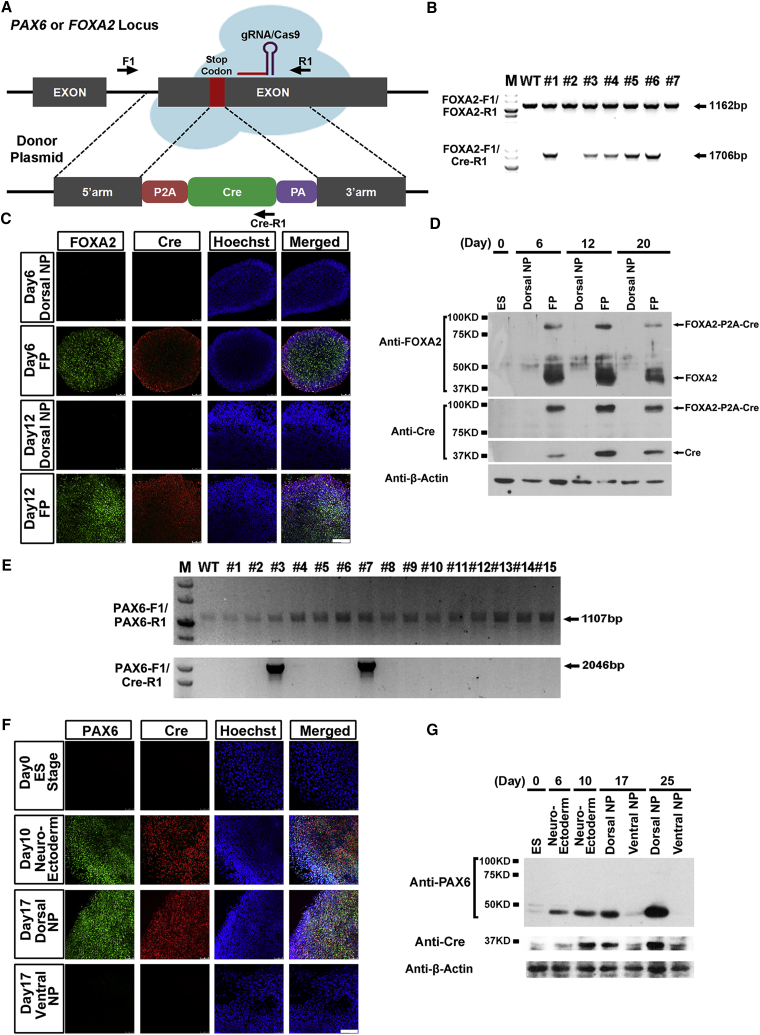
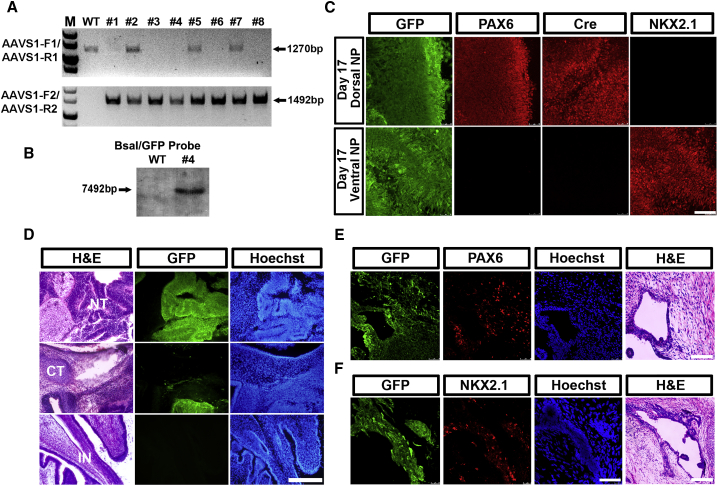
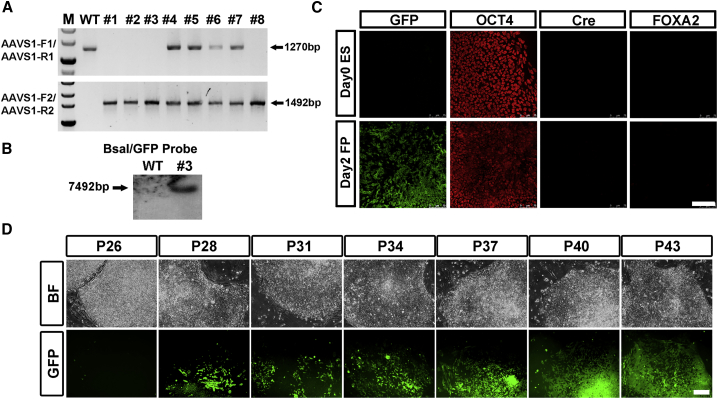
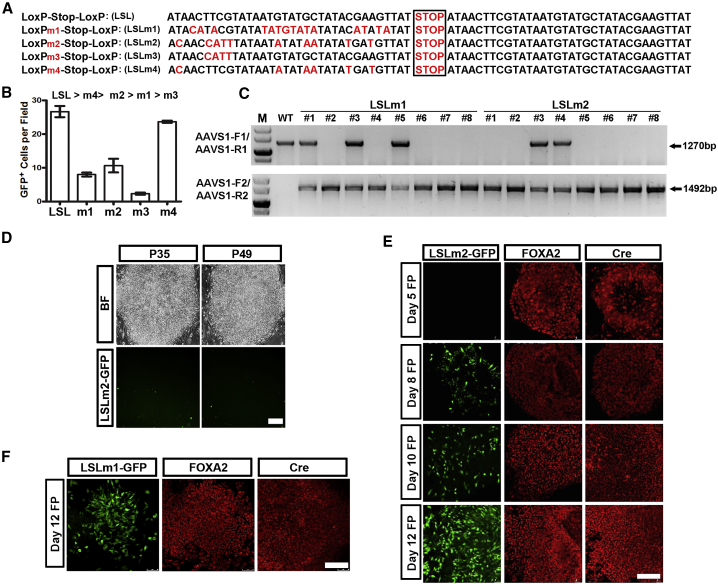
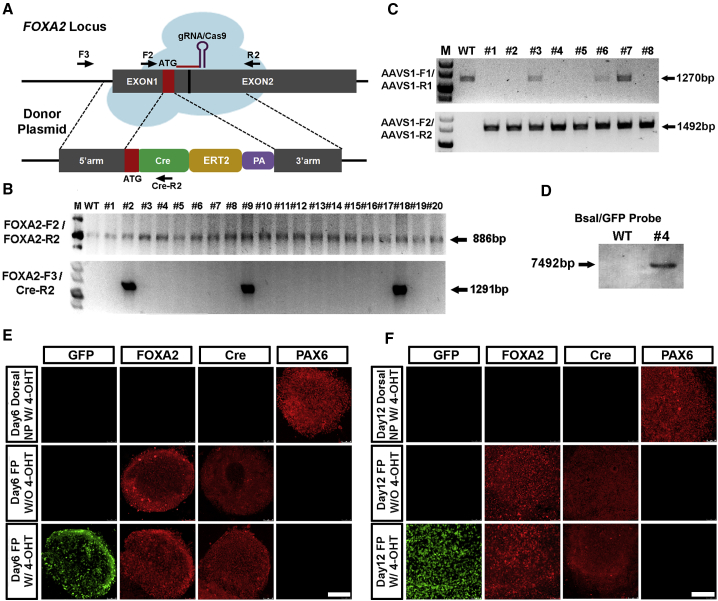
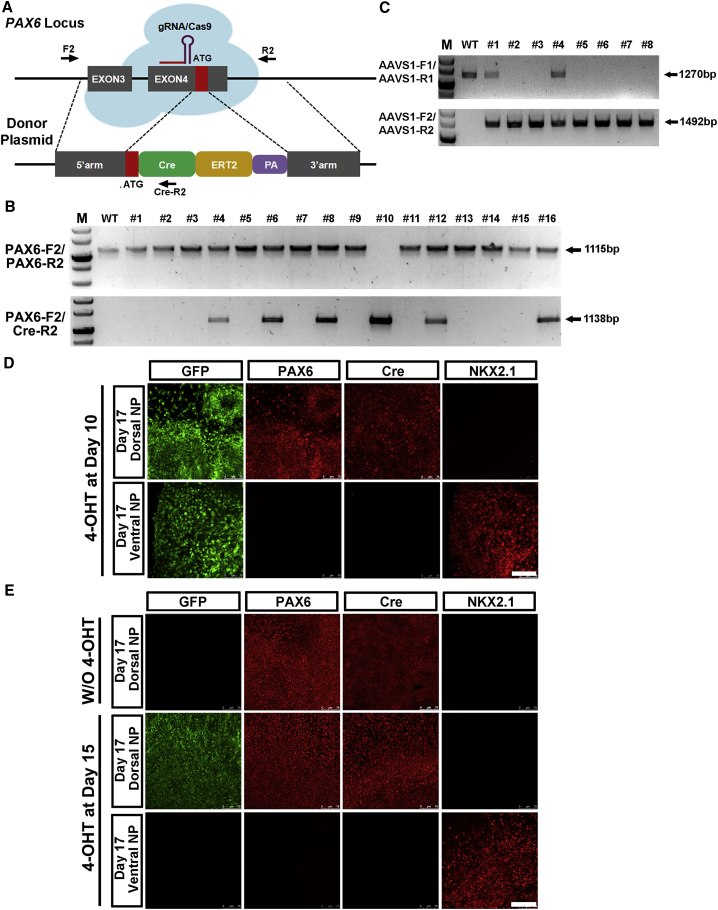
It is highly desirable to specify human developmental principles in an appropriate human model with advanced genetic tools. However, genetically engineering human cells with lineage-tracing systems has not been achieved. Here we introduce strategies to construct lineage-tracing systems in human embryonic stem cells (hESCs). The AAVS1 locus was suitable for the integration of the conditional reporter. The Cre-LoxP and Flp-FRT systems were highly sensitive, which may cause inaccurate lineage labeling in human cells. The recombination sensitivity and tracing fidelity could be finely tuned by modification of the LoxP recombination site. Moreover, tamoxifen-controllable CreERT2-LoxP and FlpERT2-FRT systems showed compelling advantages in tightly tracing human lineages temporally. In proof-of-principle experiments, we traced human PAX6+ neuroectoderm cells and revealed their full neural lineage differentiation potency both in vitro and in vivo. Devising and optimizing of lineage-tracing systems in hESCs will thus set up a solid foundation for human developmental studies.
Keywords: FOXA2; PAX6; development; genetic engineering; human embryonic stem cells; lineage-tracing.
Copyright © 2018 The Author(s). Published by Elsevier Inc. All rights reserved.
Figures
Similar articles
-
Loss of non-coding RNA expression from the DLK1-DIO3 imprinted locus correlates with reduced neural differentiation potential in human embryonic stem cell lines.Stem Cell Res Ther. 2015 Jan 5;6(1):1. doi: 10.1186/scrt535. Stem Cell Res Ther. 2015. PMID: 25559585 Free PMC article.
-
Generation of H1 PAX6WT/EGFP reporter cells to purify PAX6 positive neural stem/progenitor cells.Biochem Biophys Res Commun. 2018 Aug 25;502(4):442-449. doi: 10.1016/j.bbrc.2018.05.163. Epub 2018 Jun 1. Biochem Biophys Res Commun. 2018. PMID: 29807013
-
Enhancing the precision of genetic lineage tracing using dual recombinases.Nat Med. 2017 Dec;23(12):1488-1498. doi: 10.1038/nm.4437. Epub 2017 Nov 13. Nat Med. 2017. PMID: 29131159 Free PMC article.
-
Tools and Techniques for Wt1-Based Lineage Tracing.Methods Mol Biol. 2016;1467:41-59. doi: 10.1007/978-1-4939-4023-3_4. Methods Mol Biol. 2016. PMID: 27417958 Review.
-
Genetic lineage tracing with multiple DNA recombinases: A user's guide for conducting more precise cell fate mapping studies.J Biol Chem. 2020 May 8;295(19):6413-6424. doi: 10.1074/jbc.REV120.011631. Epub 2020 Mar 25. J Biol Chem. 2020. PMID: 32213599 Free PMC article. Review.
Cited by
-
Valproic acid-induced teratogenicity is driven by senescence and prevented by Rapamycin in human spinal cord and animal models.Mol Psychiatry. 2025 Mar;30(3):986-998. doi: 10.1038/s41380-024-02732-0. Epub 2024 Sep 3. Mol Psychiatry. 2025. PMID: 39227432 Free PMC article.
-
Uncovering the role of FOXA2 in the Development of Human Serotonin Neurons.Adv Sci (Weinh). 2023 Nov;10(32):e2303884. doi: 10.1002/advs.202303884. Epub 2023 Sep 7. Adv Sci (Weinh). 2023. PMID: 37679064 Free PMC article.
-
Graded and pan-neural disease phenotypes of Rett Syndrome linked with dosage of functional MeCP2.Protein Cell. 2021 Aug;12(8):639-652. doi: 10.1007/s13238-020-00773-z. Epub 2020 Aug 27. Protein Cell. 2021. PMID: 32851591 Free PMC article.
-
Mapping germ-layer specification preventing genes in hPSCs via genome-scale CRISPR screening.iScience. 2020 Dec 10;24(1):101926. doi: 10.1016/j.isci.2020.101926. eCollection 2021 Jan 22. iScience. 2020. PMID: 33385119 Free PMC article.
-
Protocol for genome-scale CRISPR screening in engineered lineage reporter hPSCs to study cell fate determination.STAR Protoc. 2021 May 20;2(2):100548. doi: 10.1016/j.xpro.2021.100548. eCollection 2021 Jun 18. STAR Protoc. 2021. PMID: 34095862 Free PMC article.
References
-
- Awatramani R., Soriano P., Rodriguez C., Mai J.J., Dymecki S.M. Cryptic boundaries in roof plate and choroid plexus identified by intersectional gene activation. Nat. Genet. 2003;35:70–75. - PubMed
-
- Blanpain C., Simons B.D. Unravelling stem cell dynamics by lineage tracing. Nat. Rev. Mol. Cell Biol. 2013;14:489–502. - PubMed
-
- Boch J., Scholze H., Schornack S., Landgraf A., Hahn S., Kay S., Lahaye T., Nickstadt A., Bonas U. Breaking the code of DNA binding specificity of TAL-type III effectors. Science. 2009;326:1509. - PubMed
-
- Bulic-Jakus F., Katusic Bojanac A., Juric-Lekic G., Vlahovic M., Sincic N. Teratoma: from spontaneous tumors to the pluripotency/malignancy assay. Wiley Interdiscip. Rev. Dev. Biol. 2016;5:186–209. - PubMed
Publication types
MeSH terms
Substances
LinkOut - more resources
Full Text Sources
Research Materials
