. 2018 Dec 13;175(7):1958-1971.e15.
doi: 10.1016/j.cell.2018.10.024. Epub 2018 Nov 15.

Genome-wide CRISPR Screens in Primary Human T Cells Reveal Key Regulators of Immune Function

Affiliations

Genome-wide CRISPR Screens in Primary Human T Cells Reveal Key Regulators of Immune Function

Eric Shifrut et al. Cell. .

Abstract

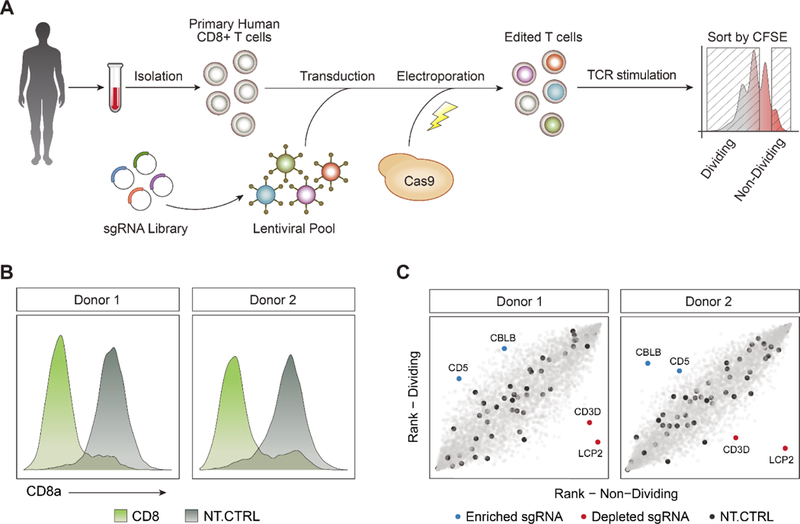
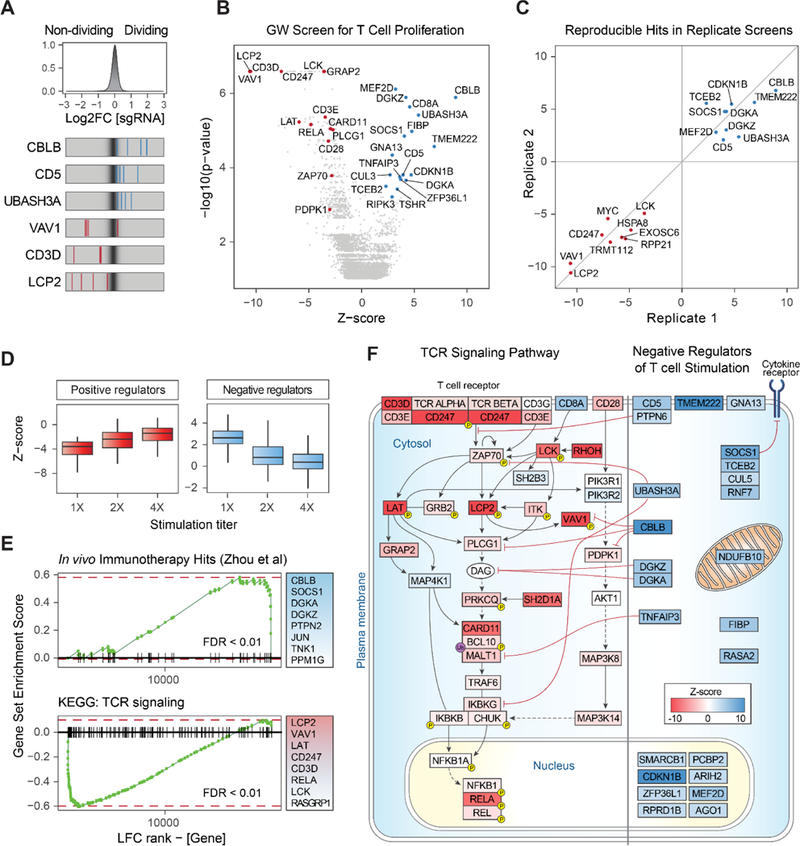
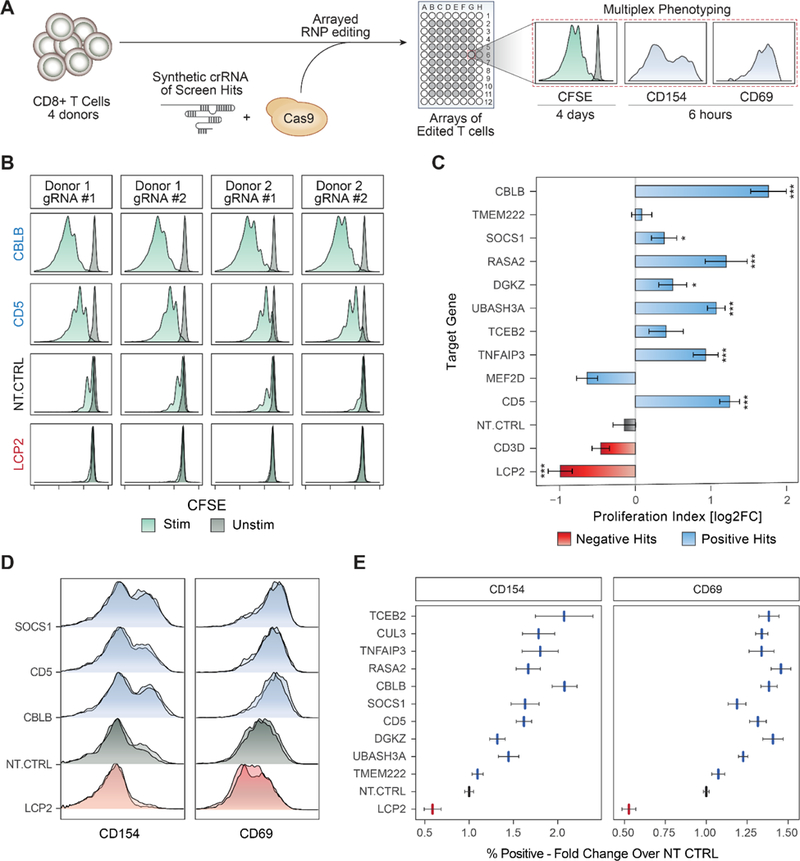
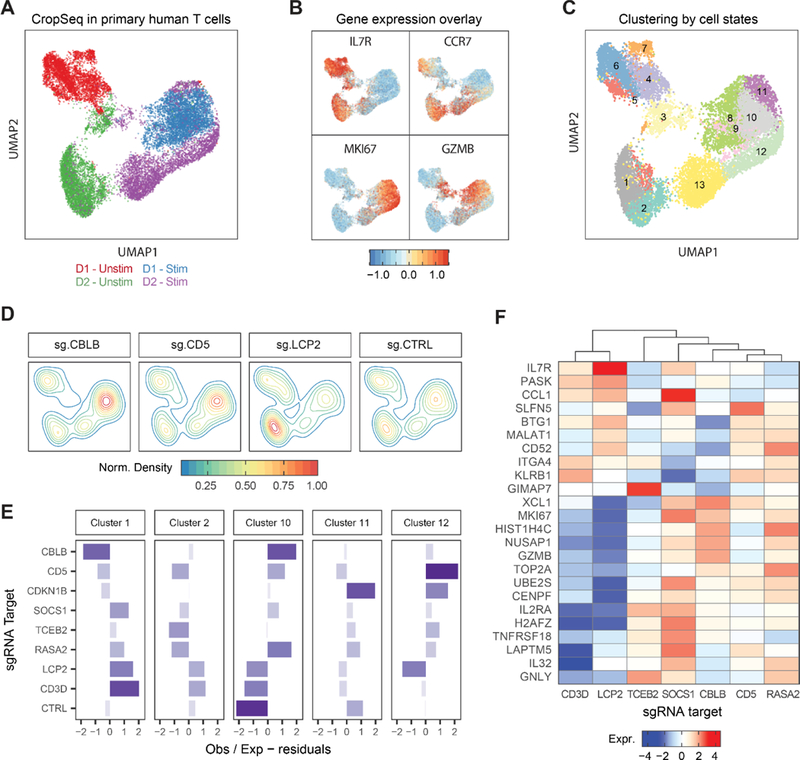
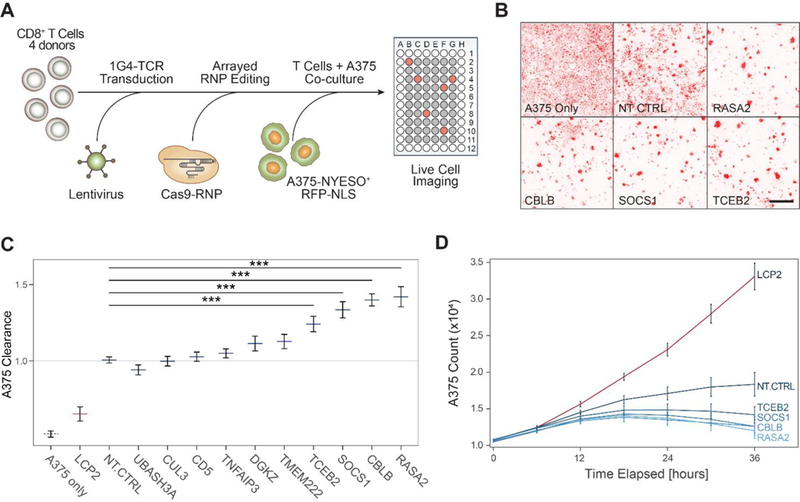
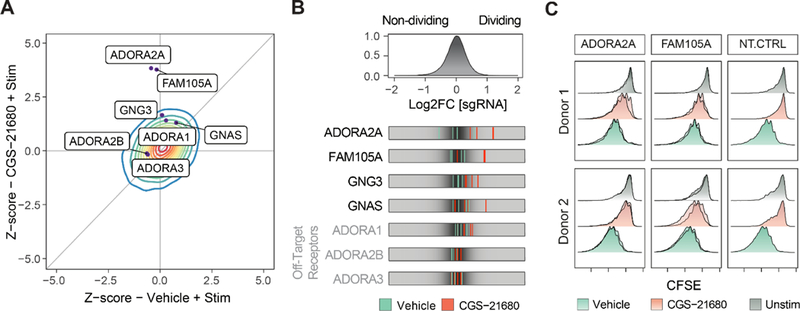
Human T cells are central effectors of immunity and cancer immunotherapy. CRISPR-based functional studies in T cells could prioritize novel targets for drug development and improve the design of genetically reprogrammed cell-based therapies. However, large-scale CRISPR screens have been challenging in primary human cells. We developed a new method, single guide RNA (sgRNA) lentiviral infection with Cas9 protein electroporation (SLICE), to identify regulators of stimulation responses in primary human T cells. Genome-wide loss-of-function screens identified essential T cell receptor signaling components and genes that negatively tune proliferation following stimulation. Targeted ablation of individual candidate genes characterized hits and identified perturbations that enhanced cancer cell killing. SLICE coupled with single-cell RNA sequencing (RNA-seq) revealed signature stimulation-response gene programs altered by key genetic perturbations. SLICE genome-wide screening was also adaptable to identify mediators of immunosuppression, revealing genes controlling responses to adenosine signaling. The SLICE platform enables unbiased discovery and characterization of functional gene targets in primary cells.

Keywords: CRISPR; T cell activation; T cell proliferation; genome-wide pooled screens; immunotherapy; primary human T cells; single-cell RNA-seq.


Figures

Figure 1.
Figure 1.. Framework for Unbiased Discovery of Regulators of Human T Cell Proliferation Using Pooled CRISPR Screens.
(A) Diagram of a hybrid system of sgRNA lentiviral infection and Cas9 electroporation (SLICE), enabling pooled CRISPR screens in primary human T cells. (B) Editing of the CD8A gene with SLICE led to efficient protein knockdown in two independent donors. (C) Targeted screen (4,918 guides) shows that sgRNAs targeting CBLB and CD5 were enriched in proliferating T cells (blue), while sgRNAs targeting LCP2 and CD3D were depleted (red). Non-targeting sgRNAs were evenly distributed across the cell populations (black). See Also Figure S1 and Table S2.
Figure 2.
Figure 2.. Genome-wide Screen in Primary Human T Cells Identifies Key Mediators of TCR Signaling Dependent T Cell Proliferation
(A) Top panel: distribution of log2 fold-change (LFC) values of dividing over non-dividing cells for >75,000 guides in the genome-wide (GW) library. Bottom panel: LFC for all four sgRNAs targeting three genes enriched in dividing cells (blue lines) and three depleted genes (red lines), overlaid on grey gradient depicting the overall distribution. Values are averaged over two donors. (B) Volcano plot for hits from the primary GW screen. X-axis shows Z-score (ZS) for gene-level LFC (median of LFC for all sgRNAs per gene, scaled). Y-axis shows the p-value as calculated by MAGeCK. Highlighted in red are negative hits (depleted in dividing cells, FDR < 0.2 and |ZS| > 2), which are annotated for the TCR signaling pathway by Gene Ontology (GO). Blue dots show all positive hits (Rank < 20 and |ZS| > 2). All values are calculated for two donors as biological replicates. (C) Gene hits from the secondary GW screen in cells from two independent blood donors are positively correlated with the hits from the primary screen. Shown are Z-scores for overlapping hits for the top 25 ranking targets from the independent screens, in both positive and negative directions. (D) Boxplots for Z-scores (scaled LFC) of the top 100 hits in each direction, for three GW screens with increasing TCR stimulation levels (1X = data in (B)). For both panels, LFC values trended towards 0, indicating selection pressure was reduced as the TCR signal increased. Horizontal line is the median, vertical line is the data range. (E) Gene-set enrichment analysis shows significantly skewed LFC ranking of screen hits in two curated gene lists: (top panel) previously discovered hits by an shRNA screen in a mouse model of melanoma (Zhou et al., 2014) and (bottom panel) TCR signaling pathway by KEGG. The top eight gene members on the leading edge of each set enrichment are shown in the text-box on the right. Vertical lines on the x-axis are members of the gene set, ordered by their LFC rank in the GW screen. FDR = False discovery rate, permutation test. (F) Modulators of TCR signaling and T cell activation detected in the GW screens. Depicted on the left are positive regulators of the TCR pathway found in our GW screens (FDR < 0.25). The curated TCR pathway is based on NetPath_11 (Kandasamy et al., 2010) and literature review. Depicted on the right are negative regulator genes (both known and unknown) found in our GW screens (FDR < 0.25), and represent candidate targets to boost T cell proliferation. Cellular localization and interaction edges are based on literature review. Gene nodes are shaded by their Z-score in the GW screen (red for positive and blue for negative Z-score values). See Also Figure S2 and Tables S3–4
Figure 3.
Figure 3.. Validation of Gene Targets That Regulate T Cell Stimulation Using RNP Arrays.
(A) Overview of arrayed Cas9 RNP electroporation phenotyping strategy. (B) Proliferation assay with CFSE-stained CD8+ T cells. Each panel shows CFSE signal from TCR-stimulated (green) or unstimulated (dark grey) human CD8+ T cells. Shown are data for two guides targeting negative regulators, CBLB and CD5, compared to non-targeting control (NT-CTRL) guides and guides targeting a critical TCR signaling gene, LCP2. (C) Summary of data in (B) across sgRNAs. Gene targets (y-axis) are ordered by their rank in the GW pooled screens. X-axis is the calculated proliferation index (STAR methods), relative to NT-CTRL in each donor (log2 transformed). Bars show mean of two independent experiments, with two donors in each experiment. Error bars are SEM. *** denotes p < 0.001, * denotes p < 0.05, Standard t-test. (D) Early activation markers, as measured by flow cytometry 6 hours post stimulation. Shown are representative distributions of two guides per targeted gene (y-axis) for CD154 (left) and CD69 (right). (E) Summary of data in (D) for all gene targets tested (y-axis). X-axis is the fold-change increase in the marker-positive (CD69 or CD154) population over NT-CTRL. Vertical lines are mean values, error bars are SEM, two guides per gene, for four donors. See also Figure S3.
Figure 4.
Figure 4.. Pairing SLICE with Single Cell RNA-Seq for High Dimensional Molecular Phenotyping of Gene Knockouts in Primary Cells.
(A) UMAP plot of all single cells with identified sgRNAs across resting and re-stimulated T cells from two human donors. (B) UMAP with scaled gene expression for four genes showing cluster associations with activation state (IL7R, CCR7), cell cycle (MKI67), and effector function (GZMB). (C) Unsupervised clustering of single cells based on gene expression, 13 clusters identified as labeled. (D) Clustering of cells expressing sgRNAs for CBLB, CD5, LCP and NT-CTRL on the UMAP representation. (E) Y-axis shows over- or under-representation of cells expressing sgRNAs (y-axis) across clusters (panels), as determined by a chi-square test. (F) Heatmap showing average gene expression (y-axis) across stimulated cells with different sgRNA targets (x-axis). Data represents one of two donors. See also Figure S4.
Figure 5.
Figure 5.. Genome-wide Screen Hits Boost in vitro Cancer Cell Killing by Engineered Antigen-specific Human T Cells.
(A) Diagram of a high throughput experimental strategy to test for gene targets that boost cancer cell killing in vitro by CD8+ T cells. (B) Representative images taken at 36 hours post co-culture of human CD8+ T cells and A375-RFP+ tumor cells. Cancer cell density is shown in the red fluorescence channel, for representative wells, as annotated at the bottom left of each panel. Scale bar is 500μm. (C) Clearance of RFP-labeled A375 cells by antigen-specific CD8 T cells after 36 hours. Clearance is defined as count of A375 cells in each well normalized to counts of A375 cells in wells with NT-CTRL T cells. Horizontal lines are the mean, error bars are the SEM, for two guides per gene target, across four donors and two technical replicates. *** denotes p < 0.001, Wilcoxon Rank Sum test. (D) Time traces for A375 cell counts as measured by IncuCyte software for selected hits. Lines are mean for four donors, two guides per target gene. Error bars are SEM. See also Figure S5.
Figure 6.
Figure 6.. Adapting SLICE to Reveal Resistance to Immunosuppressive Signals in Primary Human T Cells.
(A) Z scores for the genome-wide screen for resistance to adenosine A2A selective agonist CGS-21680 (y-axis) compared to vehicle (x-axis). Contour represents the density (red for higher, blue for lower density) of all genes across the screen. Genes with selective effects on adenosine-mediated immunosuppression deviated upwards from the diagonal identity line. Dots show selected individual gene targets. (B) Top panel: distribution of log2 fold change for all sgRNAs in the GW library for T cells treated with CGS-21680 (20μM). Bottom panel: LFC for selected sgRNAs in the vehicle (stimulation only) condition (green) compared to the CGS-21680 treated condition (red). (C) Validation of gene targets from the adenosine resistance screen using T cells edited with individual RNPs. Knockout of both ADORA2A and FAM105A enables cells to proliferate more robustly in the presence of the adenosine agonist (CGS-21680), compared to the NT-CTRL RNP. Each panel shows results from two independent sgRNAs for two donors. See also Figure S6 and Table S6.

Similar articles

Cited by

References

    1. Aarts M, Georgilis A, Beniazza M, Beolchi P, Banito A, Carroll T, Kulisic M, Kaemena DF, Dharmalingam G, Martin N, et al. (2017). Coupling shRNA screens with single-cell RNA-seq identifies a dual role for mTOR in reprogramming-induced senescence. Genes Dev. 31,2085–2098. - PMC - PubMed
    1. Adamson B, Norman TM, Jost M, Cho MY, Nuñez JK, Chen Y, Villalta JE, Gilbert LA, Horlbeck MA, Hein MY, et al. (2016). A Multiplexed Single-Cell CRISPR Screening Platform Enables Systematic Dissection of the Unfolded Protein Response. Cell 167, 1867–1882.e21. - PMC - PubMed
    1. Allard D, Turcotte M, and Stagg J (2017). Targeting A2 adenosine receptors in cancer. Immunol. Cell Biol. 95, 333–339. - PubMed
    1. Arafeh R, Qutob N, Emmanuel R, Keren-Paz A, Madore J, Elkahloun A, Wilmott JS, Gartner JJ, Di Pizio A, Winograd-Katz S, et al. (2015). Recurrent inactivating RASA2 mutations in melanoma. Nat. Genet. 47, 1408–1410. - PMC - PubMed
    1. Bartelt RR, and Houtman JCD (2013). The adaptor protein LAT serves as an integration node for signaling pathways that drive T cell activation. Wiley Interdiscip. Rev. Syst. Biol. Med. 5, 101–110. - PMC - PubMed

Publication types

MeSH terms

Substances