. 2018 Dec 13;175(7):1872-1886.e24.
doi: 10.1016/j.cell.2018.10.030. Epub 2018 Nov 15.

Acetylation of Cytidine in mRNA Promotes Translation Efficiency

Affiliations

Acetylation of Cytidine in mRNA Promotes Translation Efficiency

Daniel Arango et al. Cell. .

Abstract

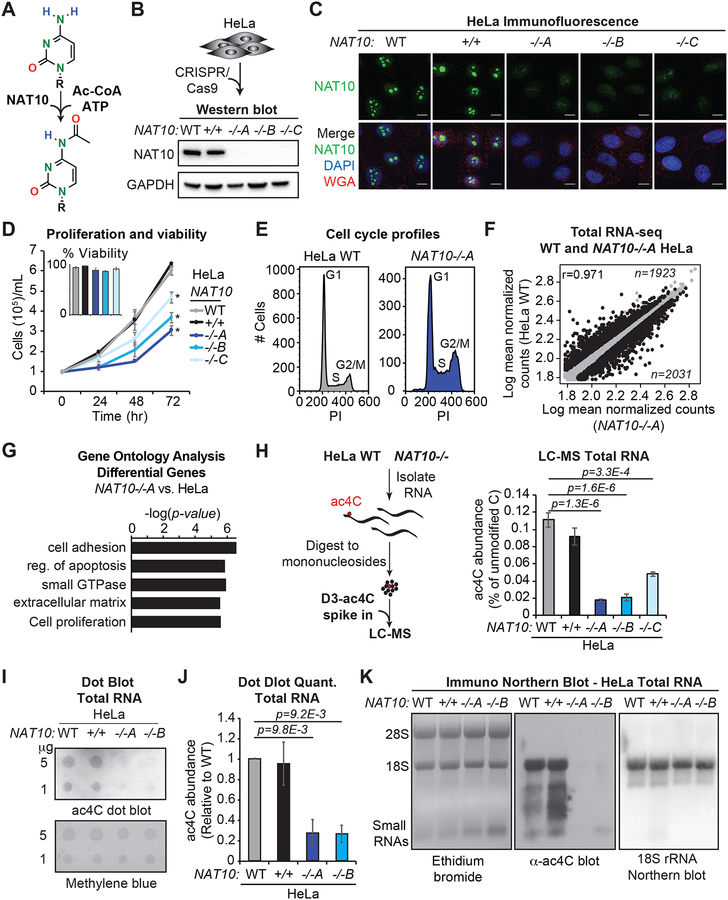
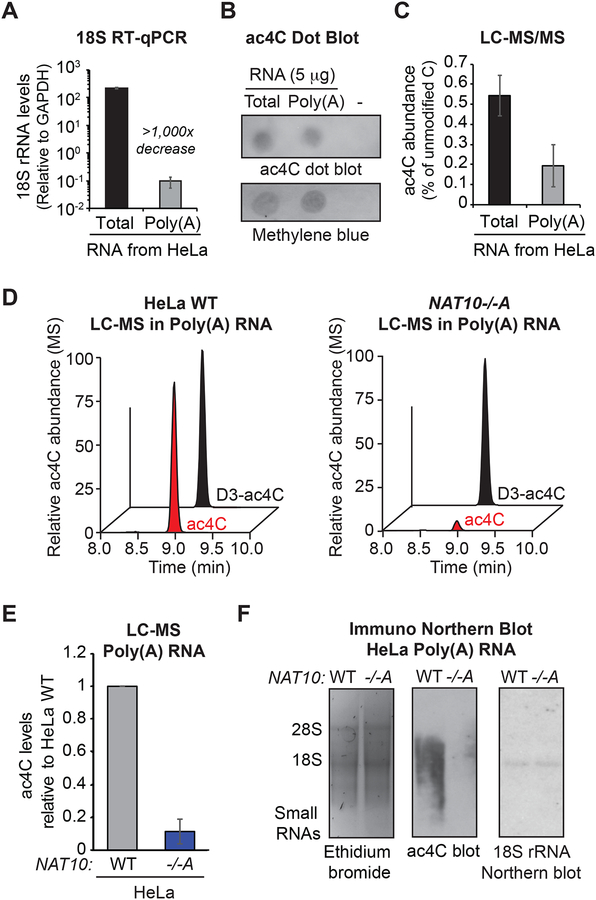
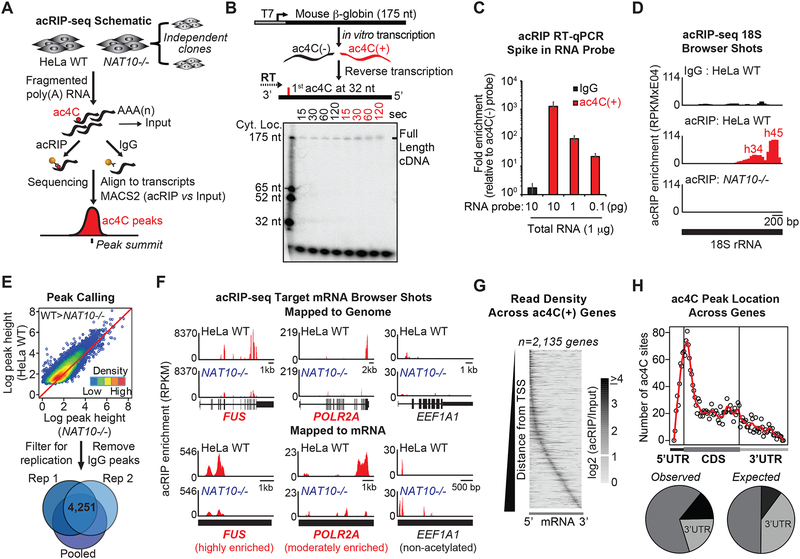
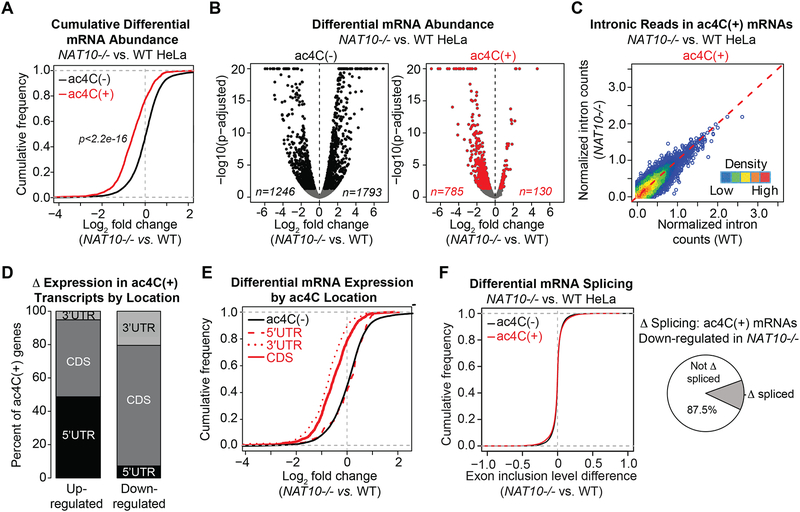
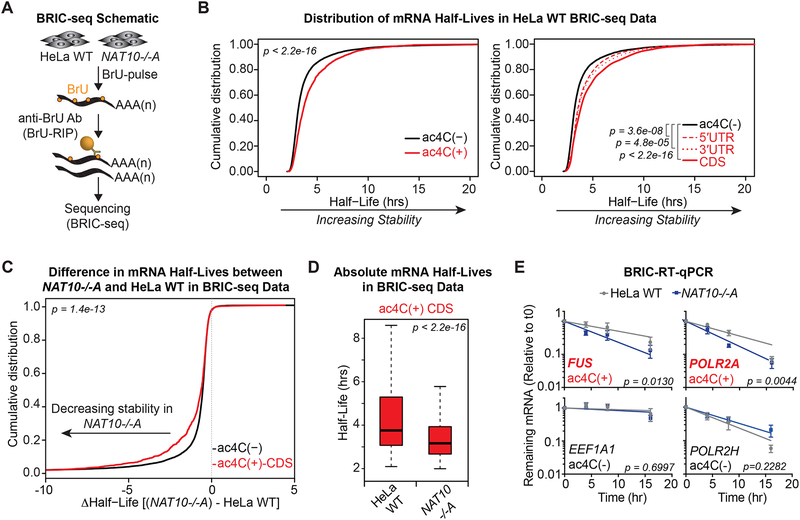
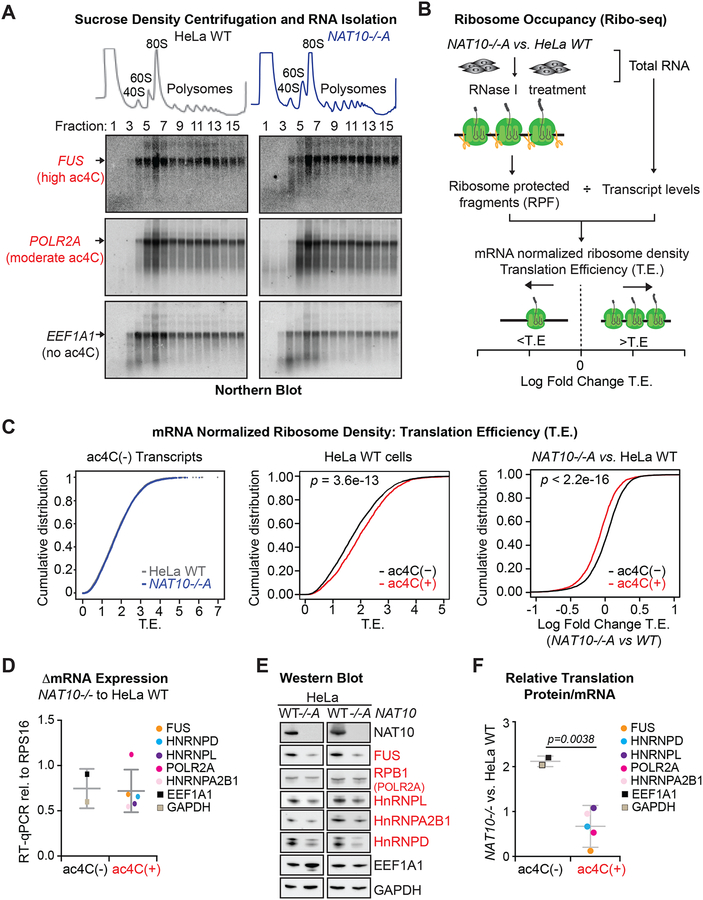
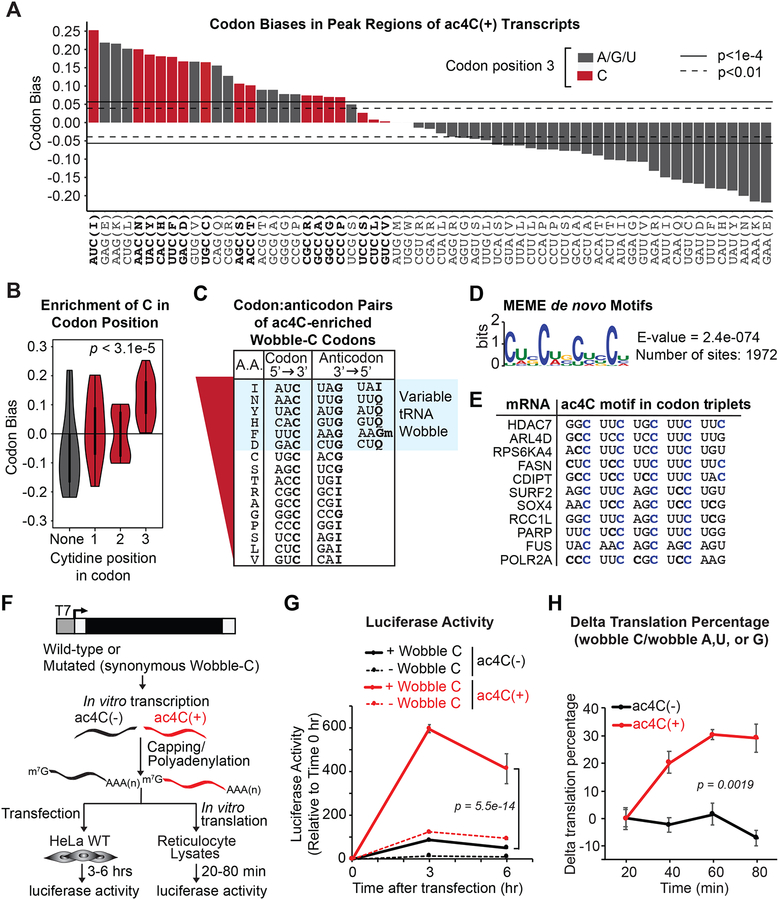
Generation of the "epitranscriptome" through post-transcriptional ribonucleoside modification embeds a layer of regulatory complexity into RNA structure and function. Here, we describe N4-acetylcytidine (ac4C) as an mRNA modification that is catalyzed by the acetyltransferase NAT10. Transcriptome-wide mapping of ac4C revealed discretely acetylated regions that were enriched within coding sequences. Ablation of NAT10 reduced ac4C detection at the mapped mRNA sites and was globally associated with target mRNA downregulation. Analysis of mRNA half-lives revealed a NAT10-dependent increase in stability in the cohort of acetylated mRNAs. mRNA acetylation was further demonstrated to enhance substrate translation in vitro and in vivo. Codon content analysis within ac4C peaks uncovered a biased representation of cytidine within wobble sites that was empirically determined to influence mRNA decoding efficiency. These findings expand the repertoire of mRNA modifications to include an acetylated residue and establish a role for ac4C in the regulation of mRNA translation.

Keywords: N4-acetylcytidine; NAT10; epitranscriptome; mRNA stability; mRNA translation.


Conflict of interest statement

Declaration of Interests: The authors declare no competing interests.

Figures

Figure 1.
Figure 1.. NAT10-catalyzed ac4C in human HeLa cells.
(A) NAT10 catalyzes cytidine acetylation. (B-C) NAT10−/− cells were generated through CRISPR/Cas9. Western blot and immunofluorescence (IF) for NAT10 in parental (WT) and targeted NAT10−/− cells. DAPI and wheat germ agglutinin (WGA) were used to mark the nucleus and cytoplasm, respectively, in IF. (D) Cell proliferation was evaluated through trypan blue counting at the indicated times. Insert represents percent viability at 72 hrs. Mean ± SEM, n=4, Two-Way ANOVA. (E) Representative of propidium iodide (PI) staining and flow cytometry for cell cycle analysis in NAT10−/−A and parental HeLa cells. (F) Scatter plots for differentially expressed genes (black) in NAT10−/−A vs. parental HeLa cell RNA-seq (adjusted p-value < 0.05). (G) GO enrichment on the subset of dysregulated genes from (F). (H) Total RNA was digested to mononucleosides, spiked with D3-ac4C or 15N3-C and analyzed by LC-MS. Mean ± SEM, n=3, One-Way ANOVA with Tukey’s post hoc test. (I) Representative anti-ac4C dot blot performed on total RNA with methylene blue staining as loading control. (J) Densitometry quantitation of (I). Mean ± SEM, n=3, One-Way ANOVA with Tukey’s post hoc test. (K) Anti-ac4C immuno-Northern blot in HeLa total RNA with ethidium bromide staining (left) and hybridization to 18S rRNA-specific probe (right) for general RNA visualization. Representative of biological triplicates.
Figure 2.
Figure 2.. ac4C detection in polyadenylated RNA.
(A) Determination of poly(A) RNA purity through RT-qPCR with primers specific to 18S rRNA and GAPDH. Mean ± SEM, n=3. (B) Representative anti-ac4C dot blot performed on total and poly(A) RNA from (B). (C) LC-MS/MS of total and poly(A) RNA from (B). Mean ± SEM relative to parental HeLa cells, n=3. (D) Chromatograms of representative LC-MS performed in poly(A) RNA from NAT10−/−A and parental HeLa cells. (E) Relative quantification of ac4C detection in poly(A) RNA LC-MS. Mean ± SEM relative to parental HeLa cells, n=3. (F) Anti-ac4C immuno-Northern as in poly(A) RNA. Representative of biological triplicates.
Figure 3.
Figure 3.. Transcriptome-wide mapping of ac4C in mRNA.
(A) Schematic of acRIP-seq. (B) ac4C(+) or C-RNA templates were reversed transcribed using 32P-labeled primers. Ladder represents positions of specific cytidines within the probe. (C) ac4C(+) or C-RNA probes were spiked into total RNA followed by acRIP-RT-qPCR. ac4CRNA levels are represented relative to C-RNA. Mean ± SEM, n=3. (D) Input-subtracted RPKM browser views of 18S rRNA acRIP-seq reads. (E) Acetylated regions were defined through acRIP summits displaying higher pileup values in parental (WT) relative to NAT10−/− HeLa, followed by filtering for IgG overlap and experimental replication. (F) Input-subtracted RPKM browser views of ac4C peaks in highly (FUS) and moderately enriched (POLR2A) ac4C targets, as well as a non-acetylated control (EEF1A1), mapped to the human reference genome or to mRNA sequence, as indicated. (G) Grayscale heatmap of acRIP-seq positional enrichment within transcripts. Each row represents a gene and columns represent percentiles of gene length. Genes are ordered by increasing distance of the maximum enrichment from the transcription start of the canonical transcript. (H) Number of ac4C summits parsed by location within CDS or UTRs for all acetylated transcripts (top). Pie charts indicating percentage of summits within CDS or UTRs in the acetylated transcripts (observed) compared to the expected percentage based on the length of each feature (expected) (bottom).
Figure 4.
Figure 4.. Loss of ac4C is globally associated with target mRNA down-regulation.
(A) Cumulative distribution function (CDF) plot depicting differential expression of ac4C(−) or ac4C(+) transcripts in NAT10−/−A vs. parental HeLa cells (ac4C(−), n=13,202; ac4C(+), n=2,114). p = Kolmogorov-Smirnov (KS) test. (B) Volcano plots of differentially expressed protein coding genes in NAT10−/−A vs. parental HeLa cells, segregated by acetylation status. Differentially expressed ac4C(−) and ac4C(+) genes are shown in black and red, respectively (adjusted p < 0.05). (C) Normalized intronic reads from ac4C(+) transcripts in NAT10−/−A vs. parental HeLa cells. (D) Percentage of ac4C summits occurring within CDS or UTRs in transcripts with differential expression in NAT10−/−A relative to parental HeLa cells from (B). (E) CDF plot showing expression changes of protein-coding genes in NAT10−/−A vs. parental HeLa cells for ac4C(−) and ac4C transcripts with peaks occurring within the CDS (n=1,131), 5’UTR (n=257) or 3’UTR (n=231). KS test: ac4C(−) vs. 5’UTR, p = 0.15; ac4C(−) vs. 3’UTR, p < 2.2e-16; ac4C(−) vs. CDS, p < 2.2e-16. (F) CDF plots of exon inclusion differences in NAT10−/−A vs. parental HeLa cells, based on ac4C status (ac4C(−), n=39,876; ac4C(+), n=9,787) (left). Pie chart represents the proportion of down-regulated ac4C(+) transcripts that also showed differential splicing in NAT10−/− A relative to parental HeLa cells (right).
Figure 5.
Figure 5.. ac4C promotes mRNA stability.
(A) Schematic of 5’-bromo-uridine [BrU] immunoprecipitation chase-deep sequencing (BRIC-seq). (B) Cumulative distribution plots of mRNA half-lives in parental HeLa cells for ac4C(−) (n=9,821) and all ac4C(+) (n=1,966) transcripts (left), or subdivided by ac4C summits occurring exclusively within 5’UTR (n= 248), 3’UTR (n=219), or CDS (n= 1,048) (right). p = KS test. (C) CDF plot of differential mRNA half-lives in NAT10−/−A vs. parental HeLa cells for ac4C(−) and ac4C(+) transcripts with summit position within CDS. p = KS test. (D) Boxplots of median half-lives of ac4C(+) transcripts with CDS summits in parental and NAT10−/−A HeLa cells. Boxes indicate median, 25th, and 75th percentiles, and whiskers extend to 1.5 times the interquartile range (excluding outliers). p = Wilcoxon rank-sum test. (E) BrU-labeled RNA was immunoprecipitated as described in (A) followed by RT-qPCR. Decay graphs were generated by applying the One-Phase Decay model. Mean ± SEM, n=4, Sum-of-squares F test.
Figure 6.
Figure 6.. ac4C enhances translation efficiency.
(A) Absorbance at 254 nm in sucrose density gradient fractions from parental and NAT10−/−A HeLa cells (top). Total RNA isolated from each fraction was hybridized to probes specific for two ac4C(+) transcripts, FUS and POLR2A, and an ac4C(−) transcript, EEF1A1 (bottom). Blots are representative of biological triplicates. (B) Schematic of Ribo-seq. (C) CDF plots of mRNA-normalized ribosome footprint reads (T.E.) for ac4C(−) transcripts in NAT10−/−A and parental HeLa cells (left); ac4C(−) and ac4C(+) transcripts in HeLa WT cells (middle), or in NAT10−/−A vs. HeLa WT (right). ac4C(−), n=5445; ac4C(+), n=1733. p = KS test. (D) RT-qPCR for differential expression of determined ac4C(−) and ac4C(+) mRNAs in NAT10−/−A and HeLa WT cells. Dots represent the mean from three biological replicates. Error bars depict the average and SD within ac4C(+) and ac4C(−) transcripts. (E) Representative Western blots of proteins associated with ac4C(+) and ac4C(−) transcripts from parental and NAT10−/−A HeLa cells. (F) Relative translation of select ac4C(+) and ac4C(−) transcripts as determined through the change in protein expression compared to the change in mRNA expression in NAT10−/− vs. parental HeLa cells. Dots represent the mean delta T.E. from three biological replicates. Error bars depict the average and SD within ac4C(+) and ac4C(−) transcripts. Two-tailed student’s t-test.
Figure 7.
Figure 7.. ac4C statistically and functionally associates with mRNA wobble cytidines.
(A) Codon bias within CDS-localized ac4C peaks relative to the entire transcriptome. Red bars depict codons with C in the wobble position. Horizontal lines indicate the magnitude of codon bias expected by random sampling at the significance level of p = 0.01 or p = 1e-4, as indicated. (B) Violin plot of aggregated codon bias results from (A). (C) ac4C-peak enriched codons with wobble C were ranked according to (A). Anticodon sequences of the respective tRNAs are shown with variable decoders highlighted in blue. (D) Sequence logo of enriched motifs within ac4C peaks determined using MEME. Enrichment p-value (E-value) derived from FDR corrected Fisher’s Exact Test. (E) Alignment of top scoring motifs in ac4C peaks to substrate mRNAs. Cytidines in blue designate occurrence within the third (wobble) position of each codon. (F) Firefly luciferase mRNA naturally containing C within wobble sites (wobble C) or with synonymous codon substitutions that removed C from all wobble sites (wobble A, U or G) was generated in the presence of CTP or ac4CTP. (G) mRNAs from (F) were transfected into HeLa cells. Luciferase activity was monitored through luminescence. Mean ± SEM, n=3. Two-Way ANOVA with Tukey’s post hoc test. (H) mRNAs from (F) were in vitro translated in reticulocyte lysates. Data represent the % difference in luminescence of wildtype versus mutated luciferase in the presence or absence of ac4C, mean ± SEM, n=3. Two-Way ANOVA.

Comment in

Similar articles

Cited by

References

    1. Agris PF, Vendeix FA, and Graham WD (2007). tRNA’s wobble decoding of the genome: 40 years of modification. J Mol Biol 366, 1–13. - PubMed
    1. Anders S, Pyl PT, and Huber W (2015). HTSeq--a Python framework to work with high-throughput sequencing data. Bioinformatics 31, 166–169. - PMC - PubMed
    1. Bailey TL, and Elkan C (1994). Fitting a mixture model by expectation maximization to discover motifs in biopolymers. Proc Int Conf Intell Syst Mol Biol 2, 28–36. - PubMed
    1. Basanta-Sanchez M, Temple S, Ansari SA, D’Amico A, and Agris PF (2016). Attomole quantification and global profile of RNA modifications: Epitranscriptome of human neural stem cells. Nucleic Acids Res 44, e26. - PMC - PubMed
    1. Boccaletto P, Machnicka MA, Purta E, Piatkowski P, Baginski B, Wirecki TK, de Crecy-Lagard V, Ross R, Limbach PA, Kotter A, et al. (2018). MODOMICS: a database of RNA modification pathways. Nucleic Acids Res 46, D303–D307. - PMC - PubMed

Publication types