Clinical Trial
. 2018 Nov 29;175(6):1701-1715.e16.
doi: 10.1016/j.cell.2018.10.022. Epub 2018 Nov 15.

Impact of Genetic Polymorphisms on Human Immune Cell Gene Expression

Affiliations
Clinical Trial

Impact of Genetic Polymorphisms on Human Immune Cell Gene Expression

Benjamin J Schmiedel et al. Cell. .

Abstract

While many genetic variants have been associated with risk for human diseases, how these variants affect gene expression in various cell types remains largely unknown. To address this gap, the DICE (database of immune cell expression, expression quantitative trait loci [eQTLs], and epigenomics) project was established. Considering all human immune cell types and conditions studied, we identified cis-eQTLs for a total of 12,254 unique genes, which represent 61% of all protein-coding genes expressed in these cell types. Strikingly, a large fraction (41%) of these genes showed a strong cis-association with genotype only in a single cell type. We also found that biological sex is associated with major differences in immune cell gene expression in a highly cell-specific manner. These datasets will help reveal the effects of disease risk-associated genetic polymorphisms on specific immune cell types, providing mechanistic insights into how they might influence pathogenesis (https://dice-database.org).

Keywords: DICE; GWAS; eGenes; eQTLs; gene expression; genetic variants; human immune cells; immunology; sex.


Conflict of interest statement

DECLARATION OF INTERESTS

The authors declare no competing interests.

Figures

Figure 1.
Figure 1.
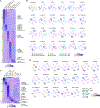
Transcriptome of common human immune cell types. (A) Study overview. (B) The pie chart shows relative proportions of the 13 primary cell types (details provided in Fig. S1 and Table S1A). (C) RNA-Seq analysis of 1,544 samples (details provided in Table S1B) showing the total number of detected transcripts categorized based on their mean expression levels (TPM, transcript per million) in the indicated cell types and activation conditions. (D) The fraction of expressed transcripts belonging to each biotype as defined in the Ensembl database. For comparison, the GRCh37.p13 bar shows the corresponding fractions for all 57,820 annotated transcripts in the reference genome. (E) Unsupervised hierarchical clustering of the transcriptomes of the indicated cell types based on the 1,000 most variable transcripts expressed; each line represents an independent sample.
Figure 2.
Figure 2.
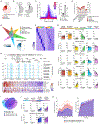
Cell-specific transcriptional signatures. (A and C) RNA-Seq analysis showing differentially expressed genes (STAR Methods), presented as row-wise z-scores of normalized TPM counts in the indicated cell types. (B and D) t-SNE plots of transcriptomes (symbol) for each of the indicated cell types for all subjects, and the expression of indicated cell-specific transcripts in each subject is shown in corresponding plots. Each symbol represents an independent sample; color scale represents the z-scores of normalized TPM counts in the indicated cell types.
Figure 3.
Figure 3.
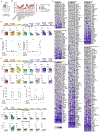
Expression QTLs are highly cell-specific. (A) The fraction of eGenes belonging to each biotype as defined in the Ensembl database. (B) Genomic location of all analyzed SNPs and the cis-eQTLs identified in this study. (C) Distance of cis-eQTLs from the transcription start site (TSS) of the associated transcript (eGene); left panel shows the adj. association P value for all peak cis-eQTLs (STAR Methods) and the dotted line indicates adj. P < 0.05; right panel shows the fraction of cis-eQTLs identified across all cell types and activation conditions (n = 15) in the indicated regions up and downstream of the TSS, each dot represents a specific cell type. Error bars are mean ± SEM; ***P < 0.001 by Student’s paired two-tailed t-test. (D) The total number of eGenes identified across the indicated cell types and activation conditions. (E) Overlap of eGenes identified in the indicated cell types (n = 6). The pie chart shows the fraction of eGenes identified in varying numbers of cell types. (F) Cell-specific eGene analysis, showing row-wise z-scores of the adj. association P values (left panel) and average expression levels (right panel) for cell-specific eGenes (one per row) in the indicated cell types. (G) Mean expression levels (TPM) of selected eGenes in the indicated cell types from subjects categorized based on the genotype at the indicated peak cis-eQTL; each symbol represents an individual subject; * adj. association P value < 0.05. (H) Top panel, University of California Santa Cruz (UCSC) tracks showing chromosomal location and genes present in the 12p13.2 locus (containing a large haplotype block of cis-eQTLs (black lines); red line indicates location of peak cis-eQTL of KLRK1 (rs2927561)); UCSC tracks of DNase hypersensitivity sites (provided by NIH Roadmap Epigenomics Mapping Consortium). Regions with active DHS in NK cells and CD8+ T cells, but not in the other cell types, are highlighted in blue. Bottom panel shows row-wise z-scores of TPM counts for the indicated eGenes in NK cells, where each column represents an individual subject. (I) Overlap of eGenes identified in resting and activated naïve CD4+ and CD8+ T cells. (J) Mean expression levels (TPM) of eGenes in resting and activated naïve CD4+ and CD8+ T cells from subjects categorized based on the genotype; each symbol represents an individual subject; * adj. association P value < 0.05. (K) FACS analysis of surface expression of 4–1BB and CD25 in naïve CD4+ T cells following stimulation at the indicated time points. The subjects (n = 13) were categorized based on the genotype of the cis-eQTL associated with TNFRSF9 (4–1BB) expression (C/C or T/T genotype at rs9657975); results of two-way ANOVA testing for significant differences between both groups are indicated for each surface marker.
Figure 4.
Figure 4.
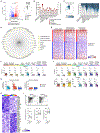
Expression QTLs in CD4+ T cell subsets. (A) Venn diagram indicates overlap of eGenes from cell types and activation conditions discussed in Fig. 3D (n = 8) with CD4+ memory and TREG subsets (n = 7). (B) The total number of eGenes identified across the indicated cell types and activation conditions. (C) Overlap of eGenes identified in the indicated cell types (n = 8). The pie chart shows the relative cell specificity of the eGenes of the indicated cell types, the bar graph shows the fraction of eGenes identified in each cell type. (D) Cell-specific eGene analysis, showing row-wise z-scores of the adj. association P values (left panel) and average expression levels (right panel) for cell-specific eGenes (one per row) in the indicated cell types (n = 91 subjects); each column represents a cell type. (E) Mean expression levels (TPM) of selected eGenes in the indicated cell types from subjects categorized based on the genotype at the indicated peak cis-eQTL; each symbol represents an individual subject; * adj. association P value < 0.05.
Figure 5.
Figure 5.
Cell types susceptible to GWAS SNPs. (A) Fraction of eGenes overlapping with significant SNPs (PGWAS < 5 × 10⁻⁸) that emerged from the catalogue of GWAS studies (GWAS SNPs) comprising 540 unique human diseases and traits (Table S4 and STAR Methods). (B) The total number of eGenes identified across the indicated cell types and activation conditions. (C) For each disease, the adj. association P value for the peak cis-eQTL with the indicated GWAS eGenes, excluding HLA genes, in each cell type and activation condition is shown. Example eGenes discussed in the results are printed in bold. (D) Mean expression levels (TPM) of LACC1 in the indicated cell types and activation conditions from subjects categorized based on the genotype at the cis-eQTL rs9567293; each dot represents an individual subject; * adj. association P value < 0.05. (E) Real-time PCR quantification of the effects of LACC1 knockdown on the induction of IFNG and IL2 expression in naive CD4+ T cells activated for 6 hours with antibodies to CD3 and CD28 in absence or presence of the TLR1/2 ligand Pam3CSK4 (n = 5); *P < 0.05 by Student’s paired two-tailed t-test; NS, not significant. (F) Mean expression levels (TPM) of NAB1 and SYNGR1 in the indicated cell types and activation conditions from subjects categorized based on the genotype at the indicated peak cis-eQTL; each dot represents an individual subject; * adj. association P value < 0.05. (G) Effects of NAB1 and SYNGR1 knockdown on the release of IFN-γ by NK cells activated for 24 hours with coated human IgG (n = 8); *P < 0.05 by Wilcoxon matched-pairs signed-rank test. (H) Effects of NAB1 and SYNGR1 knockdown on the release of IFN-γ by NK cells co-cultured for 24 hours with MHC devoid K-562 target cells (n = 8); *P < 0.05 by Wilcoxon matched-pairs signed-rank test. (I) Mean expression levels (TPM) of IKZF4 and PDEA4 in the indicated cell types from subjects categorized based on the genotype at the indicated peak cis-eQTL; each symbol represents an individual subject; * adj. association P value < 0.05.
Figure 6.
Figure 6.
Sex has major effects on gene expression. (A) RNA-Seq analysis of differentially expressed transcripts (sex-biased transcripts, each dot) in each immune cell type from female (n = 37) versus male (n = 54) subjects (STAR Methods). Right, fractions of sex-biased transcripts in autosomes, sex chromosomes and mitochondrial DNA. (B) Total number of sex-biased transcripts identified across all cell types and activation conditions. (C) Overlap of sex-biased transcripts in the indicated cell types (n = 15). The pie chart shows the relative cell specificity of the transcripts in the indicated cell types, the bar graph shows the fraction of sex-biased transcripts identified per cell type. (D) Ingenuity pathway analysis of sex-biased transcripts identified in classical monocytes that are regulated by interferon-γ and encode products with various functions (key indicates product type). (E) Column-wise z-scores of TPM counts for transcripts in the interferon (IFN, left panel), interferon regulatory factor (IRF, middle panel) and toll-like receptor (TLR, right panel) response pathways expressed in classical monocytes; each row represents an individual subject. (F) Mean expression levels (TPM) of sex-biased transcript FAM13A in the indicated cell types from female and male subjects; each symbol represents an individual subject; * adj. P value < 0.05. (G) Mean expression levels (TPM) of FAM13A in naïve CD4+ T cells and classical monocytes from female and male subjects categorized based on genotype at the indicated peak cis-eQTL; each symbol represents an individual subject; * adj. association P value < 0.05. (H) RNA-Seq analysis of genes (one per row, row-wise z-scores of normalized TPM counts shown) expressed differentially by ex vivo activated hCMV-specific CD4+ T cells following FAM13A siRNA knockdown versus those treated with siControl (adj. P value < 0.1 (DESeq2 analysis; Benjamini-Hochberg test)). Each column represents an individual biological replicate sample (siControl, n = 12; siFAM13A, n = 11); the color-code on top refers to the specific donors (n = 4). (I) Representative FACS plots showing intracellular staining of IL-2 and IL-22 in memory CD4+ T cells activated for 6 hours with PMA and Ionomycin (after knockdown with siRNA pool for control siRNA or FAM13A); frequencies of cytokine producing cells for IL-22, IFN-γ and IL-2 in each donor are shown below (n = 10); *P < 0.05 by Wilcoxon matched-pairs signed-rank test; NS, not significant. (J) Mean expression levels (TPM) of sex-biased transcripts in the indicated cell types from female and male subjects; each symbol represents an individual subject; * adj. P value < 0.05.

References

    1. 1000 Genomes Project Consortium (2015). A global reference for human genetic variation. Nature 526, 68–74. - PMC - PubMed
    1. Anders S, Pyl PT, and Huber W (2015). HTSeq--a Python framework to work with high-throughput sequencing data. Bioinformatics 31, 166–169. - PMC - PubMed
    1. Aryal S, Diaz-Guzman E, and Mannino DM (2014). Influence of sex on chronic obstructive pulmonary disease risk and treatment outcomes. Int J Chron Obstruct Pulmon Dis 9, 1145–1154. - PMC - PubMed
    1. Bacher P, Heinrich F, Stervbo U, Nienen M, Vahldieck M, Iwert C, Vogt K, Kollet J, Babel N, Sawitzki B, et al. (2016). Regulatory T Cell Specificity Directs Tolerance versus Allergy against Aeroantigens in Humans. Cell 167, 1067–1078 e1016. - PubMed
    1. Ballouz S, Verleyen W, and Gillis J (2015). Guidance for RNA-seq co-expression network construction and analysis: safety in numbers. Bioinformatics 31, 2123–2130. - PubMed

Publication types