. 2018 Dec 19;100(6):1354-1368.e5.
doi: 10.1016/j.neuron.2018.10.044. Epub 2018 Nov 15.

Mutations in MAST1 Cause Mega-Corpus-Callosum Syndrome with Cerebellar Hypoplasia and Cortical Malformations

Affiliations

Mutations in MAST1 Cause Mega-Corpus-Callosum Syndrome with Cerebellar Hypoplasia and Cortical Malformations

Ratna Tripathy et al. Neuron. .

Abstract

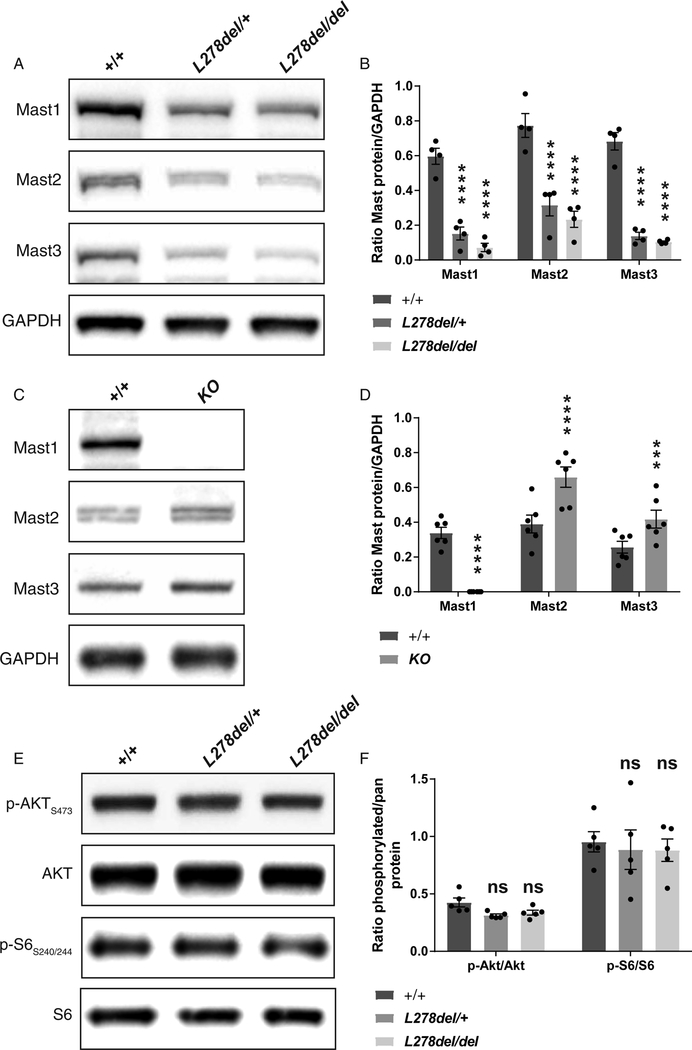
Corpus callosum malformations are associated with a broad range of neurodevelopmental diseases. We report that de novo mutations in MAST1 cause mega-corpus-callosum syndrome with cerebellar hypoplasia and cortical malformations (MCC-CH-CM) in the absence of megalencephaly. We show that MAST1 is a microtubule-associated protein that is predominantly expressed in post-mitotic neurons and is present in both dendritic and axonal compartments. We further show that Mast1 null animals are phenotypically normal, whereas the deletion of a single amino acid (L278del) recapitulates the distinct neurological phenotype observed in patients. In animals harboring Mast1 microdeletions, we find that the PI3K/AKT3/mTOR pathway is unperturbed, whereas Mast2 and Mast3 levels are diminished, indicative of a dominant-negative mode of action. Finally, we report that de novo MAST1 substitutions are present in patients with autism and microcephaly, raising the prospect that mutations in this gene give rise to a spectrum of neurodevelopmental diseases.

Keywords: MAST1; cerebellar hypoplasia; corpus callosum; microdeletion; microtubules.


Conflict of interest statement

Declaration of Interests

The authors declare no competing interests.

Figures

Figure 1.
Figure 1.. Patients with MAST1 mutations.
Selected magnetic resonance images from patients P1 (A-D), P2 (E-H), P3 (I,J), P4 (K,L), P5 (M-P) and P6 (Q-T) in the midline sagittal plane (A, E, I, K, M), parasagittal plane (Q), and axial planes through the brainstem (F, N), lateral ventricles (B, C, G, J, L, O, R, S, T), and high convexities (D, H, P). All patients have a cortical malformation or dysgyria characterized by diffuse undersulcation, shallow sulci (arrowheads in B, C, G, J, L, O, R, S, T point to selected more obvious areas), and in the more severely affected mildly thick cortex (G, J; thus consistent with mild lissencephaly). While diffused, the cortical malformation appears most severe in the posterior frontal and perisylvian regions. The lateral ventricles are mildly to moderately enlarged, and the corpus callosum is abnormally thick (arrows in A, E, I, K, M, Q), accompanied by mildly thick white matter. The brainstem especially the pons is mildly (E) or moderately (A, I, K, M, Q) small, and in at least one child a prominent ventral midline cleft of the pons is seen (arrow in N). Available axial images through the high convexity of the cerebral hemispheres showed very dysplastic, longitudinally oriented gyral pattern (long arrows in D, H, P). (U) Schematic representation of the MAST1 genomic locus shows the position of the mutations identified in patients P1–P6. (V) The MAST1 protein consists of a domain of unknown function (DUF1908, shown in red), a kinase domain (shown in yellow) and a PDZ domain (shown in blue). The amino acid boundaries of each of the domains are shown. (W-Z) Autoradiograph showing the results of the microtubule binding assay with Mast1. Murine Mast1 was radiolabelled (35S) by in vitro transcription and translation in rabbit reticulocyte lysate, before incubation with a porcine microtubule extract in the presence or absence of microtubule associated proteins (MAPs) (W,X). Following microtubule polymerization in the presence of Taxol, pelleted microtubules were analyzed by polyacrylamide gel electrophoresis (PAGE) and the ratio of pelleted radiolabeled-mMast1 to TnT input determined. This experiment revealed a decrease of binding of Mast1 to microtubules in the absence of MAPs (X; n=3 technical replicates; two-tailed unpaired t-test; t4=3.265, P<0.05). Patient mutations were introduced into mMast1, radiolabelled by in vitro transcription and translation (TnT), and microtubule binding assessed (Y,Z). As each mutant peptide was radiolabeled, the ratio of microtubule bound Mast1 (in the pelleted fraction), to total radiolabelled Mast1 was determined. Comparison of pelleted wild-type Mast1 to the K276del mutation shows a significant alteration in microtubule binding, and a similar trend for the L278del. (Z; n=6–9 repeated experiments; one-way ANOVA with Dunnett’s multiple comparison; WT vs K276del P<0.05). * shows P<0.05; ** shows P<0.01; *** shows P<0.001; **** shows P<0.0001. Error bars show mean +/− the standard error of the mean.
Figure 2.
Figure 2.. Mast1 expression in human and mouse embryonic brain.
(A) qPCR analysis reveals that MAST1 mRNA is expressed in the human developing fetal brain at gestational week (GW) 13 and the fetal frontal lobe at GW22. (B) qPCR analysis performed on mouse brain cDNA libraries from E10.5 to P6, show that Mast1 expression peaks at E16.5 in mice (n=3 animals per timepoint). (C-F) Immunohistochemistry employing a validated Mast1 antibody (see also Figure S2B–D) indicates staining in the post mitotic cortical plate and intermediate zone from E12.5 to P0 in mice. (G-R) Maximum projection images of cultured P0 cortical neurons at 5-DIV staining with the axonal marker Tau (G-L) and the dendritic marker Map2 (M-R), shows that Mast1 (I,L,O,R) is present in both axonal and dendritic compartments. Dashed boxes in G-I and M-O and expanded in J-L and P-R, respectively. (S-AP) Immunohistochemistry employing the progenitor marker Pax6 (S-U, AE-AG), intermediate progenitor marker Tbr2 (W-Y, AI-AK), and post mitotic marker Tuj (AA-AC, AM-AO) on E14.5 (S-AD) and E16.5 (AE-AP) murine sections reveal that Mast1 expression is restricted to post-mitotic neurons at these timepoints (PP: preplate; CP: cortical plate; MZ: marginal zone; IZ: intermediate zone; VZ: ventricular zone).
Figure 3.
Figure 3.. L278del mice have an enlarged corpus callosum associated with an increase in the number of callosal axons.
(A-D) Nissl-stained sections of 8-week old adult brains highlighting the thicker corpus callosum in L278del/+ animals compared to wild type littermates (black boxes in A,B expanded in C,D). Quantification of the thickness at the septum (E) reveals a significantly thicker corpus callosum in L278del/+ animals (n=5 animals per genotype; unpaired t-test; +/+ v L278del/+; t8=6.215, P<0.001). (F-G) MRI reconstructions of the corpus callosum in wild-type controls (F) and L278del/+ mice (G). The heat map reflects the thickness of the corpus callosum (blue: thinner region, red: thicker region). Note that in L278del/+ animals the genu and mid body region are most affected. (H) MRI volumetric quantification of the corpus callosum shows that this structure is significantly larger in L278del/+ animals compared to wild type littermates (n=3 animals per genotype; two-tailed unpaired t-test; +/+ v L278del/+; t4=4.233, P<0.05). (I-J) Electron microscopy images showing cross-sections of the corpus callosum at the midbody (region depicted with boxes in F and G). Myelinated axons can be clearly visualised. (K) Quantification of myelin thickness reveals no significant different between L278del/+ animals and wild type littermates (n=5 animals per genotype, >500 myelinated axons per animal; two-tailed unpaired t-test; t8=1.001, P>0.1). (L) Quantification of axonal caliber reveals no significant different between L278del/+ animals and wild type littermates (n=5 animals per genotype, >1500 myelinated axons per animal; +/+ v L278del/+; two-tailed unpaired t-test; t8=1.786, P>0.1, see also Figure S3N). (M-N) Assessment of the total number of myelinated axons within a 30μm wide box extending along the ventro-dorsal axis of the corpus callosum. (O) Quantification reveals a significant increase in axonal count in the L278del/+ animals in comparison to wild-type littermates (n=5 animals per genotype, 3 images analyzed per animal; two-tailed unpaired t-test; t8=4.095, P<0.01). * shows P<0.05; ** shows P<0.01; *** shows P<0.001; **** shows P<0.0001. Error bars show mean +/− the standard error of the mean.
Figure 4.
Figure 4.. L278del mice have a reduction in cortical volume associated with an increase in neuronal apoptosis.
(A,B) MRI reconstructions of the cortex in adult animals reveals a reduction in cortical volume in L278del/+ mice in comparison to littermate controls. (C) Quantification of the MRI cortical volume (n=3 animals per genotype; two-tailed unpaired t-test; +/+ vs L278del/+; t4=2.902, P<0.05). (D-E) Nissl stained sections of the adult somatosensory cortex reveals a reduction in cortical thickness in L278del/+ adult mice in comparison to littermate controls. (F) Quantification of caudal cortical thickness (n=5 animals per genotype; two-tailed unpaired t-test; +/+ vs L278del/+; t8=5.417, P<0.001). (G-H) Labeling of Cux1-positive layer II-III and (J-K) Er81-positive layer 5 neurons in wild type and L278del/+ adult mice. (I) Quantification reveals no significant difference in Cux1 layer thickness when comparing genotypes but a significant reduction in the size of the Er81-positive layer (L) (n=5 animals per genotype; 2-way repeated measures ANOVA with a Bonferroni test for multiple comparisons; +/+ vs L278del/+; Cux1 layer P>0.1; Er81 layer P<0.01). (M-X) Representative Nissl (M-O) activated caspase-3 (P-U), and activated caspase 9 (V-X) stained P0 cortical sections of littermate controls (M,P,S,V), L278del/+ (N,Q,T,W), and L278del/del (O,R,U,X) animals. The white boxes in P,Q,R are expanded in S,T,U. The number of caspase-3 and 9 positive cells in the cortex of P0 animals was counted and averaged (3 sections per animal). There is a dose dependent increase in apoptotic cells in L278del/+ and L278del/del animals in comparison to littermate controls (see also Figure S4V). (Y) Quantitation of capase-3 staining and (Z) caspase-9 staining (n=5 animals per genotype; n=3 sections per animal; 2-way repeated measures ANOVA with a Bonferroni test for multiple comparison; Caspase-3: +/+ vs. L278del/+ P<0.01;’+/+ vs. L278del/del P<0.0001; L278del/+ vs. L278del/del P<0.001; Caspase-9: +/+ vs.L278del/+ P<0.05; ‘+/+ vs. L278del/del P<0.0001; L278del/+ vs. L278del/del P<0.01). * shows P<0.05; ** shows P<0.01; *** shows P<0.001; **** shows P<0.0001. Error bars show mean +/−the standard error of the mean.
Figure 5.
Figure 5.. L278del mice have a hypoplastic cerebellum.
(A-B) MRI reconstructions of the cerebellum from wild type littermates (A) and L278del/+ (B) adult animals. (C) Quantification reveals a significant reduction in cerebellar volume (mm3) in L278del/+ animals (n=3 animals per genotype; two-tailed unpaired t-test; +/+ vs. L278del/+; t4=10.16, P<0.001). (D-G) Nissl stained sagittal sections of 8-week old cerebellum confirms the reduction in cerebellar size and indicates that lamination within the cerebellum is normal in L278del/+ animals. (H-I) Immunostaining employing the neuronal marker NeuN (shown in red) and the Purkinje cell marker Calbindin (shown in green) revealed a reduction in the thickness of the granule cell layer and molecular layer in L278del/+ animals. (J-K) Estimates of the total number of granule cells (J) and Purkinje cells (K) per a midsaggital section in L278del/+ animals and littermate controls (n=5 animals per genotype; two-way ANOVA with a Bonferroni correction; +/+ vs. L278del/+; granule cell counts: P<0.05; Purkinje cell counts: P>0.5, see also Figure S5A,B). (L-Q) Immunohistochemistry employing sera for activated Caspase3 reveals an increase in apoptosis in the L278del/+ and L278del/del animals in the developing cerebellum at P0. The white boxes in L,N,P are expanded in M,O,Q, respectively. (R) Quantification of capase3 staining (n=3 animals per genotype; one-way ANOVA with Tukey multiple comparison; +/+ vs. L278del/+ P<0.01; +/+ vs. L278del/del P<0.001; L278del/+ vs. L278del/del P<0.01). * shows P<0.05; ** shows P<0.01; *** shows P<0.001; **** shows P<0.0001. Error bars show mean +/− the standard error of the mean.
Figure 6.
Figure 6.. The L278del mutation influences Mast1/2/3 protein levels, but does not activate the PI3K/AKT3/mTOR pathway.
(A-B) Western blot analysis of Mast1, Mast2 and Mast3 on P0 cortical lysates from L278del animals. Quantification reveals a dramatic reduction of Mast1, Mast2 and Mast3 protein levels in L278del heterozygotes and homozygotes in comparison to littermate controls (n=4 animals per genotype; 2-way repeated measures ANOVA with a Bonferroni correction; Mast1: +/+ vs L278del/+ P<0.0001; +/+ vs L278del/del P<0.0001; Mast2: +/+ vs L278del/+ P<0.0001; +/+ vs L278del/del P<0.0001; Mast3: +/+ vs L278del/+ P<0.0001; +/+ vs L278del/del P<0.0001, see also Figure S6–C). (C-D) Western blot analysis of Mast1, Mast2 and Mast3 on brain lysates from Mast1 KO animals. While Mast1 is absent, there is a significant increase in the levels of Mast2 and Mast3 when compared to littermate controls (n=6 animals per genotype; 2-way repeated measures ANOVA with a Bonferroni test for multiple comparison; Mast1: +/+ vs KO P<0.0001; Mast2: +/+ vs KO P<0.0001; Mast3: +/+ vs KO P<0.001, see also Figure S6D–F). (E-F) Levels of phosphorylated AKT and ribosomal S6 proteins, indicators of activation of PI3K/AKT/m-TOR pathway, are not significantly different in wild type and L278del P0 cortex (n=5 animals per genotype; 2-way repeated measures ANOVA with a Bonferroni test for multiple comparison; +/+ vs L278del/+ AKT P>0.5; +/+ vs L278del/del AKT P>0.5; L278del/+ vs L278del/del AKT P>0.5; +/+ vs L278del/+ rpS6 P>0.5; +/+ vs L278del/L278del rpS6 P>0.5; L278del/+ vs L278del/Ldel rpS6 P>0.5). * shows P<0.05; ** shows P<0.01; *** shows P<0.001; **** shows P<0.0001. Error bars show mean +/− the standard error of the mean.

References

    1. Andrade EC, Musante V, Horiuchi A, Matsuzaki H, Brody AH, Wu T, Greengard P, Taylor JR, and Nairn AC (2017). ARPP-16 Is a Striatal-Enriched Inhibitor of Protein Phosphatase 2A Regulated by Microtubule-Associated Serine/Threonine Kinase 3 (Mast 3 Kinase). The Journal of neuroscience : the official journal of the Society for Neuroscience 37, 2709–2722. - PMC - PubMed
    1. Baranek C, D ittrich M, Parthasarathy S, Bonnon CG, Britanova O, Lanshakov D, Boukhtouche F, Sommer JE, Colmenares C, Tarabykin V, and Atanasoski S (2012). Protooncogene Ski cooperates with the chromatin-remodeling factor Satb2 in specifying callosal neurons. Proceedings of the National Academy of Sciences of the United States of America 109, 3546–3551. - PMC - PubMed
    1. Britanova O, de Juan Romero C, Cheung A, Kwan KY, Schwark M, Gyorgy A, Vogel T, Akopov S, M itkovski M, Agoston D, et al. (2008). Satb2 is a postmitotic determinant for upper-layer neuron specification in the neocortex. Neuron 57, 378–392. - PubMed
    1. Broix L, Jagline H, E LI, Schmucker S, Drouot N, Clayton-Smith J, Pagnamenta AT, Metcalfe KA, Isidor B, Louvier UW, et al. (2016). Mutations in the HECT domain of NEDD4L lead to AKT-mTOR pathway deregulation and cause periventricular nodular heterotopia. Nature genetics 48, 1349–1358. - PMC - PubMed
    1. Consortium GT (2013). The Genotype-Tissue Expression (GTEx) project. Nature genetics 45, 580–585. - PMC - PubMed

Publication types

MeSH terms

Substances

Supplementary concepts