. 2019 Feb 5;29(2):399-416.e10.
doi: 10.1016/j.cmet.2018.10.014. Epub 2018 Nov 15.

Reactivation of Dihydroorotate Dehydrogenase-Driven Pyrimidine Biosynthesis Restores Tumor Growth of Respiration-Deficient Cancer Cells

Affiliations

Reactivation of Dihydroorotate Dehydrogenase-Driven Pyrimidine Biosynthesis Restores Tumor Growth of Respiration-Deficient Cancer Cells

Martina Bajzikova et al. Cell Metab. .

Abstract

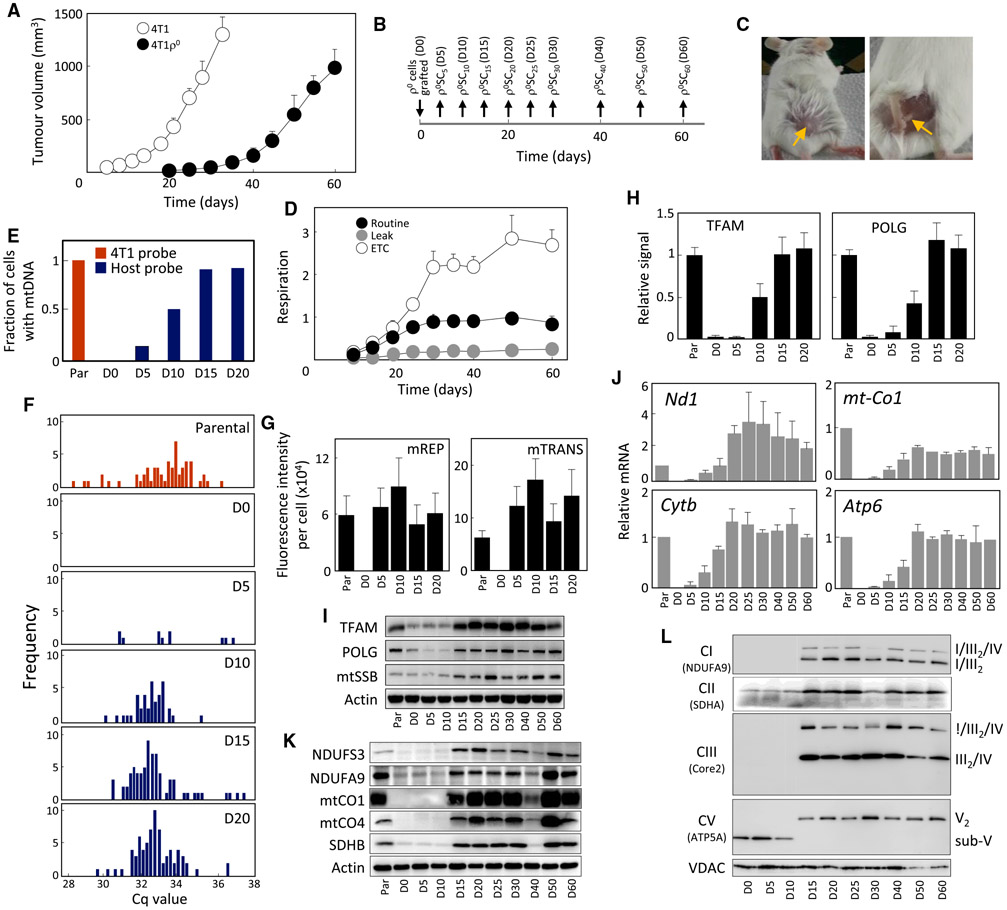
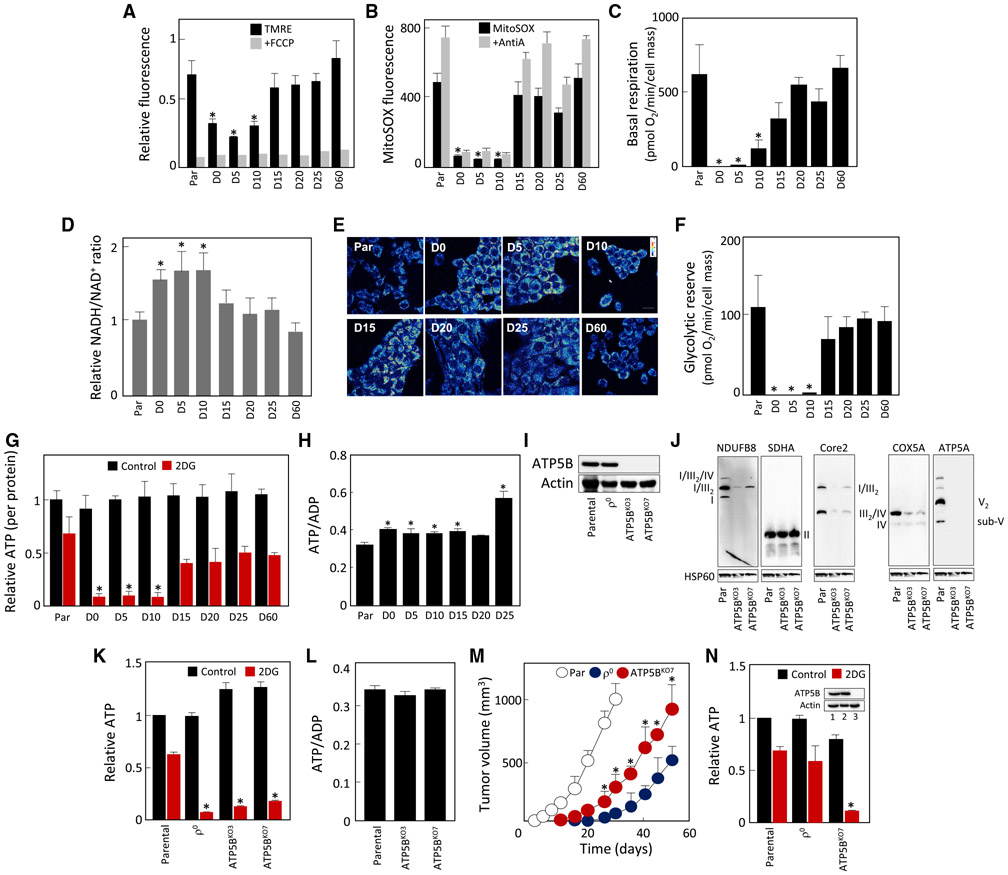
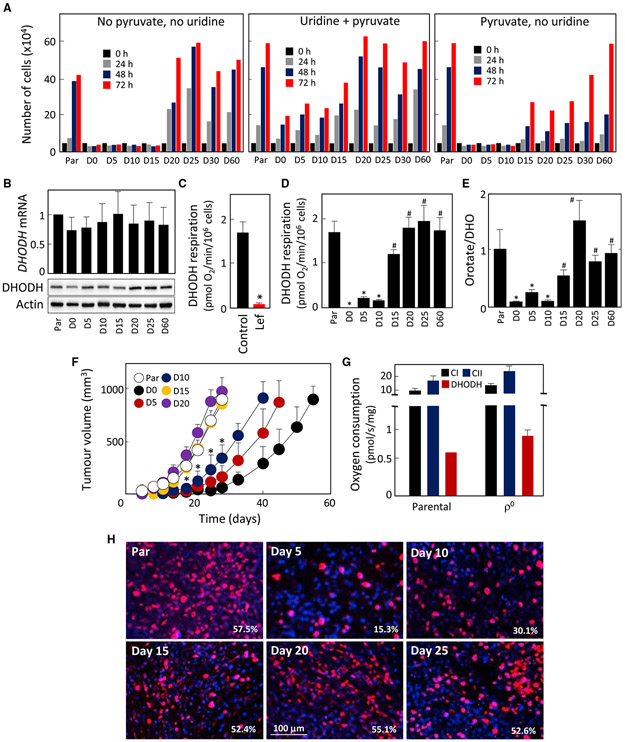
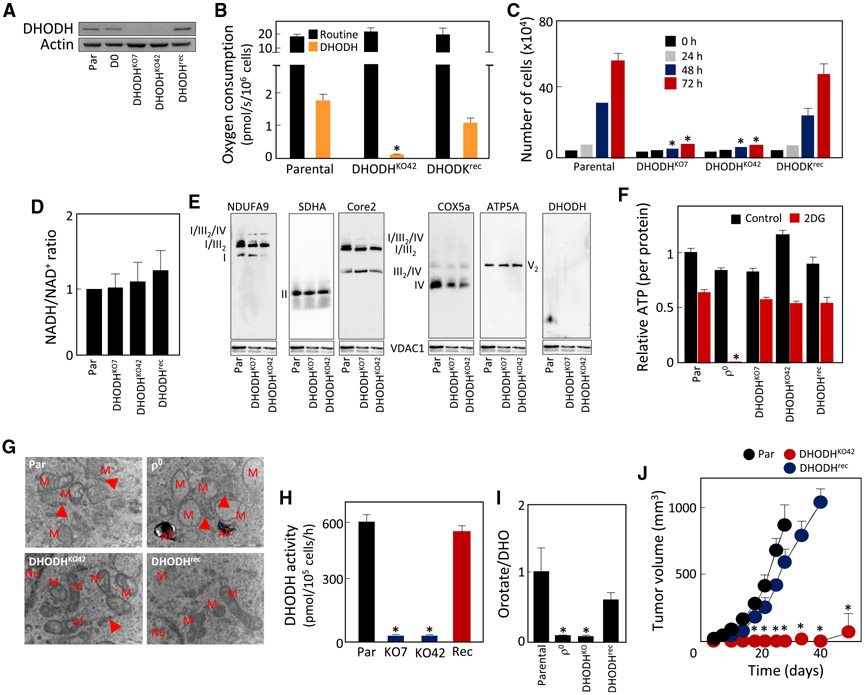
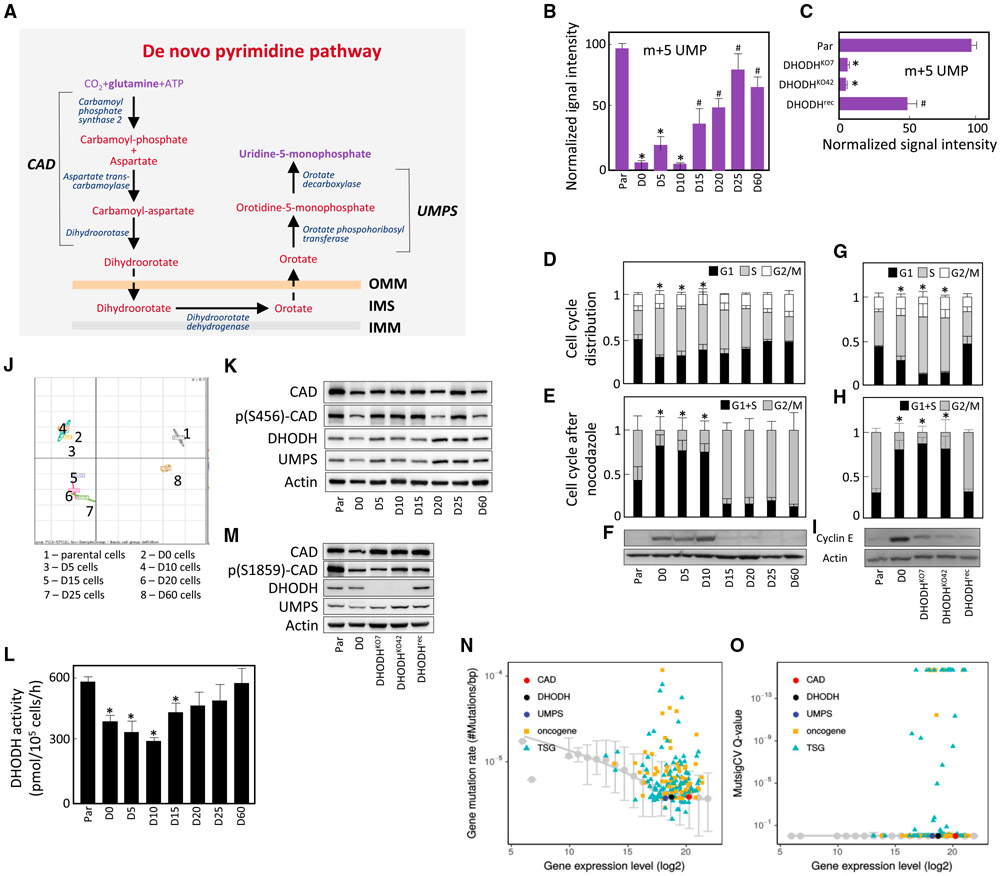
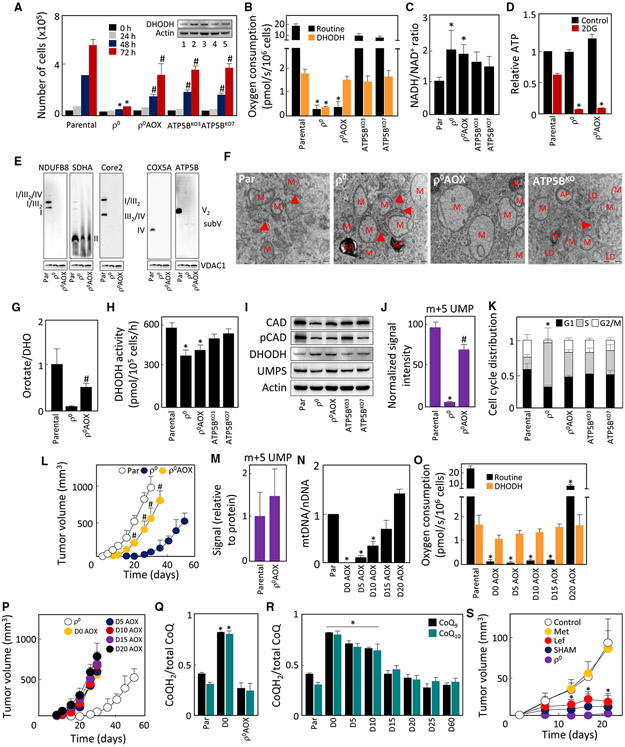
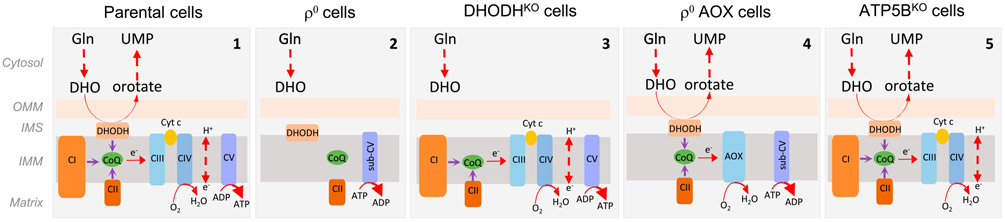
Cancer cells without mitochondrial DNA (mtDNA) do not form tumors unless they reconstitute oxidative phosphorylation (OXPHOS) by mitochondria acquired from host stroma. To understand why functional respiration is crucial for tumorigenesis, we used time-resolved analysis of tumor formation by mtDNA-depleted cells and genetic manipulations of OXPHOS. We show that pyrimidine biosynthesis dependent on respiration-linked dihydroorotate dehydrogenase (DHODH) is required to overcome cell-cycle arrest, while mitochondrial ATP generation is dispensable for tumorigenesis. Latent DHODH in mtDNA-deficient cells is fully activated with restoration of complex III/IV activity and coenzyme Q redox-cycling after mitochondrial transfer, or by introduction of an alternative oxidase. Further, deletion of DHODH interferes with tumor formation in cells with fully functional OXPHOS, while disruption of mitochondrial ATP synthase has little effect. Our results show that DHODH-driven pyrimidine biosynthesis is an essential pathway linking respiration to tumorigenesis, pointing to inhibitors of DHODH as potential anti-cancer agents.

Keywords: OXPHOS; cancer; coenzyme Q; dihydroorotate dehydrogenase; mitochondria; pyrimidine biosynthesis; respiration.


Conflict of interest statement

DECLARATION OF INTERESTS

The authors declare that they have no competing interests.

Figures

Figure 1.
Figure 1.. mtDNA Is Replenished and Respiration Recovers Early in Tumor Formation by 4T1ρ° Cells
(A) BALB/c mice (n = 6) were grafted subcutaneously (s.c.) with 4T1 or 4T1 ρ° cells at 106 per animal, and tumor volume was assessed by ultrasound imaging (USI) (n = 6). (B and C) Time schedule of retrieval of pre-tumor plaques and tumors from BALB/c mice is shown in (B), as indicated in (C) for D5 tissue. (D) Individual lines retrieved from mice according to the schedule in (B) were assessed for uncoupled (ETC), routine, and leak respiration using the Oxygraph (n = 3). (E) Cell lines were evaluated for the presence of mtDNA using probes against a polymorphism in either 4T1 or host 16S rRNA by sc/qPCR; 92 cells per line were assessed. (F) Distribution of mtDNA polymorphism in 16S rRNA of individual cells of lines plotted using data presented in (E). (G) mTRIP assay in the presence of proteinase K was used to detect the mtDNA initiation of replication marker (mREP) and global mitochondrial transcripts (mTRANS) unmasked from proteins, in single cells (n = 3; 100 cells were assessed per condition). (H) Cell lines were assessed for binding of TFAM and POLG1 to the D LOOP region of mtDNA using a mitoChIP assay (n = 3). (I) Individual lines were probed for the level of mtDNA-processing proteins using WB. (J–L) qRT-PCR was used to assess the level of transcripts of selected subunits of mitochondrially encoded transcripts of RCs (n = 3) (J). Selected subunits of mitochondrial RCs were evaluated using WB in individual lines (K), which were then assessed by NBGE for the assembly of RCs and SCs using antibodies to relevant subunits, as shown (L). Data in (A), (D), (G), (H), and (J) are mean values ± SD. Representative images of three biological replicates are shown for (I), (K), and (L).
Figure 2.
Figure 2.. Mitochondrial Function and Bioenergetics Are Normalized Early in 4T1ρ° Cell Tumorigenesis and Are Unrelated to OXPHOS-Generated ATP
(A–C) Individual lines derived from 4T1ρ° cells were assessed for ΔΨm,i using TMRE in the absence and presence of the uncoupler FCCP (A), for generation of mitochondrial superoxide using MitoSOX in the absence and presence of antimycin A (AntiA) (B), and for basal respiration using a Seahorse XF96 (C). (D) NADH/NAD+ ratio was assessed in cell lines using a luminescence kit. (E) Two-photon microscopy was used to visualize the level of mitochondrial NAD(P)H in individual lines. (F) Cell lines were assessed for glycolytic reserve using a Seahorse XF96. (G) Individual lines were evaluated for ATP levels in the absence and presence of 50 mM 2DG at 4.5 g/L glucose and 1 mM pyruvate, and the results were expressed relative to total ATP in parental cells. (H) The lines as shown were assessed for the ATP/ADP ratio using liquid chromatography-mass spectrometry. (I) Parental and ρ° cells and two clones of ATP5BKO cells were probed for the level of ATP5B using WB. (J–L) Parental, ρ°, and ATP5BKO cells were assessed by NBGE for assembly of RCs and SCs (J). Parental, ρ°, and ATP5BKO cells were tested for the level of ATP at 4.5 g/L glucose in the absence or presence of 50 mM 2DG (K) and for the ATP/ADP ratio (L). (M) BALB/c mice were injected s.c. with 106 cells per animal, and tumor volume was quantified by USI. (N) Cell lines derived on day 20 from tumors grown from parental, ρ°, and ATP5BKO 4T1 cells were assessed for ATP as described in (G). The insert documents the level of ATP5B protein in the tumor-derived cell lines; 1, parental; 2, ρ°; 3, ATP5BKO7 cells. Data in (A)–(D), (F)–(H), and (K)–(M) are mean values ± SD (n = 3); those in (M) are mean values ± SED (n = 5). The symbol “*” in (A)–(D), (F)–(H), (K), and (N) indicates statistically significant differences from parental cells; in (M), statistically significant differences from tumors grown from ρ° cells; and in (L), statistically different from tumors grown from parental cells, with p < 0.05. (E), (I), (J), and (N) (insert) show representative images of three biological replicates.
Figure 3.
Figure 3.. Respiration Recovery Is Associated with Reactivation of DHODH
(A) Cell lines as shown were evaluated for growth in the presence of uridine and pyruvate, or with pyruvate or uridine removed. (B) Cell lines were assessed for DHODH expression by qRT-PCR and WB. (C–E) DHODH-dependent respiration was assessed in parental 4T1 cells in the absence and presence of 30 μM leflunomide (Lef) (C). Individual lines were assessed for DHODH-dependent respiration (D) and for the orotate-to-DHO ratio (E). (F) Parental, D0, D5, D10, D15, D20, D25, and D60 cells (106) were grafted s.c. into BALB/c mice, and tumor growth was evaluated by USI. (G) Tumors grown from parental or 4T1 ρ° cells were excised and processed in a dedicated tissue shredder, and the homogenates were assessed for CI-, CII-, and DHODH-dependent respiration using an Oxygraph. (H) BALB/c mice were grafted s.c. with 106 D0 cells. On the days indicated, animals were sacrificed and tissue from the grafted region excised, sectioned, and assessed by immunohistochemistry for proliferation using anti-Ki67 IgG followed by confocal microscopy. The numbers indicate percentage of Ki67-positive cells. Data in (A) are mean values derived from two biological replicates with differences less than 10%; data in (B) are mean values ±SD (n ≥ 3); data in (C–G) are mean values ± SEM (n = 3); images in (B) and (H) are representative of three independent experiments. The symbol “*” indicates statistically significant differences from parental cells, and the symbol “#” indicates statistically significant difference from D0 cells, with p < 0.05.
Figure 4.
Figure 4.. DHODH Is Essential for Tumor Growth
(A–I) WB shows the absence of DHODH in two clones of DHODHKO 4T1 cells and its presence in DHODHrec cells (A). Parental, DHODHKO, and DHODHrec cells were tested for routine and DHODH-dependent respiration (B), auxotrophyfor uridine (C), NADH/NAD+ ratio (D), assembly of RCs and SCs (E), ATP generation in the absence or presence of 50 mM 2DG (4.5 g/L glucose) (F), mitochondrial morphology using TEM (G), DHODH activity (H), and orotate-to-DHO ratio (I). (J) Parental, DHODHKO, and DHODHrec cells were grafted s.c. in BALB/c mice at 106 per animal, and tumor formation was assessed by USI. Data in (B)–(D), (F), and (I) are mean values ± SD(n ≥ 3); data in (H) and (J) are mean values ± SEM (n = 3 for H, n = 6 for J). The symbol “*” indicates statistically significant differences from parental cells, with p.
Figure 5.
Figure 5.. DHODH Links Respiration to De Novo Pyrimidine Synthesis and Cell-Cycle Progression
(A–L) De novo pyrimidine synthesis is catalyzed by the trifunctional CAD protein that includes the enzymatic activities of carbamoyl phosphate synthase 2, aspartate transcarbamoylase and dihydroorotase, the DHODH protein, the bifunctional UMPS protein with enzymatic activities of orotate phosphoribosyl transferase, and orotate decarboxylase (A). OMM, outer mitochondrial membrane; IMS, intermembrane space; IMM, inner mitochondrial membrane. 4T1 lines (B) and 4T1 cells with different DHODH status (C) were analyzed by liquid chromatography-mass spectrometry with 13C515N2-glutamine as the substrate for generation of the m+5 isotopomer of UMP, the product of the de novo pyrimidine pathway shown in (A). 4T1 lines were assessed for cell-cycle distribution (D), arrest in G2 following nocodazole treatment (10 μM, 1 hr) (E), and the level of cyclin E (F). 4T1 cells with different DHODH status were assessed for cell-cycle distribution (G), arrest in G2 following nocodazole treatment (H), and the level of cyclin E (I). Parental, D0, D5, D10, D15, D20, D25, and D60 cells were used for transcriptome analysis using the mouse Affymetrix chip, and the data were assessed by PCA (J). Parental and D0–D60 cells were assessed for members of the de novo pyrimidine pathway by WB (K) and for the DHODH enzymatic activity using an in vitro assay (L). (M) Parental, D0, DHODHKO, and DHODHrec cells were assessed for components of the de novo pyrimidine pathway by WB. (N) Raw mutation rates as a function of the average expression level. Mutations of oncogenes (in orange) and tumor suppressor genes (in blue) are compared with genes involved in the de novo pyrimidine biosynthesis. The baseline from median mutation rate of non-cancer genes is also shown as gray for comparison. (O) Statistical significance of mutation rates over expected values (MutsigCV Q-value) as a function of the average expression level for cancer genes and genes involved in de novo pyrimidine biosynthesis, as compared with the baseline from non-cancer genes. Data in (B)–(E), (G), and (H) are mean values ± SD; data in (L) are mean values ± SEM (n ≥ 3). The symbol “*” indicates statistically significant differences from parental cells, and the symbol “#” indicates statistically significant difference from D0 cells, with p < 0.05. (F), (I), (K), and (M) show representative images of three biological replicates. Data in (N) and (O) represent analysis of more than 11,000 patients diagnosed with 33 different types of cancer listed in the Cosmic database.
Figure 6.
Figure 6.. ATP5B Cells Maintain Functional DHODH, Propelled by CIII and CIV
(A–D) Parental, ρ°, ρ° AOX, and ATP5BKO cells were evaluated for growth in the absence of uridine (A), the level of the DHODH proteins by WB (A, insert), routine and DHODH-dependent respiration (B), NADH/NAD+ ratio (C), and ATP generation in the absence or presence of 50 mM 2DG (4.5 g/L glucose) (D). (E–K) Parental, ρ°, and ρ° AOX cells were evaluated by NBGE for the assembly of RCs and SCs using antibodies against subunits of individual RCs (E). Cells as shown were evaluated for mitochondrial morphology using TEM (F); the ratio of orotate-to-DHO (G); DHODH activity (H); level of the CAD, p(S1859)-CAD, DHODH, and UMPS proteins (I); formation of m+5 UMP from 13C5,15N2-Gln (J); and cell-cycle distribution (K). (L) Parental, ρ°, and ρ° AOX cells were grafted s.c. in BALB/c mice at 106 per animal, and tumor formation was assessed by USI. (M–O) BALB/c mice with 4T1 and 4T1ρ° AOX cell-derived tumors (≈250 mm3) were cannulated via the jugular vein and infused with 13C5, 15N2-Gln, and the tumors were analyzed for the M+5 UMP isotopomer as detailed in STAR Methods (M). ρ° AOX(D0 AOX) cells were grafted into BALB/c mice s.c. at 106 per animal. On days 5, 10, 15, and 20 post-grafting, the (pre-)tumor plaques were excised from the animals and D5 AOX, D10 AOX, D15 AOX, and D20 AOX lines were established. Parental and D0 AOX-D20 AOX cells were assessed for mtDNA using qPCR (N) and for routine and DHODH-dependent respiration using the Oxygraph (O). (P) Parental, D0, and D0 AOX to D20 AOX cells were grafted in BALB/c mice (106 cells/per animal), and tumor volume was assessed by USI. (Q) Parental, ρ°, and ρ° AOX cells were assessed for the ratio of CoQH2 and total CoQ including the CoQ9 and CoQ10 analogs. (R) Parental and ρ° (D0) cells as well as D5–D60 lines were assessed for the ratio of CoQH2 and total CoQ. (S) BALB/c mice were grafted with ρ° AOX cells at 106 per animal; tumors were treated with metformin (Met), leflunomide(Lef), and salicylhydroxamicacid (SHAM) as detailed in STAR Methods; and tumor volume was quantified. Data in (A)–(D), (G), (J), (K), (M), (N), (Q), and (R) are mean values ± SD (n = 3); those in (H) and (O) n = 3; (L) and (S) (n = 5) are mean values ±SEM. The symbol “*” indicates statistically significant differences from parental cells, with p < 0.05; the symbol “#” indicates statistically significant differences from ρ° cells, with p < 0.05. (A, insert), (E), (F), and (I) show representative images of three biological replicates.
Figure 7.
Figure 7.. Scheme Depicting the Role of Respiration in Propelling De Novo Pyrimidine Synthesis
Individual schemes illustrating the role of respiration in de novo pyrimidine synthesis with central role of CoQ and DHODH, as documented using our cell models, including parental (1), ρ° (2), DHODHKO (3), ρ° AOX (4), and ATP5BKO cells (5).

References

    1. Acin-Perez R, Fernandez-Silva R, Peleato ML, Perez-Martos A, and Enriquez JA (2008). Respiratory active mitochondrial supercomplexes. Moi. Ceil 32, 529–539. - PubMed
    1. Adam-Vizi V, and Chinopoulos C (2006). Bioenergetics and the formation of mitochondrial reactive oxygen species. Trends Pharmacol. Sci 27, 639–645. - PubMed
    1. Aiistar A, Morris BB, Desnoyer R, Kiepin HD, Hosseinzadeh K, Clark C, Cameron A, Leyendecker J, Topaloglu U, Boteju LW, et al. (2017). Safety and tolerability of the first-in-class agent CPI-613 in combination with modified FOLFIRINOX in patients with metastatic pancreatic cancer: a single-centre, open-label, dose-escalation, phase 1 trial. Lancet Oncol. 18, 770–778. - PMC - PubMed
    1. Althoff T, Mills DJ, Popot JL, and Kühlbrandt W (2011). Arrangement of electron transport chain components in bovine mitochondrial supercomplex I1III2IV1. EMBO J. 30, 4652–4664. - PMC - PubMed
    1. Anso E, Weinberg SE, Diebold LP, Thompson BJ, Malinge S, Schumacker PT, Liu X, Zhang Y, Shao Z, Steadman M, et al. (2017). The mitochondrial respiratory chain is essential for haematopoietic stem cell function. Nat. Cell Biol 19, 614–625. - PMC - PubMed

Publication types

LinkOut - more resources