. 2018 Dec 11;11(6):1506-1522.
doi: 10.1016/j.stemcr.2018.10.015. Epub 2018 Nov 15.

Enhancement of Sensitivity to Chemo/Radiation Therapy by Using miR-15b against DCLK1 in Colorectal Cancer

Affiliations

Enhancement of Sensitivity to Chemo/Radiation Therapy by Using miR-15b against DCLK1 in Colorectal Cancer

Dengbo Ji et al. Stem Cell Reports. .

Abstract

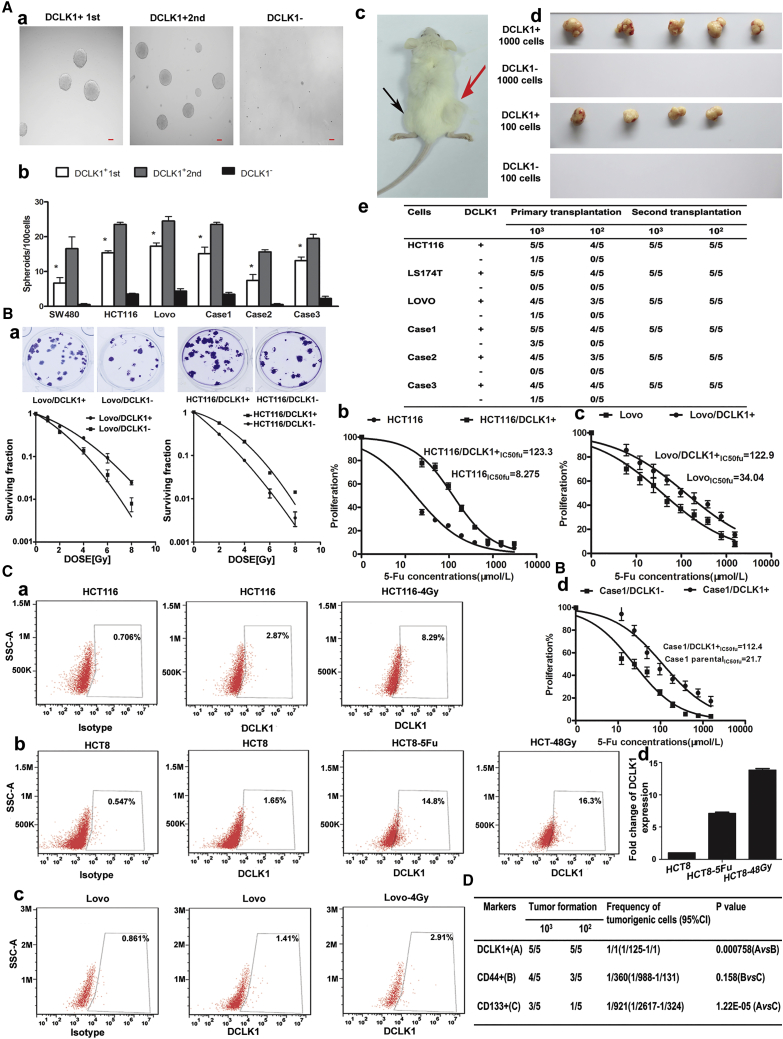
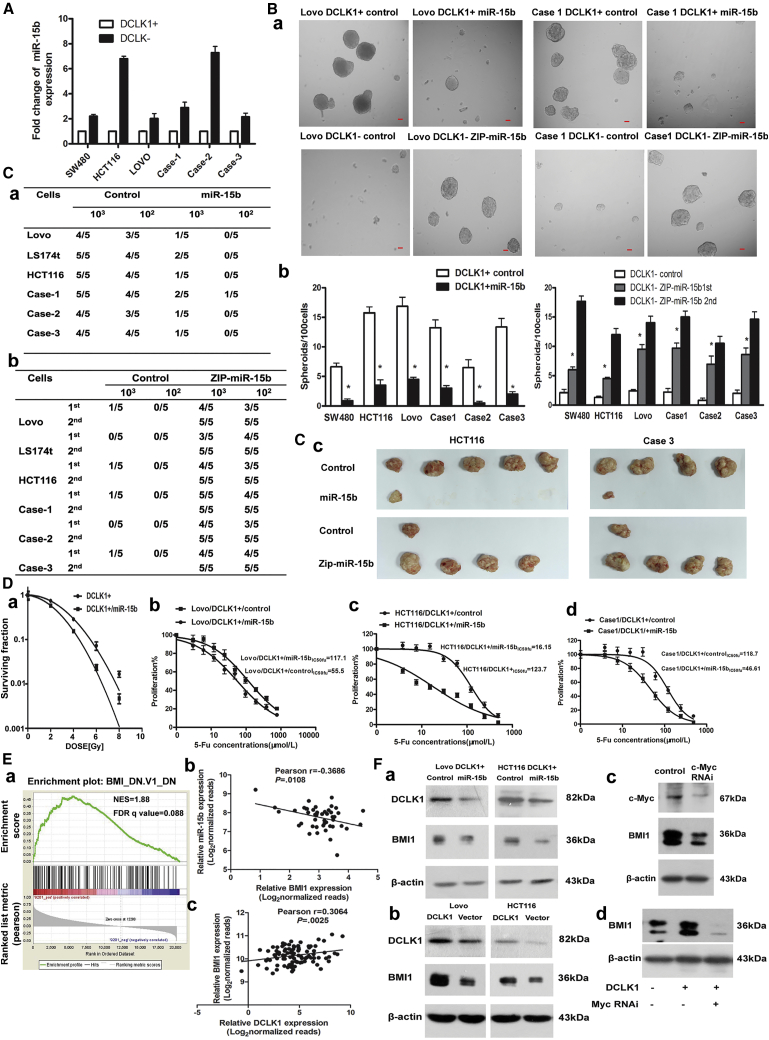
Chemo-/radiotherapy resistance is the main cause accounting for most treatment failure in colorectal cancer (CRC). Tumor-initiating cells (TICs) are the culprit leading to CRC chemo-/radiotherapy resistance. The underlying regulation mechanism of TICs in CRC remains unclear. Here we discovered that miR-15b expression positively correlated with therapeutic outcome in CRC. Expression of miR-15b in pretreatment biopsy tissue samples predicted tumor regression grade (TRG) in rectal cancer patients after receiving neoadjuvant radiotherapy (nRT). Expression of miR-15b in post-nRT tissue samples was associated with therapeutic outcome. DCLK1 was identified as the direct target gene for miR-15b and its suppression was associated with self-renewal and tumorigenic properties of DCLK1+ TICs. We identified B lymphoma Mo-MLV insertion region l homolog (BMI1) as a downstream target regulated by miR-15b/DCLK1 signaling. Thus, miR-15b may serve as a valuable marker for prognosis and therapeutic outcome prediction. DCLK1 could be a potential therapeutic target to overcome chemo-/radioresistance in CRC.

Keywords: DCLK1; chemo-/radiotherapy; colorectal cancer; miR-15b.


Figures

Figure 1
Figure 1
Association between miR-15b Expression and Prognosis after Chemo-/Radiotherapy (A) qRT-PCR results in cohort 1: (a) Kaplan-Meier analysis of the correlation between miR-15b expression levels and OS; (b) association between miR-15b expression and chemotherapy outcome in patients with TNM stage I–III CRC. (B) Expression of miR-15b in colorectal epithelial cells using ISH analysis. The positive staining of epithelium cells was expressed as blue-violet, and the representative results are shown. (a) Expression in most normal colorectal mucosa; (b) negative expression in some CRC tissues; (c) weak positive (+); (d) strong positive (2+); (e) the nuclear expression of U6 (positive control); (f) scrambled oligonucleotide probe (negative control). Scale bars, 300 μm (left), 200 μm (right). (g) Kaplan-Meier analysis of the correlation between miR-15b expression levels and OS in cohort 2 group. (h) Kaplan-Meier analysis in TNM stage I–III CRC with chemotherapy. (C) Expression of miR-15b in pre and post-nRT rectal cancer tissue samples and therapeutic outcomes from neoadjuvant radiotherapy. (a) Association between miR-15b expression in pretreatment biopsy tissue samples and TRG in 92 LARC patients after nRT as determined by qRT-PCR. (b and c) Kaplan-Meier analysis of post-nRT rectal patients in cohort 3. In (A, a and b), the patients were divided into two groups according to the median expression value. Below the median value was defined as low expression, above the median value was defined as high expression. In (B, g and h), and (C, b and c), miR-15b positive expression was defined as high expression; miR-15b negative expression was defined as low expression. p ≤ 0.05 was considered statistically significant. See also Figures S1 and S2.
Figure 2
Figure 2
Expression of miR-15b Enhances In Vitro Chemo-/Radiosensitivity of CRC Cells (A) The clonogenic survival of miR-15b-overexpressing CRC cells after irradiation with 2–8 Gy was compared with control cells. (a) Representative photographs of clonogenic assays. Colony formation assay of lovo versus lovo/miR-15b (b), HCT116 vs HCT116/miR-15b (c), HCT8 versus HCT8-48Gy (d), HCT8-48Gy vs HCT8-48Gy/miR-15b (e). The radiation survival curves indicate the mean inactivation dose of CRC cells. Radiation enhancement (ER) was calculated as the ratio of the mean inactivation dose for miR-15b-overexpressing cells to control cells (ER = 1). Data are from the mean of three independent experiments ± SE. (B) miR-15b expression in HCT8, HCT8-5fu, and HCT8-48Gy cell lines. Data are from the mean of three independent experiments ± SE. (C) The IC50 of 5-FU in control or miR-15b-overexpressing CRC cells, LS174t (a), lovo (b), HCT8-5fu (c), HCT116 (d). Data are from the mean of three independent experiments ± SE. See also Figure S3.
Figure 3
Figure 3
DCLK1 Is Target of miR-15b and Negatively Correlated with Prognosis of CRC Treated with Chemo-/Radiotherapy (A) (a) Schematic illustration of the predicted miR-15b-binding sites in DCLK1 3′-UTR; (b) luciferase reporter assay shows miR-15b inhibited the wild-type rather than the mutant, and 3′-UTRs of DCLK1 reporter activities strongly. The data represent the mean ± SD of three independent experiments with quadruplicate samples. Student's t test, p < 0.01 versus control (wild-type 3′ -UTR reporter vector + miR scramble) or mutant 3′-UTR reporter group (mutant 3′-UTR reporter + miR-15b mimics/miR scramble); (c) western blot results show the proteins of DCLK1 in lovo cells following lenti-pre-15b infection. Data refer to a representative experiment out of three, which gave similar results. (d) DCLK1 mRNA levels were suppressed in overexpressing miR-15b lovo cells; Data are from the mean of three independent experiments ± SE. (e) The inverse correlation of miR-15b against DCLK1 mRNA expression was determined in indicated cells. (f and g) The significant reverse correlation between miR-15b expression and DCLK1 mRNA levels in CRC samples (122 cases from cohort 1 and 64 cases from TCGA database, using two-tailed Pearson's test). (B) Expression patterns of DCLK1 RNAscope in tissue microarrays of cohort 2. The expression of DCLK1 mRNA in adjacent non-malignant mucosa (a), and CRC tissues with negative (b), low (c), moderate (d), and high (e) DCLK1 mRNA expression. Positive cells are stained brown. Scale bars, 300 μm (up), 200 μm (below). (f–i) Kaplan-Meier analysis of the correlation between DCLK1 expression and tumor recurrence or chemotherapy outcome in patients with CRC in cohort 2. (C) DCLK1 expression in paired specimens obtained pre and after neoadjuvant radiotherapy by fluorescence immunohistochemistry (a, scale bars, 50 μm) or qRT-PCR (b, Wilcoxon matched pairs test). (c) Association between DCLK1 expression in pretreatment biopsy tissue samples and TRG in 92 LARC patients (from cohort 3) who received nRT by qRT-PCR, Mann-Whitney test. (d) Kaplan-Meier analysis of the correlation between DCLK1 expression in post-nRT rectal cancer and tumor recurrence in 70 LARC patients (cohort 4). In (B, f, g, h, and i), DCLK1 positive expression was defined as high expression; DCLK1 negative expression was defined as low expression. In (C, d), the patients were divided into two groups according to the median expression value. p ≤ 0.05 was considered statistically significant. See also Figure S5.
Figure 4
Figure 4
DCLK1 Expression Drives the TIC Phenotype and Chemo-/Radiotherapy Resistance (A) (a) Phase contrast micrographs demonstrate that FACS-sorted DCLK1+ HCT116 cells can form primary (first) and serially passaged (second) spheroids easily. Data refer to a representative experiment out of three, which gave similar results. Scale bars, 50 μm. (b) Histograms show different spheroid formation efficiency of the DCLK1+ cells and DCLK1− cells from indicated sources. Bars are the mean ± SD of three independent experiments (n = 5). Student's t test. (c) Photograph showing tumor formation in NOD SCID mice (red arrow, tumor growth of DCLK1+ cell population; black arrow, no tumor growth of DCLK1− cells). (d) The dissected tumors formed with sorted DCLK1+ HCT116 cells. Five mice/group were transplanted. (e) Tumor formation of serial transplantation assay of DCLK1+ and DCLK1− subpopulations in NOD SCID mice. (B) (a) The clonogenic survival of DCLK1+ and DCLK1− cells sorted from HCT116 and lovo cells. Data refer to a representative experiment out of three, which gave similar results. (b–d) The IC50 of 5-FU in DCLK1+ and DCLK1− cells sorted from HCT116, lovo, and case1 cells. Data are from the mean of three independent experiments ± SE. (C) Flow cytometry measured the frequencies of DCLK1+ cells in HCT116 (a) and lovo (c) cells after 4 Gy irradiation. The frequencies of DCLK1+ cells in 5-FU/radioresistant HCT8 cells (b). Data refer to a representative experiment out of three, which gave similar results. qRT-PCR assayed the expression of DCLK1 mRNA in HCT8 and 5-FU/radioresistant HCT8 (d). Data are from the mean of three independent experiments ± SE. (D) Tumorigenic cell frequency in each fraction of HCT116 cells was determined with limiting dilution assay in NOD SCID mice. p ≤ 0.05 was considered statistically significant. See also Figure S4.
Figure 5
Figure 5
Expression of miR-15b Reverses Self-Renewal, Tumorigenicity and Chemo-/Radioresistance in DCLK1+ CRC TICs (A–C) (A) The expression of miR-15b in DCLK1+ and DCLK1− cells were detected using qRT-PCR. Data are from the mean of three independent experiments ± SE. FACS-sorted DCLK1+/− fractions were incubated with pre-miR-15b/ZIP-miR-15b lentiviruses for 2 hr. Some were plated in 96-well plates at 100 cells/well (n = 5) to assay their spheroid formation efficiency and subsequent expansion ability (B, a–b), Scale bars, 50 μm. Data are from the mean of three independent experiments ± SE. Student's t test, p ≤ 0.05 was considered statistically significant. The others were transplanted into NOD SCID mice (n = 5) to test their tumorigenicity and subsequent expansion ability (C, a–c). (D) (a) The clonogenic survival of DCLK1+ and miR-15b overexpressing DCLK1+ HCT116 cells. (b–d) The IC50 of 5-FU in DCLK1+ and miR-15b overexpressing DCLK1+ HCT116, lovo, and case1 cells. Data are from the mean of three independent experiments ± SE. (E) (a) DCLK1 associated with the BMI signaling pathway in the GSEA of TCGA CRC dataset. (b and c) Pearson correlation analysis of 53 CRC cases (expression levels of miR-15b and BMI1) and 95 CRC cases (expression levels of DCLK1 and BMI1) both from TCGA database. p ≤ 0.05 was considered statistically significant. (F) (a) Western blot analysis of DCLK1 and BMI1 expression in DCLK1+ cells from lovo and HCT116 cells after overexpressing miR-15b. (b) DCLK1 and BMI1 expression in lovo and HCT116 cells after overexpressing DCLK1. (c) MYC and BMI1 expression in HCT116 c-MYC-knockdown cells. (d) BMI1 expression in DCLK1 overexpressing HCT116 cells after MYC knockdown. Data refer to a representative experiment out of three, which gave similar results. See also Figure S5.

Similar articles

Cited by

References

    1. Aklilu M., Eng C. The current landscape of locally advanced rectal cancer. Nat. Rev. Clin. Oncol. 2011;8:649–659. - PubMed
    1. Aslam M.I., Venkatesh J., Jameson J.S., West K., Pringle J.H., Singh B. Identification of high-risk Dukes B colorectal cancer by microRNA expression profiling: a preliminary study. Colorectal Dis. 2015;17:578–588. - PubMed
    1. Asuthkar S., Velpula K.K., Chetty C., Gorantla B., Rao J.S. Epigenetic regulation of miRNA-211 by MMP-9 governs glioma cell apoptosis, chemosensitivity and radiosensitivity. Oncotarget. 2012;3:1439–1454. - PMC - PubMed
    1. Avoranta S.T., Korkeila E.A., Ristamaki R.H., Syrjanen K.J., Carpen O.M., Pyrhonen S.O., Sundstrom J.T. ALDH1 expression indicates chemotherapy resistance and poor outcome in node-negative rectal cancer. Hum. Pathol. 2013;44:966–974. - PubMed
    1. Bitarte N., Bandres E., Boni V., Zarate R., Rodriguez J., Gonzalez-Huarriz M., Lopez I., Javier Sola J., Alonso M.M., Fortes P. MicroRNA-451 is involved in the self-renewal, tumorigenicity, and chemoresistance of colorectal cancer stem cells. Stem Cells. 2011;29:1661–1671. - PubMed

Publication types

MeSH terms