Comparative Study
. 2018 Dec 6;23(6):869-881.e8.
doi: 10.1016/j.stem.2018.10.010. Epub 2018 Nov 15.

Comparative Analysis and Refinement of Human PSC-Derived Kidney Organoid Differentiation with Single-Cell Transcriptomics

Affiliations
Comparative Study

Comparative Analysis and Refinement of Human PSC-Derived Kidney Organoid Differentiation with Single-Cell Transcriptomics

Haojia Wu et al. Cell Stem Cell. .

Abstract

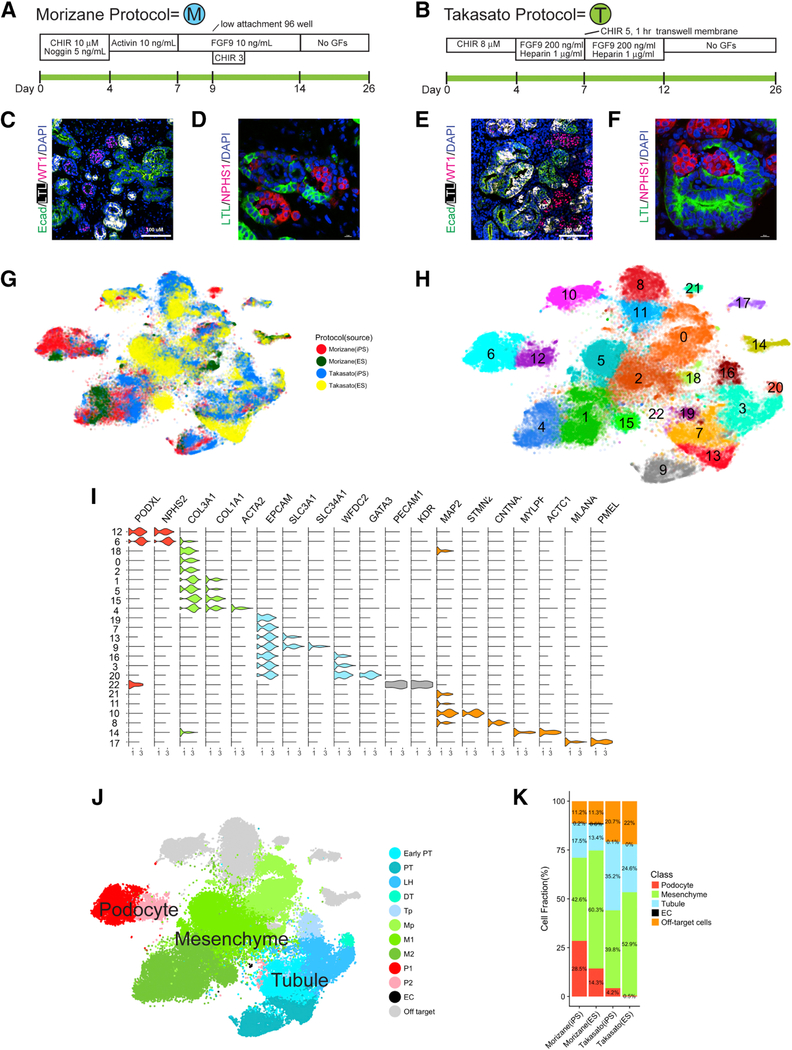
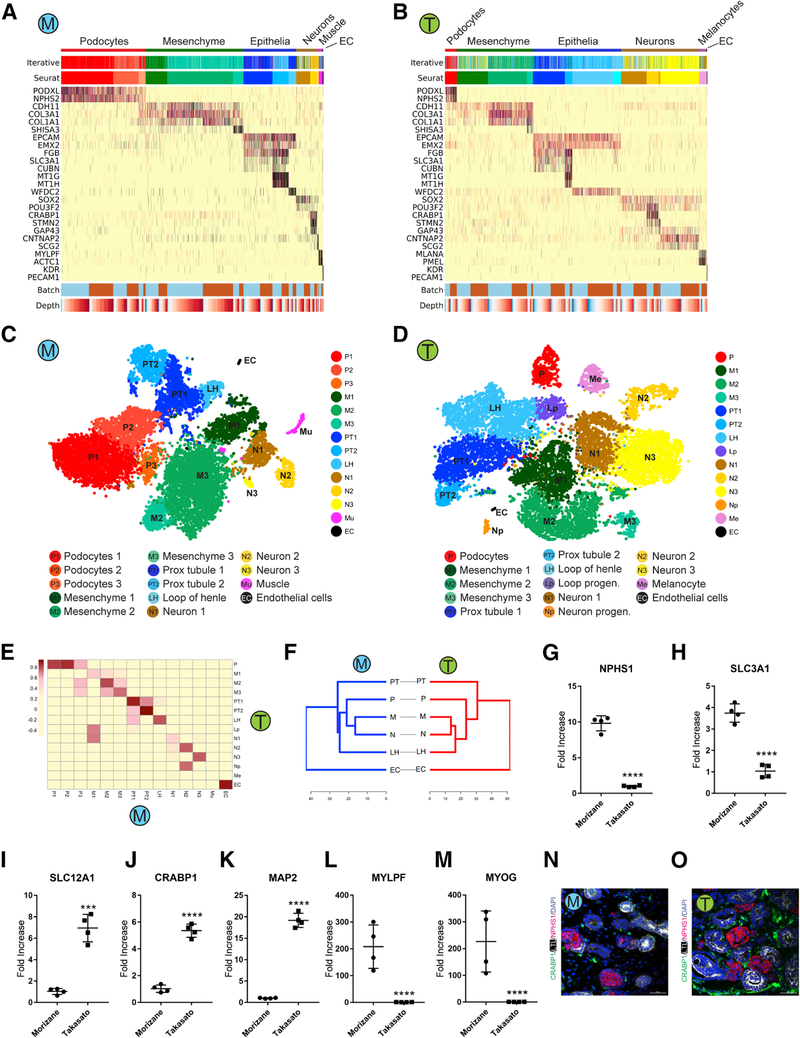
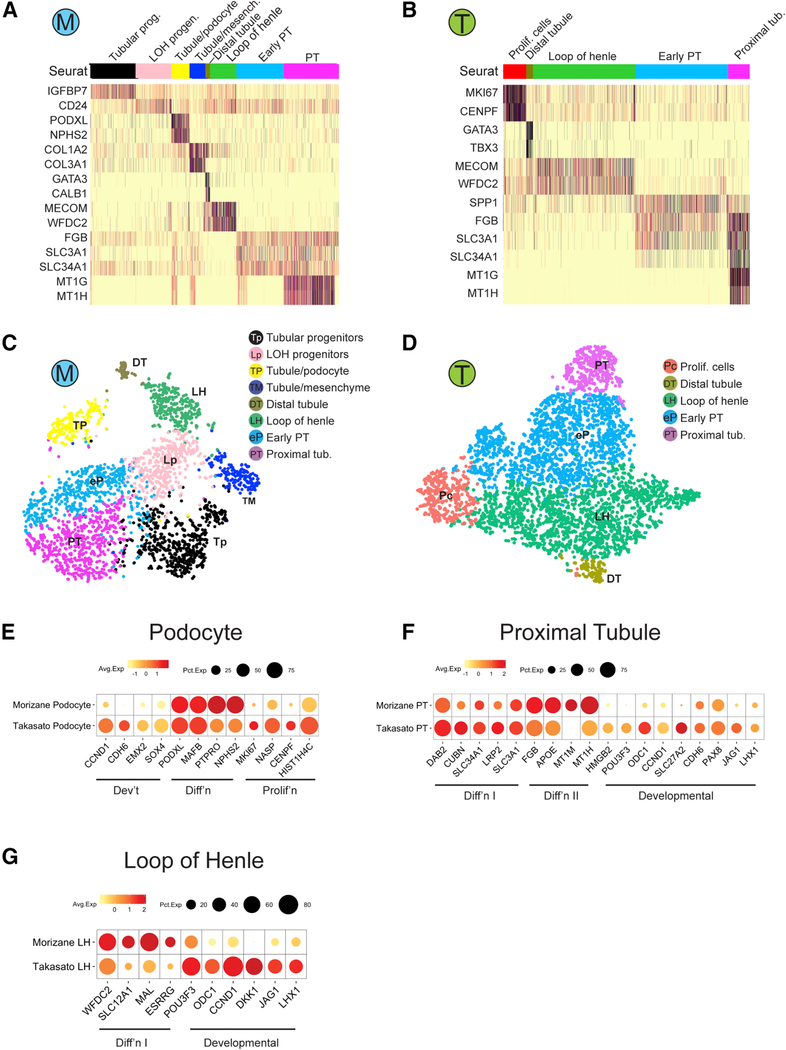
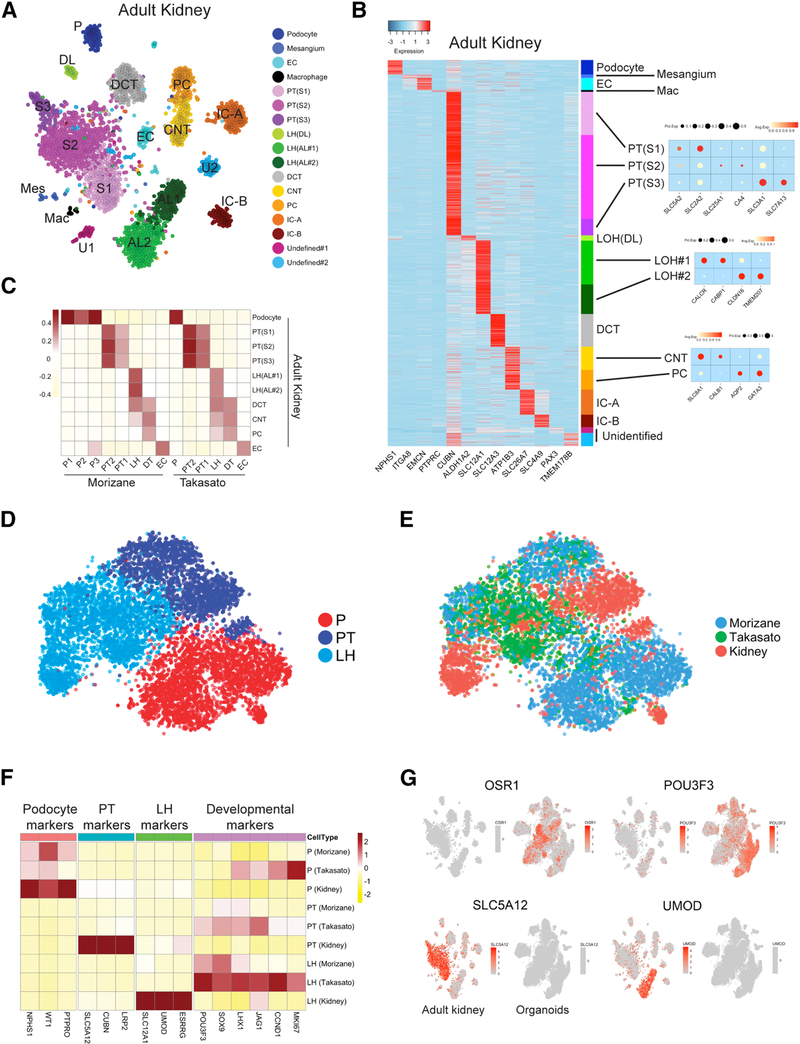
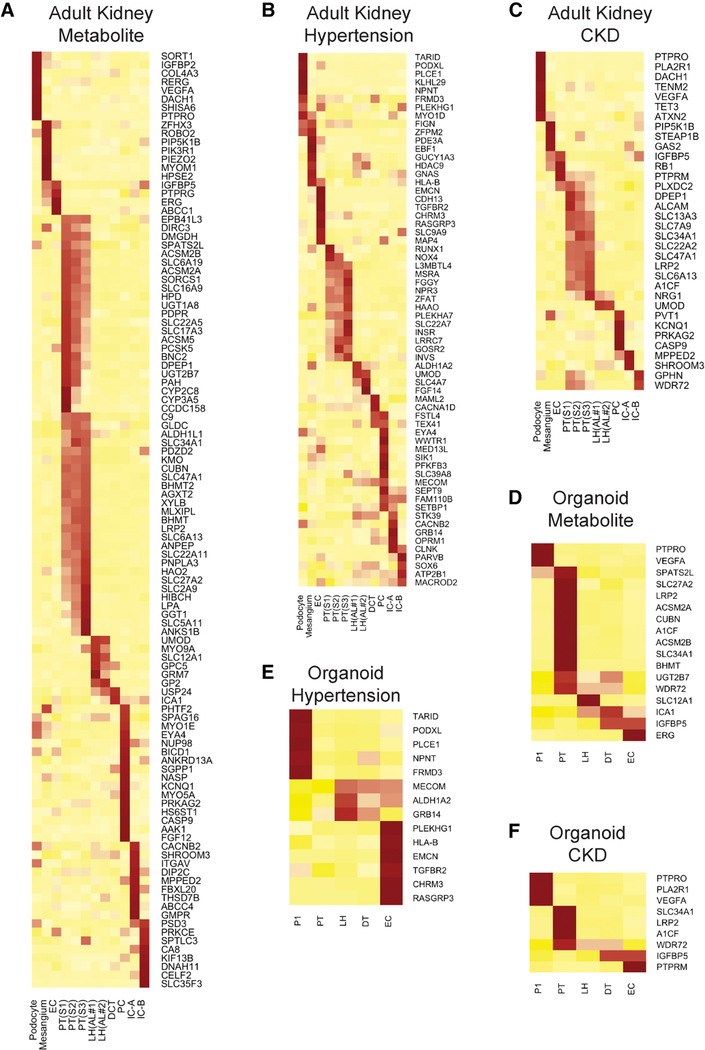
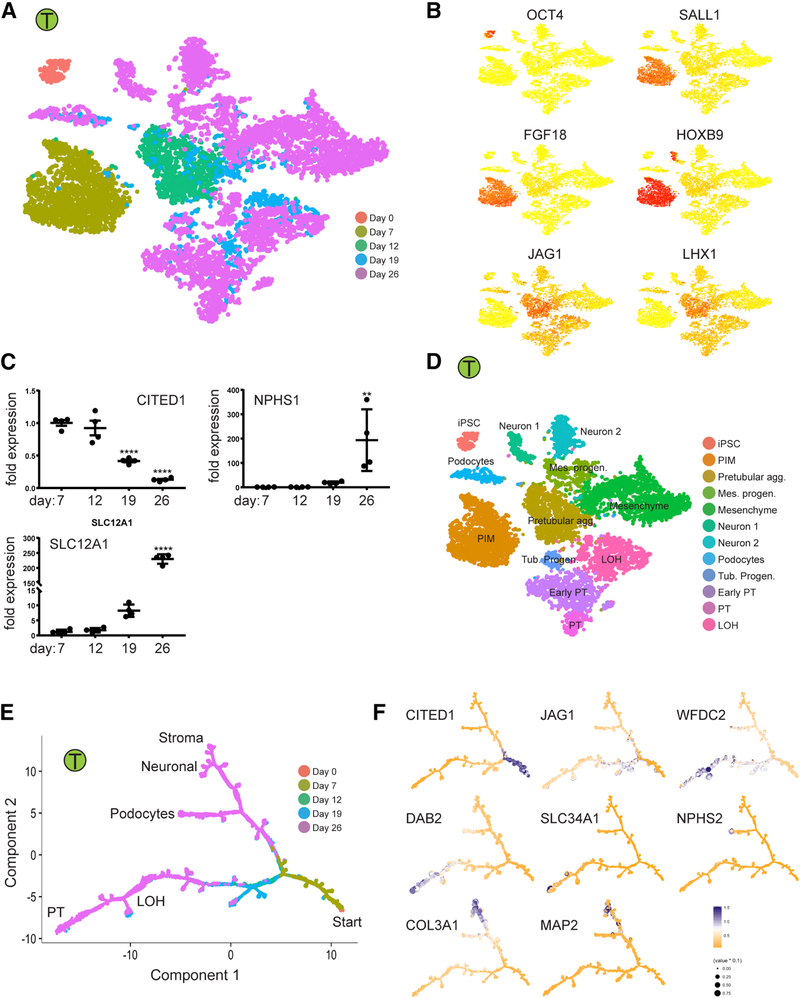
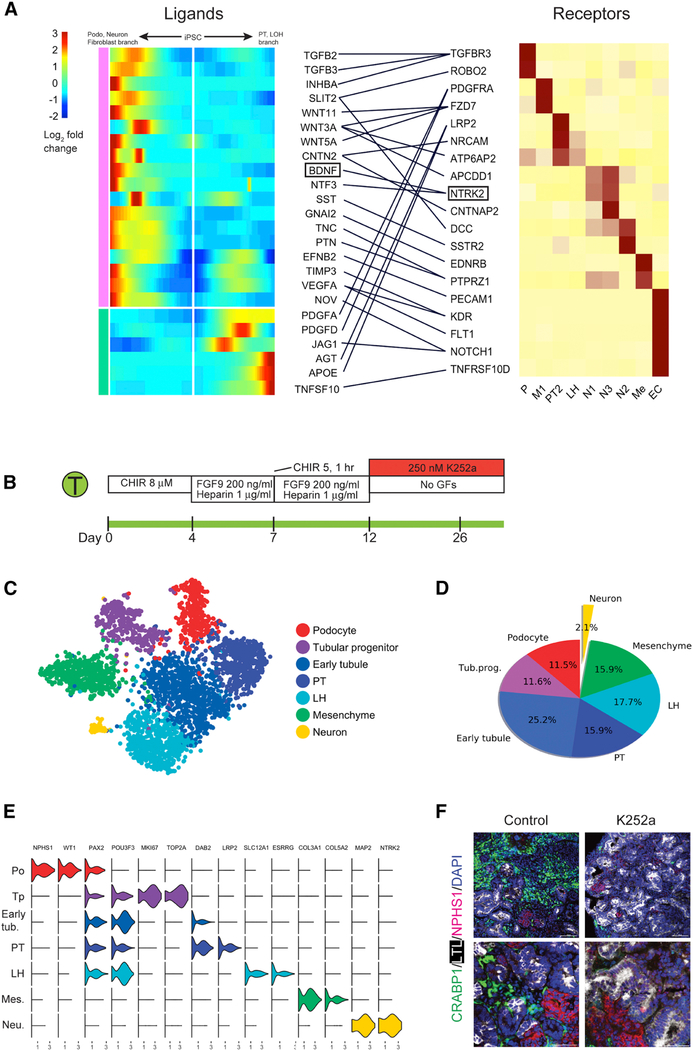
Kidney organoids derived from human pluripotent stem cells have great utility for investigating organogenesis and disease mechanisms and, potentially, as a replacement tissue source, but how closely organoids derived from current protocols replicate adult human kidney is undefined. We compared two directed differentiation protocols by single-cell transcriptomics of 83,130 cells from 65 organoids with single-cell transcriptomes of fetal and adult kidney cells. Both protocols generate a diverse range of kidney cells with differing ratios, but organoid-derived cell types are immature, and 10%-20% of cells are non-renal. Reconstructing lineage relationships by pseudotemporal ordering identified ligands, receptors, and transcription factor networks associated with fate decisions. Brain-derived neurotrophic factor (BDNF) and its cognate receptor NTRK2 were expressed in the neuronal lineage during organoid differentiation. Inhibiting this pathway improved organoid formation by reducing neurons by 90% without affecting kidney differentiation, highlighting the power of single-cell technologies to characterize and improve organoid differentiation.

Keywords: BDNF signaling; Dropseq; human kidney; induced pluripotent stem cells; kidney organoid; off-target cells; single cell RNA-seq; stem cell differentiation.


Conflict of interest statement

Declaration of Interests

The authors declare no competing interests.

Figures

Figure 1:
Figure 1:. Comprehensive single-cell RNA sequencing demonstrates development of a spectrum of cell types in kidney organoids
(A,B) Diagram of human iPS directed differentiation protocols. (C-F) Immunofluorescence analysis of day 26 organoid for proximal tubule (LTL), distal tubule (ECAD), and podocytes (WT1 and NPHS1) from Morizane protocol (C,D) and Takasato protocol, scale bar, 50 μm. (E,F). (G) tSNE projection of all day 26 organoid cells according to protocol (Morizane or Takasato) and cell line (iPS or ES). (H) Unsupervised clustering of all organoid cells reveals 23 separate clusters. (I) Violin plot showing cluster-specific expression of marker genes. (J) Major kidney cell populations depicted after semi-supervised analysis. (K) Proportions of kidney and off-target cell types according to protocol and cell source.
Figure 2:
Figure 2:. Comparison of kidney cell types and differentiation state in iPS-derived kidney organoids generated with both protocols.
(A,B) Heatmap of all cells clustered by recursive hierarchical clustering and Louvain-Jaccard clustering (Seurat), showing selected marker genes for every population of Morizane protocol (A) and Takasato protocol (B). The bottom bars indicate the batch of origin (“Batch”) and number of UMI detected/cell (“Depth”). (C,D) tSNE plot of cells based on the expression of highly variable genes for the day 26 organoids from Morizane protocol (C) and Takasato protocol (D). The detected clusters are indicated by different colors. (E) Heatmap indicating Pearson’s correlations on the averaged profiles among common cell types for Morizane and Takasato organoids. (F) Dendrogram showing relationships among the cell types in Morizane (left) and Takasato organoid (right). The dendrogram was computed using hierarchical clustering with average linkage on the normalized expression value of the highly variable genes. (G-M) Quantitative PCR comparing cell marker expression for podocyte (NPHS1), PT (SLC3A1), LOH (SLC12A1), neuron (CRABP1 and MAP2), and muscle (MYLPF and MYOG) between organoid protocols. ***p<0.001 and ****p<0.0001. (N,O) Immunofluorescence analysis of neural marker CRABP1 expression (green) in Morizane (N) and Takasato (O) protocols. Cells were co-stained with PT (LTL, white) and podocyte (NPHS1, red) markers. Scale bar, 50 μm.
Figure 3:
Figure 3:. Human kidney organoids contain subclasses of tubular epithelial cells.
(A,B) Heatmap showing selected marker genes for every tubular subpopulation of Morizane protocol (A) and Takasato protocol (B) generated from iPS cells. (C,D) tSNE plot of tubular subclusters in kidney organoid from Morizane protocol (C) and Takasato protocol (D). The detected clusters are indicated by different colors. (E-G) Dotplot comparing the expression of cell type signature and developmental/proliferating genes on podocytes (E), proximal tubule (F), and LOH (G) between the two protocols.
Figure 4:
Figure 4:. Organoid cell types are immature compared to benchmarked adult kidney cell types.
(A) Unsupervised clustering of snRNA-seq of adult human kidney identified 17 distinct cell types in human adult kidney. That includes 11 tubular cell types, podocytes, mesangium, endothelial cells and macrophages. (B) Heatmap showing uniquely expressed genes for each cluster. (C) Pearson correlation analysis comparing the organoid cell types and their endogenous counterparts in human kidney. Color bar indicates the correlation score. (D) Reclustering of podocytes, proximal tubule (S1-S2) and loop of henle cells derived from both organoids and adult kidney, analyzed using canonical component analysis. (E) Cellular origins (Morizane, Takasato or adult kidney) visualized in the tSNE reveal poor overlap between organoid-derived and adult-derived cells within in each cluster. (F) Comparison of the average expression of marker genes and developmental genes between organoid cell types and adult kidney cell types. Expression value was scaled by z-score. (G) Expression of developmental factors OSR1 and POU3F3 is strong in organoids but almost undetectable in adult kidney. Expression of S1 marker SLC5A12 and loop of henle marker UMOD is strong in adult kidney and undetectable in organoids.
Figure 5:
Figure 5:. Cell specific expression of disease-relevant genes in adult kidney compared to organoids.
Cell specific expression of genes reported in CKD related GWAS (A), hypertension related GWAS (B), and plasma metabolite levels related GWAS (C) in adult kidney. Each gene reported in a kidney disease related GWAS was assigned to the adult kidney cell type in which it was found to be differentially expressed (likelihood ratio test). Heatmap was used to visualize the z-score normalized average gene expression of the candidate genes for each cell cluster. (D-F) Disease relevant genes identified in (A-C) for which cell-specific expression could also be detected in organoid cell types. Results from both protocols and both cell sources were pooled for the analysis.
Figure 6:
Figure 6:. Time-course analysis of cells during organoid differentiation reveals lineage relationships
(A,B) Projecting cells across time-points to the tSNE. Cells were colored by the time point where they were collected (A) or gene expression of stage specific markers (B). (C) Validation of the stage specific marker by qPCR. **p<0.01 and ****p<0.001 versus day 7. (D) Annotation of cell clusters based on gene expression of cell type specific markers. (E,F) Ordering of scRNA-seq expression data according to the pseudotemporal position along the lineage revealed a continuum of gene expression changes from iPSCs to differentiated cell types.
Figure 7:
Figure 7:. Reduction in off-target cell differentiation by analysis of cell-specific expression of receptors and ligands during organoid differentiation.
(A) Heat map showing kinetics of branch-dependent ligand expression identified by BEAM (Monocle2) and corresponding cell-specific receptor expression in day 26 organoids from the Takasato protocol. The analysis identified that BDNF expression was induced in the podocyte/mesenchyme/neuron branch and its receptor NTRK2 was exclusively expressed in neurons. (B) Inhibition of the BDNF pathway using K252a (250 nM from days 12 to 26). (C) tSNE of K252a treated organoids showing very small neuronal population. (D) Off target cells made up only 2.1% of the total cells in K252a-treated organoids. (E) Violin plot showing marker gene expression across clusters in K252a-treated organoids. (F) verification of strong reduction in neuronal cells by immunofluorescence staining of an independent organoid batch.

Comment in

References

    1. Adam M, Potter AS, and Potter SS (2017). Psychrophilic proteases dramatically reduce single-cell RNA-seq artifacts: a molecular atlas of kidney development. Development 144, 3625–3632. - PMC - PubMed
    1. Bahar Halpern K., Caspi I, Lemze D, Levy M, Landen S, Elinav E, Ulitsky I, and Itzkovitz S (2015). Nuclear Retention of mRNA in Mammalian Tissues. Cell reports 13, 2653–2662. - PMC - PubMed
    1. Baron M, Veres A, Wolock SL, Faust AL, Gaujoux R, Vetere A, Ryu JH, Wagner BK, Shen-Orr SS, Klein AM, et al. (2016). A Single-Cell Transcriptomic Map of the Human and Mouse Pancreas Reveals Inter- and Intra-cell Population Structure. Cell Syst 3, 346–360 e344. - PMC - PubMed
    1. Barthelson RA, Lambert GM, Vanier C, Lynch RM, and Galbraith DW (2007). Comparison of the contributions of the nuclear and cytoplasmic compartments to global gene expression in human cells. BMC Genomics 8, 340. - PMC - PubMed
    1. Bindels RJ, Hartog A, Timmermans JA, and van Os CH (1991). Immunocytochemical localization of calbindin-D28k, calbindin-D9k and parvalbumin in rat kidney. Contrib Nephrol 91, 7–13. - PubMed

Publication types