

Sensitivity of treatment recommendations to bias in network meta-analysis
- PMID: 30449954
- PMCID: PMC6221150
- DOI: 10.1111/rssa.12341
Sensitivity of treatment recommendations to bias in network meta-analysis
Abstract
Network meta-analysis (NMA) pools evidence on multiple treatments to estimate relative treatment effects. Included studies are typically assessed for risk of bias; however, this provides no indication of the impact of potential bias on a decision based on the NMA. We propose methods to derive bias adjustment thresholds which measure the smallest changes to the data that result in a change of treatment decision. The methods use efficient matrix operations and can be applied to explore the consequences of bias in individual studies or aggregate treatment contrasts, in both fixed and random-effects NMA models. Complex models with multiple types of data input are handled by using an approximation to the hypothetical aggregate likelihood. The methods are illustrated with a simple NMA of thrombolytic treatments and a more complex example comparing social anxiety interventions. An accompanying R package is provided.
Keywords: Evidence synthesis; Influence matrix; Mixed treatment comparison; Quality of evidence; Risk of bias; Threshold analysis.
Figures

 ) for a data point y
m, for an NMA with five treatments and current optimal treatment : the new treatment decision at the negative and positive thresholds would be 2 and 3 respectively
) for a data point y
m, for an NMA with five treatments and current optimal treatment : the new treatment decision at the negative and positive thresholds would be 2 and 3 respectively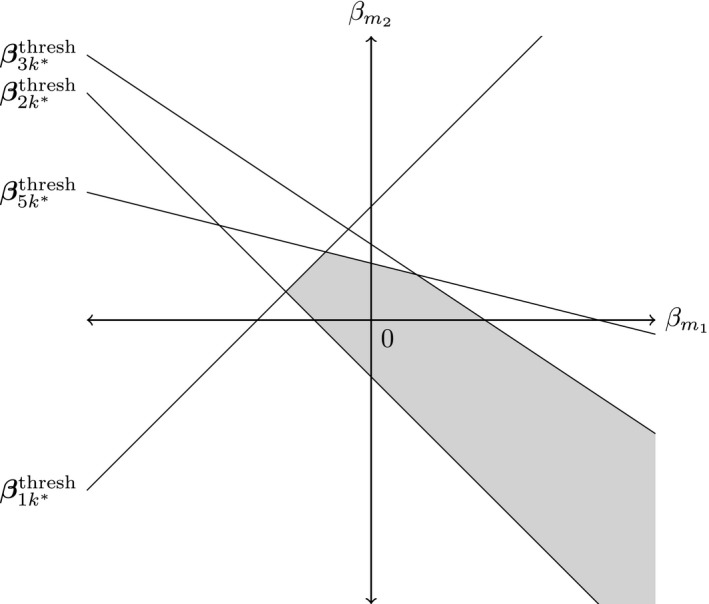
 , invariant region about the origin (no bias adjustment)): any simultaneous bias adjustment to data points and which remains within the invariant region does not change the optimal treatment; at the boundary of the invariant region formed by thresholds line the new optimal treatment is
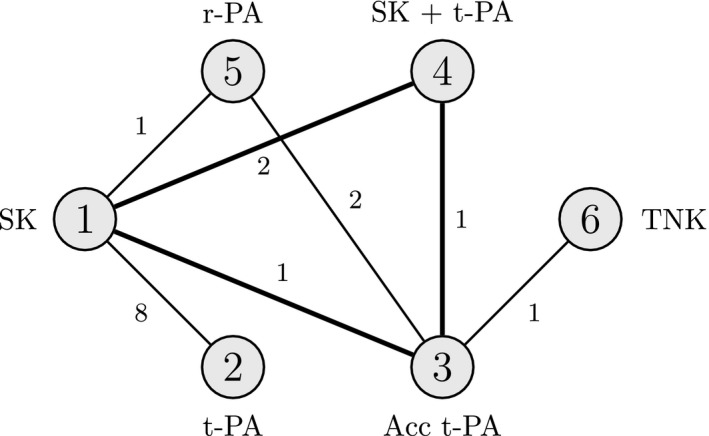
 , invariant interval
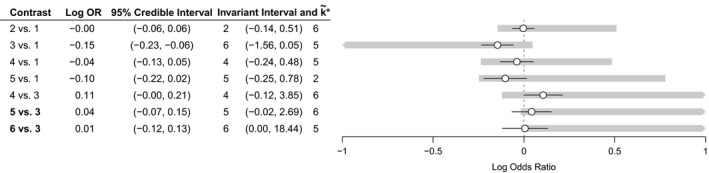
 , invariant interval
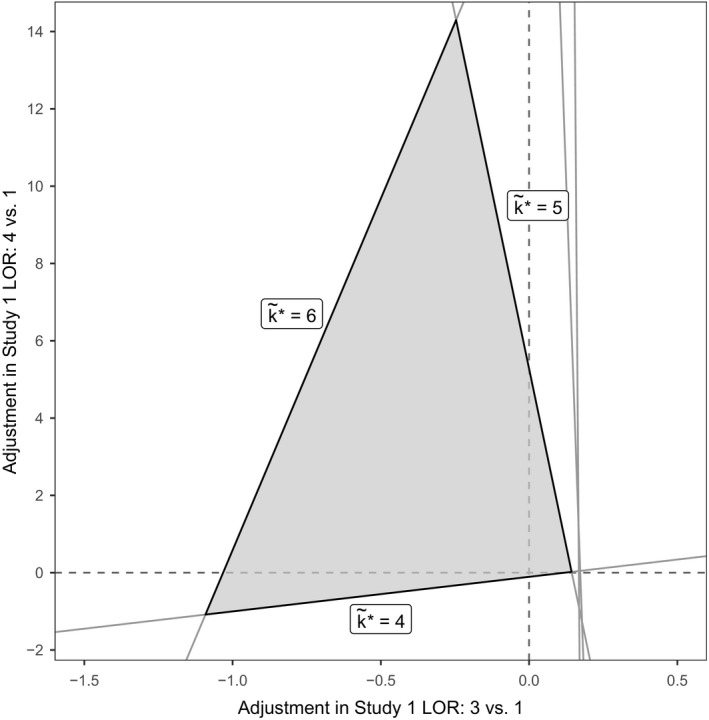
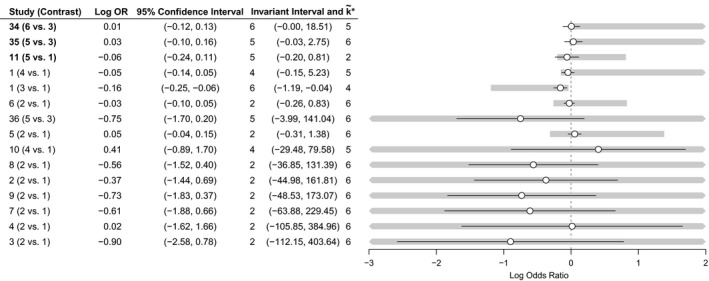
 , invariant region): the new optimal treatments on the boundary are indicated by ; optimal treatment without bias adjustment is k
*=3
, invariant region): the new optimal treatments on the boundary are indicated by ; optimal treatment without bias adjustment is k
*=3
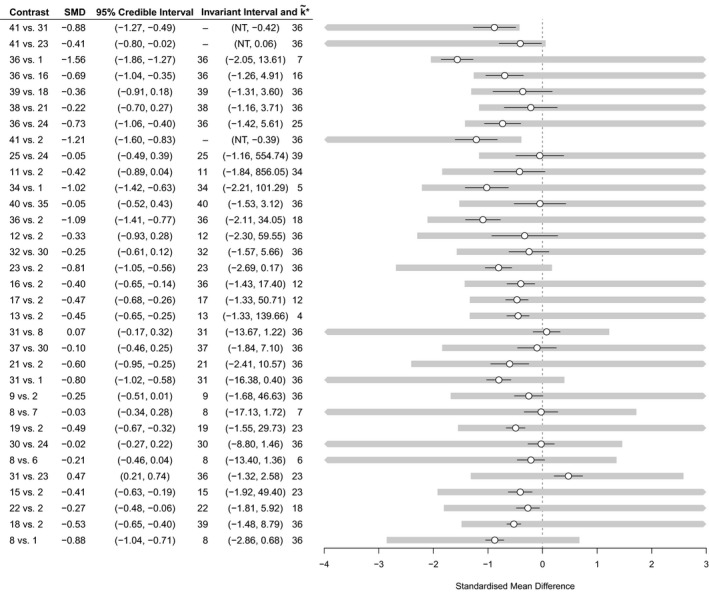
 , invariant interval
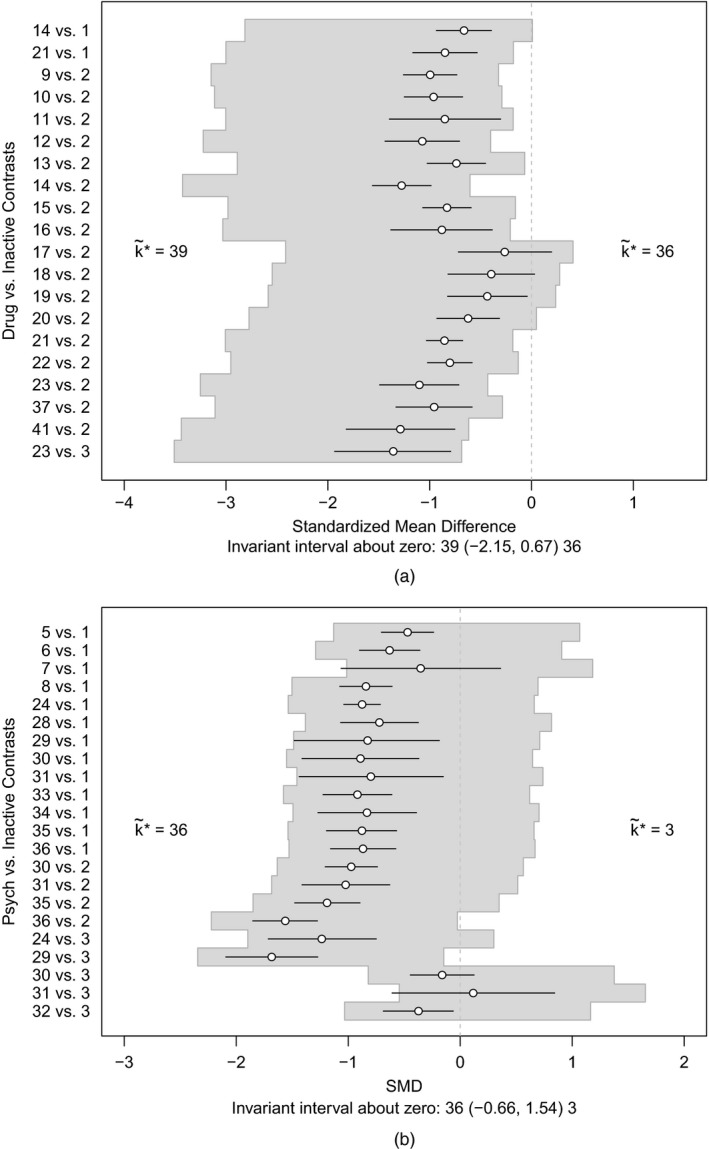
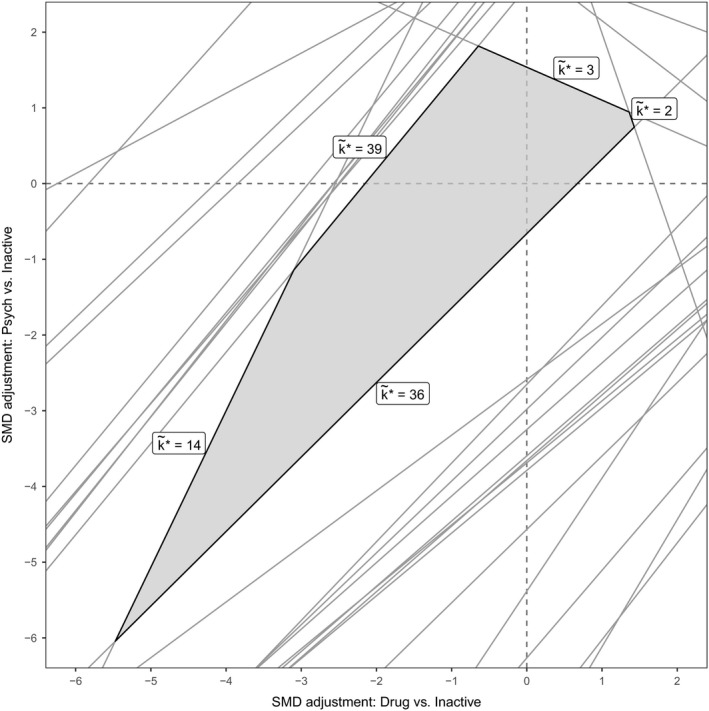
 ) for simultaneous adjustments for common biases in all psychological and all pharmacological treatments: the new treatment recommendation at the boundary is shown as ; the optimal treatment without bias adjustment is k
*=41
) for simultaneous adjustments for common biases in all psychological and all pharmacological treatments: the new treatment recommendation at the boundary is shown as ; the optimal treatment without bias adjustment is k
*=41References
-
- Bernstein, D. S. (2005) Matrix Mathematics: Theory, Facts, and Formulas with Application to Linear Systems Theory. Princeton: Princeton University Press.
-
- Boland, A. , Dundar, Y. , Bagust, A. , Haycox, A. , Hill, R. Mujica Mota, R. , Walley, T. and Dickson, R. (2003) Early thrombolysis for the treatment of acute myocardial infarction: a systematic review and economic evaluation. Hlth Technol. Assessmnt, 7, 1–136. - PubMed
-
- Cohen, J. (1988) Statistical Power Analysis for the Behavioral‐sciences , 2nd edn. Erlbaum.
Grants and funding
LinkOut - more resources
Full Text Sources