. 2018 Nov 2:9:2520.
doi: 10.3389/fimmu.2018.02520. eCollection 2018.

Both Type I and Type II Interferons Can Activate Antitumor M1 Macrophages When Combined With TLR Stimulation

Affiliations

Both Type I and Type II Interferons Can Activate Antitumor M1 Macrophages When Combined With TLR Stimulation

Elisabeth Müller et al. Front Immunol. .

Abstract

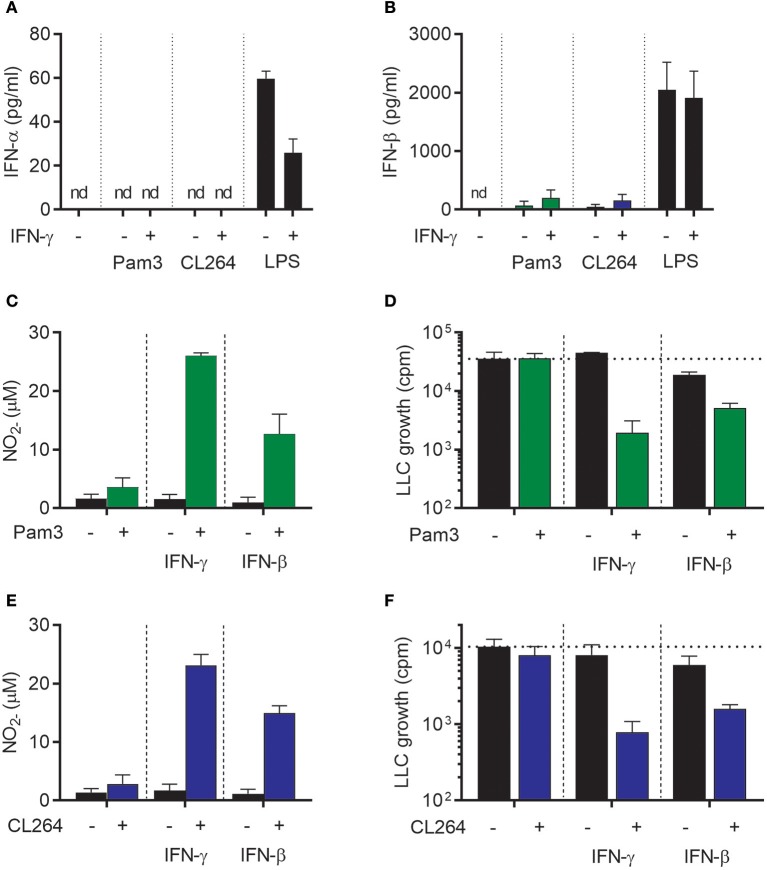
Triggering or enhancing antitumor activity of tumor-associated macrophages is an attractive strategy for cancer treatment. We have previously shown that the cytokine interferon-γ (IFN-γ), a type II IFN, could synergize with toll-like receptor (TLR) agonists for induction of antitumor M1 macrophages. However, the toxicity of IFN-γ limits its clinical use. Here, we investigated whether the less toxic type I IFNs, IFN-α, and IFN-β, could potentially replace IFN-γ for induction of antitumor M1 macrophages. We measured in vitro the ability of type I and II IFNs to synergize with TLR agonists for transcription of inducible nitric oxide synthase (iNOS) mRNA and secretion of nitric oxide (NO) by mouse bone marrow-derived macrophages (BMDMs). An in vitro growth inhibition assay was used to measure both cytotoxic and cytostatic activity of activated macrophages against Lewis lung carcinoma (LLC) cancer cells. We found that both type I and II IFNs could synergize with TLR agonists in inducing macrophage-mediated inhibition of cancer cell growth, which was dependent on NO. The ability of high dose lipopolysaccharide (LPS) to induce tumoricidal activity in macrophages in the absence of IFN-γ was shown to depend on induction of autocrine type I IFNs. Antitumor M1 macrophages could also be generated in the absence of IFN-γ by a combination of two TLR ligands when using the TLR3 agonist poly(I:C) which induces autocrine type I IFNs. Finally, we show that encapsulation of poly(I:C) into nanoparticles improved its potency to induce M1 macrophages up to 100-fold. This study reveals the potential of type I IFNs for activation of antitumor macrophages and indicates new avenues for cancer immunotherapy based on type I IFN signaling, including combination of TLR agonists.

Keywords: cancer; immunotherapy; interferon-α; interferon-β; interferon-γ; macrophages; nitric oxide; toll-like receptors.


Figures

Figure 1
Figure 1
LPS induces growth inhibitory capacity of macrophages and production of both NO and type I IFNs. (A) Timeline for the growth inhibition assay used to assess cytotoxic and cytostatic activity of BMDMs toward cancer cells. Mitomycin C-treated BMDMs were seeded out (6 × 10⁴ in 200 μL) and, after 24 h, stimulated with IFNs and/or TLR agonists. At 48 h, half of the cell culture supernatant (SN) was removed for analysis of nitric oxide (NO) and interferon (IFN)-α/β production, before LLC tumor cells (3 × 10³) were added to the BMDM cultures, resulting in a 20:1 BMDM effector to LLC target cell ratio. Control wells with LLC cancer cells alone, were treated correspondingly. At 72 h, radiolabeled [3H]thymidine was added to all wells, and at 90 h, cells were harvested. Growth of LLC cancer cells was measured by the incorporation of [3H]thymidine (counts per minute; cpm). (B) Growth inhibition of LLC cells co-cultured with BMDMs, which had been left untreated or stimulated with various concentrations of LPS for 24 h. Cultures of untreated LLC cells alone and mitomycin C-treated BMDMs alone were used as controls. (C) Inhibition of growth of LLC cells in co-cultures with BMDMs stimulated for 24 h with 40 ng/mL IFN-γ alone or 40 ng/mL IFN-γ in combination with various concentrations of LPS for 24 h. (D) Production of NO by the BMDMs plated for use in analysis of LLC growth inhibition presented in (B,C). The Griess assay was used to measure NO indirectly as nitrite (NO2-) in the supernatants of BMDMs. (E,F) Luminex technology was used to measure the levels of IFN-α (E) and IFN-β (F) in supernatants from BMDMs plated for analysis of LLC growth inhibition shown in (B,C). The BMDMs were stimulated 24 h with LPS alone or LPS together with IFN-γ. Data are presented as means ± SD of triplicate wells from one representative experiment out of three. nd, not detectable.
Figure 2
Figure 2
Role of autocrine type I IFNs for NO production and inhibitory activity of macrophages activated by LPS. (A) Levels of IFN-β in the supernatant of WT and IFN alpha/beta receptor 1 knockout (Ifnar1−/−) BMDMs left untreated or treated with 100 ng/mL LPS for 24 h. Data are presented as means ± SD of triplicate wells from a single experiment. (B) NO production, measured indirectly as nitrite (NO2-), by WT and Ifnar1−/− BMDMs (6 × 10⁴ in 200 μL) in response to stimulation for 24 h with 100 ng/mL LPS alone or in combination with 40 ng/mL IFN-γ. (C,D) Growth inhibition of LLC cells co-cultured with WT (C) or Ifnar1−/−(D) BMDMs, which were stimulated as described in (B). Data in (B–D) are presented as means ± SD of triplicate wells from one representative experiment out of three. (E) Direct effect of exogenous IFN-β on the growth of LLC cells. The proportion of viable cells after 48 h of treatment with different concentrations of IFN-β was determined using the CCK-8 viability assay. Untreated cells were used as control and the results are presented in percentage of the untreated control group. Pooled data from four independent experiments are presented as means ± SD. nd, not detectable.
Figure 3
Figure 3
IFN-β synergizes with TLR agonists for activation of antitumor M1 macrophages in a similar fashion as IFN-γ. (A,B) Luminex analysis of the levels of IFN-α (A) and IFN-β (B) produced by BMDMs (6 × 10⁴ in 200 μL) left untreated or stimulated with 100 ng/mL Pam3CSK4, 1 μg/mL CL264, or 1 μg/mL LPS for 24 h in the presence or absence of 40 ng/mL IFN-γ. Note that the results were obtained from the same experiments as the results presented in Figures 1E,F and therefore show the same data for stimulation with 1 μg/ml LPS, which represents the positive control in (A,B). (C) NO production, measured indirectly as nitrite (NO2-), by BMDMs stimulated for 24 h with 100 ng/mL Pam3CSK4, 40 ng/mL IFN-γ, 40 ng/mL IFN-β or the indicated combinations. (D) Inhibition of LLC cell growth in BMDM-LLC co-cultures. BMDMs were stimulated as described in (C) before addition of LLC cells. (E) NO production by BMDMs treated for 24 h with 1 μg/mL CL264, 40 ng/mL IFN-γ, 40 ng/mL IFN-β or the indicated combinations. (F) Growth inhibition of LLC cells in co-cultures with BMDMs. The BMDMs were stimulated as described in (E) before addition of LLC cells. Data are presented as means ± SD of triplicate wells from one representative experiment out of three. nd, not detectable; Pam3, Pam3CSK4.
Figure 4
Figure 4
Both IFN-α and IFN-β synergize with Pam3CSK4 in inducing NO production by BMDMs and inhibition of tumor cell growth. (A) NO production, measured indirectly as nitrite (NO2-), by BMDMs (6 × 10⁴ in 200 μL) stimulated for 24 h with the indicated concentrations of IFN-γ in the absence or presence of 100 ng/mL Pam3CSK4. (B) BMDMs were stimulated as described in (A) before LLC cells (3 × 10³) were added to measure inhibition of LLC cell growth in co-cultures. (C) NO production by BMDMs stimulated with the indicated concentrations of IFN-β in the absence or presence of 100 ng/mL Pam3CSK4 for 24 h. (D) Inhibition of LLC cell growth in co-cultures with BMDMs stimulated as described in (C). (E) NO production by BMDMs stimulated with the indicated concentrations of IFN-α in the absence or presence of 100 ng/mL Pam3CSK4 for 24 h. (F) Inhibition of LLC cell growth in co-cultures with BMDMs stimulated as described in (E). In (C–F) 40 ng/mL IFN-γ was used as positive control. Data are presented as means ± SD of triplicate wells from one representative experiment out of three (A-F). Pam3, Pam3CSK4.
Figure 5
Figure 5
NO is required for macrophage-mediated growth inhibition of LLC cells induced by Pam3CSK4 in combination with both type I and type II IFNs. (A,B) BMDMs (6 × 10⁴ in 200 μL) were left untreated or activated for 24 h with Pam3CSK4 (100 ng/mL) and the indicated IFNs (40 ng/mL IFN-γ, 40 ng/mL IFN-β, or 100 ng/mL IFN-α) in the presence or absence of 50 μM of the iNOS inhibitor 1400 w. (A) NO production was measured indirectly as nitrite (NO2-) in the supernatant of untreated or activated BMDMs, and (B) inhibition of LLC growth in co-cultures of untreated or activated BMDMs was measured by thymidine incorporation. Data are presented as means ± SD of triplicate wells from one representative experiment out of two. Pam3, Pam3CSK4.
Figure 6
Figure 6
Poly(I:C) synergizes with Pam3CSK4 for activation of antitumor M1 macrophages through induction of type I IFNs. (A,B) Production of IFN-α (A) and IFN-β (B) by BMDMs (6 × 10⁴ in 200 μL) left untreated, activated with 1 μg/mL LPS or 100 μg/mL poly(I:C) for 24 h. (C) Production of NO by untreated BMDMs or BMDMs stimulated for 24 h with 100 ng/mL Pam3CSK4 in combination with 40 ng/mL IFN-γ, 100 μg/mL poly(I:C) alone or 100 μg/mL poly(I:C) in combination with 100 ng/mL Pam3CSK4. (D) Inhibition of growth of LLC cells (3 × 10³ per well) co-cultured with BMDMs (6 × 10⁴), which were stimulated as described in (C). (E) NO production by WT and Ifnar1−/− BMDMs in response to co-stimulation with Pam3CSK4/IFN-γ or Pam3CSK4/poly(I:C) for 24 h. (F) Growth inhibition of LLC cells co-cultured with WT or Ifnar1−/− BMDMs treated as described in (E). Data in (A–F) are presented as the means ± SD of triplicate wells from one representative experiment out of three. nd, not detectable; Pam3, Pam3CSK4.
Figure 7
Figure 7
Both type I and II IFNs synergize with TLR agonists for induction of Nos2 gene expression. BMDMs (4.5 × 10⁵) were stimulated for 24 h. Total RNA was reverse transcribed into cDNA and analyzed by RT-qPCR using primers specific for mouse Nos2 mRNA. (A) Nos2 expression in BMDMs treated with IFN-γ (40 ng/mL), or LPS at the indicated concentrations, or a combination of both. (B) Nos2 expression in BMDMs treated with IFN-γ (40 ng/mL), IFN-β (40 ng/mL), poly(I:C) (100 μg/mL), Pam3CSK4 (100 ng/mL), or the indicated combinations. Data are presented as means (ΔCt) of duplicates for each of the three independent experiments. Each circle in the graphs represents the mean value from one experiment. P-values from a two-way ANOVA multiple comparison test is displayed as follows: *p < 0.05, ***p < 0.001; ns, not significant; Pam3, Pam3CSK4.
Figure 8
Figure 8
Encapsulation of poly(I:C) into nanoparticles (poly(I:C)-NPs) potentiates the synergy of combined stimulation with Pam3CSK4 and poly(I:C) in the induction of antitumor BMDMs. (A) Production of IFN-β by BMDMs (6 × 10⁴ in 200 μL) stimulated with the indicated concentrations of poly(I:C) either in soluble form or encapsulated in nanoparticles (poly(I:C)-NPs) for 24 h. (B) Growth inhibition of LLC-cells (3 × 10³) in co-culture with BMDMs (6 × 10⁴), stimulated for 24 h with the indicated concentrations of either soluble poly(I:C) or poly(I:C)-NPs. (C) Production of NO by BMDMs (6 × 10⁴) treated for 24 h with the indicated concentrations of either soluble poly(I:C) or poly(I:C)-NPs alone or in combination with 100 ng/mL Pam3CSK4. (D) Growth inhibition of LLC cells in co-culture with BMDMs, stimulated as described in (C). Data represent the means ± SD of triplicate wells of one representative experiment out of two. nd, not detectable; Pam3, Pam3CSK4.
Figure 9
Figure 9
Three possible pathways for induction of antitumor macrophages. (A) TLR agonists such as LPS or Pam3CSK4 synergize with IFN-γ for induction of antitumor macrophages. TLR signaling through MyD88 leads to activation of NF-κB, and IFN-γ signaling through the tyrosine kinases Jak1 and Jak2 leads to STAT1 homodimer formation (61). The two pathways synergize to induce transcription of Nos2 and NO production resulting in cancer cell growth inhibition and cell toxicity. (B) Synergy between a TLR agonist such as Pam3CSK4 with recombinant IFN-β for induction of antitumor macrophages. IFN-β signals through the tyrosine kinases Jak1 and Tyk2 resulting in STAT1/STAT2 heterodimer formation (62), which synergize with TLR-induced NF-κB for induction of Nos2 gene transcription similar to (A). (C) The TLR agonists Pam3CSK4 and poly(I:C) synergize through endogenous type I IFN production for induction of antitumor macrophages. Poly(I:C) signals through TLR3 and induces endogenous IFN-β production, which mediates the second signal and synergizes with TLR signaling as described for exogenous IFN-β in (B). Pam3, Pam3CSK4.

References

    1. Emens LA, Ascierto PA, Darcy PK, Demaria S, Eggermont AMM, Redmond WL, et al. Cancer immunotherapy: opportunities and challenges in the rapidly evolving clinical landscape. Eur J Cancer (2017) 81:116–29. 10.1016/j.ejca.2017.01.035 - DOI - PubMed
    1. Heusinkveld M, van der Burg SH. Identification and manipulation of tumor associated macrophages in human cancers. J Transl Med. (2011) 9:216. 10.1186/1479-5876-9-216 - DOI - PMC - PubMed
    1. Bottazzi B, Polentarutti N, Acero R, Balsari A, Boraschi D, Ghezzi P, et al. Regulation of the macrophage content of neoplasms by chemoattractants. Science (1983) 220:210–2. - PubMed
    1. Noy R, Pollard JW. Tumor-associated macrophages: from mechanisms to therapy. Immunity (2014) 41:49–61. 10.1016/j.immuni.2014.06.010 - DOI - PMC - PubMed
    1. Haabeth OA, Bogen B, Corthay A. A model for cancer-suppressive inflammation. Oncoimmunology (2012) 1:1146–55. 10.4161/onci.21542 - DOI - PMC - PubMed

Publication types

MeSH terms

LinkOut - more resources