. 2018 Oct 2;9(41):7916-7930.
doi: 10.1039/c8sc04041a. eCollection 2018 Nov 7.

Cu2+ selective chelators relieve copper-induced oxidative stress in vivo

Affiliations

Cu2+ selective chelators relieve copper-induced oxidative stress in vivo

Ananya Rakshit et al. Chem Sci. .

Abstract

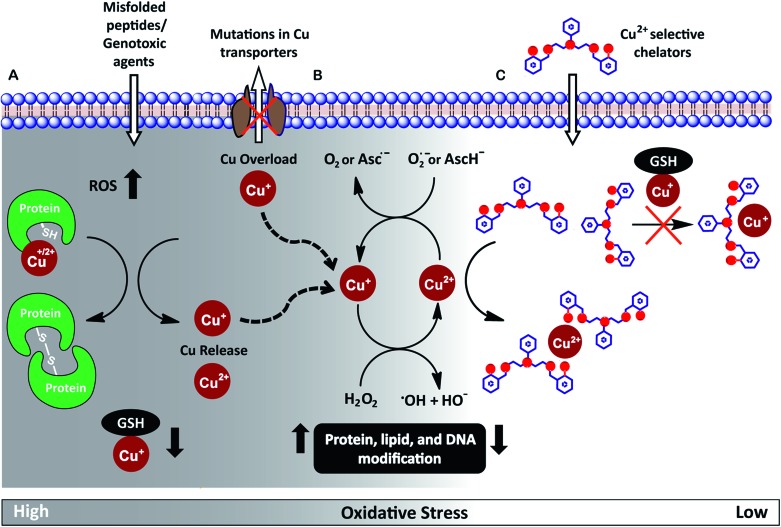
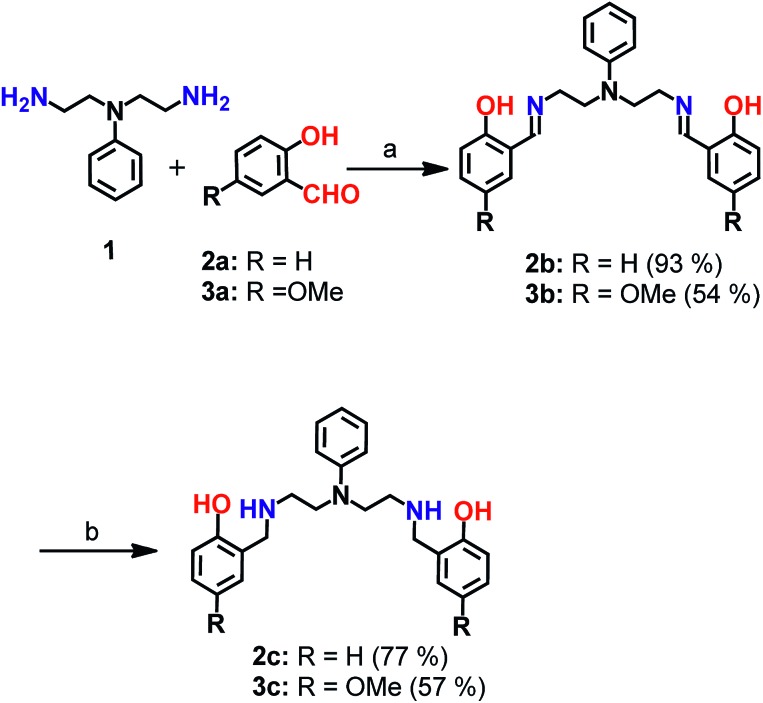
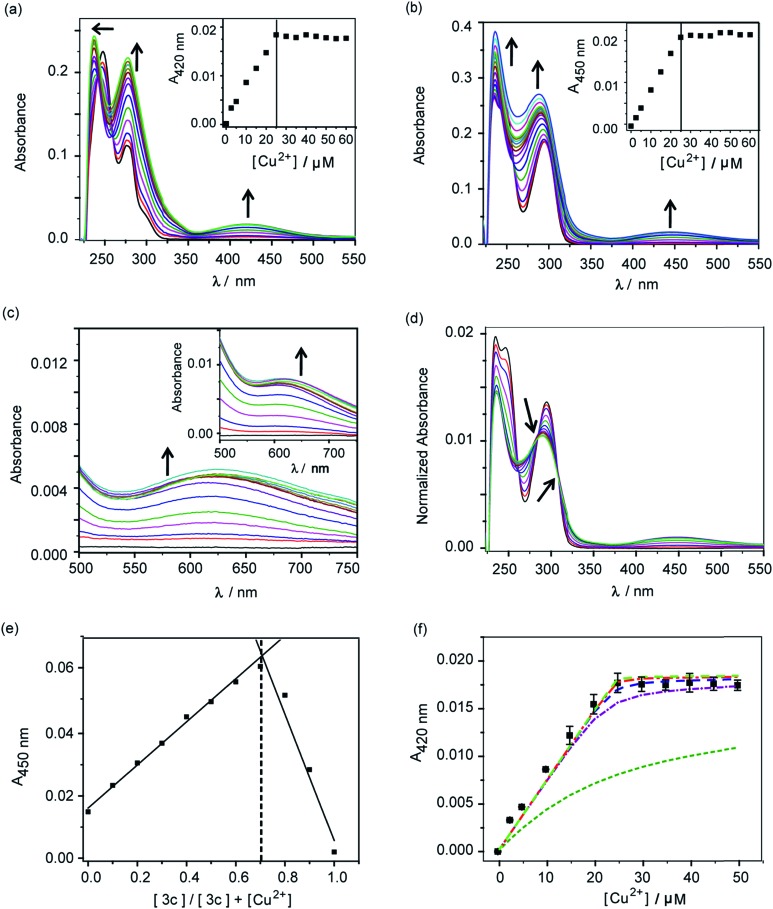
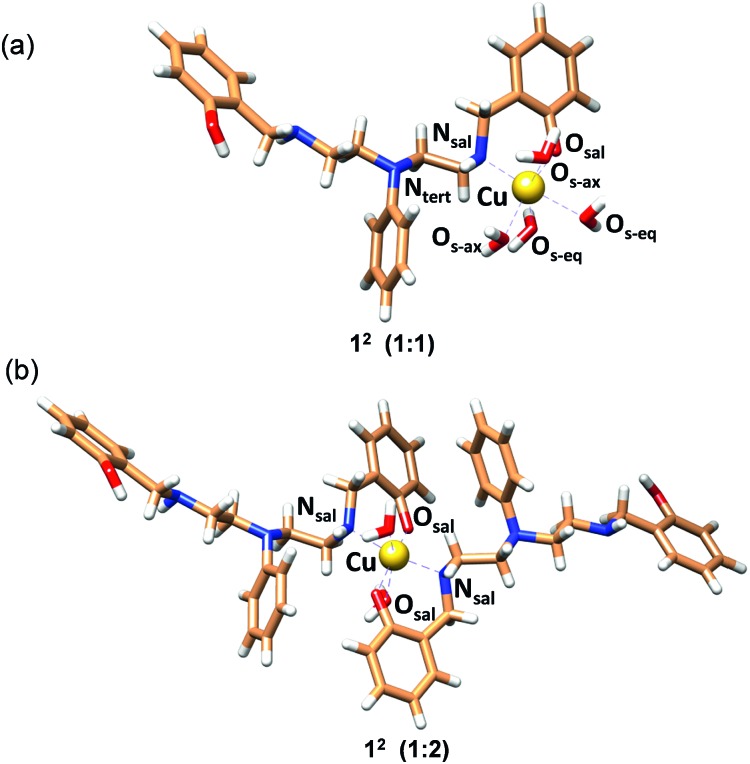
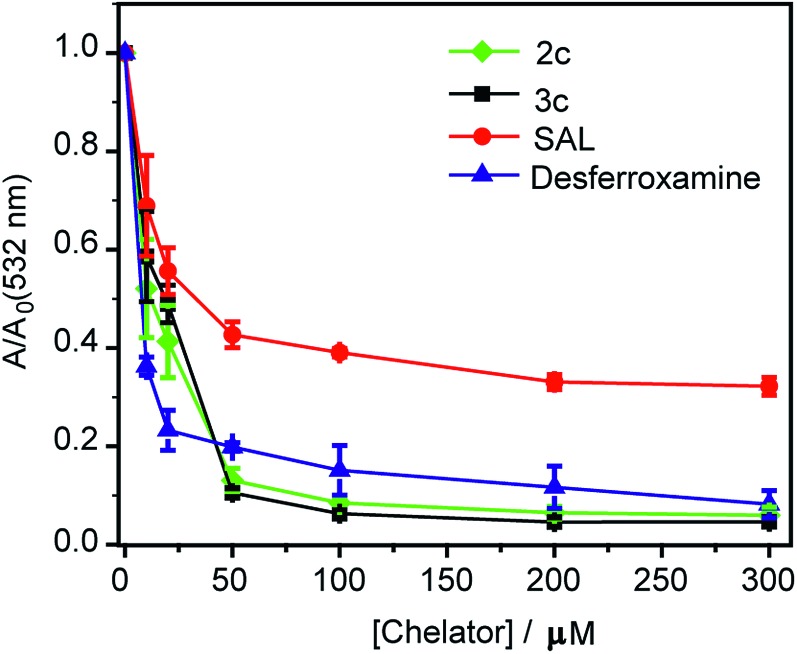
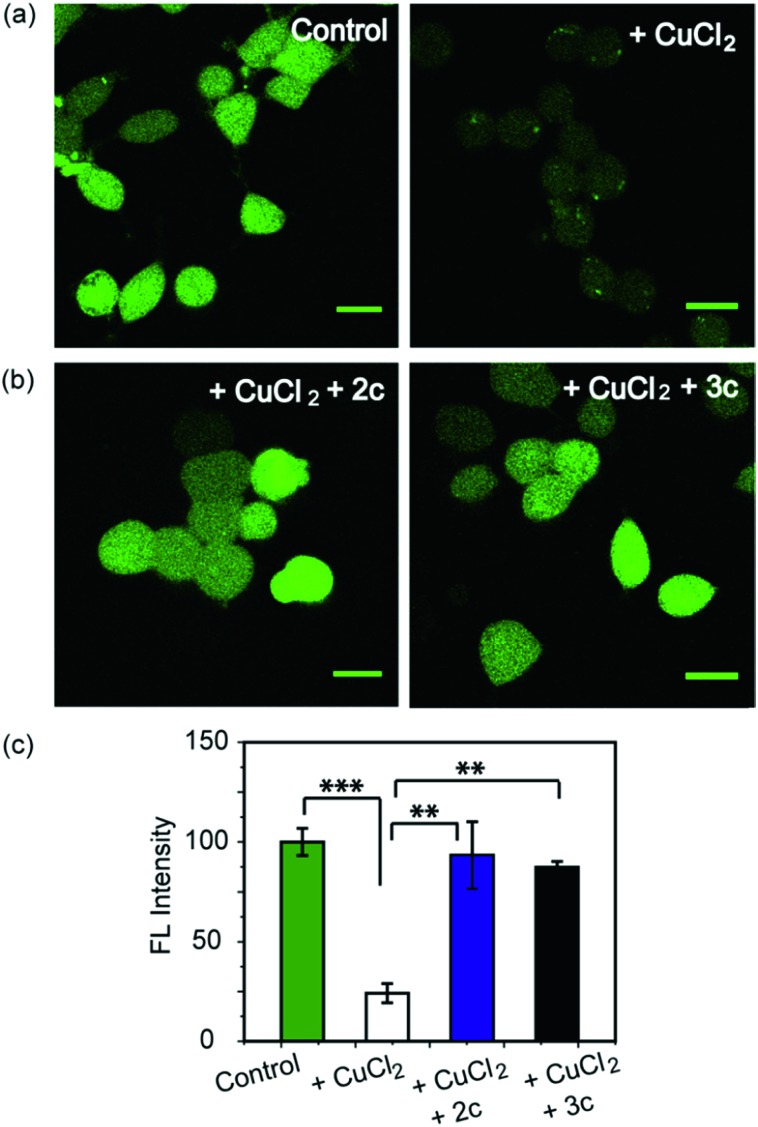
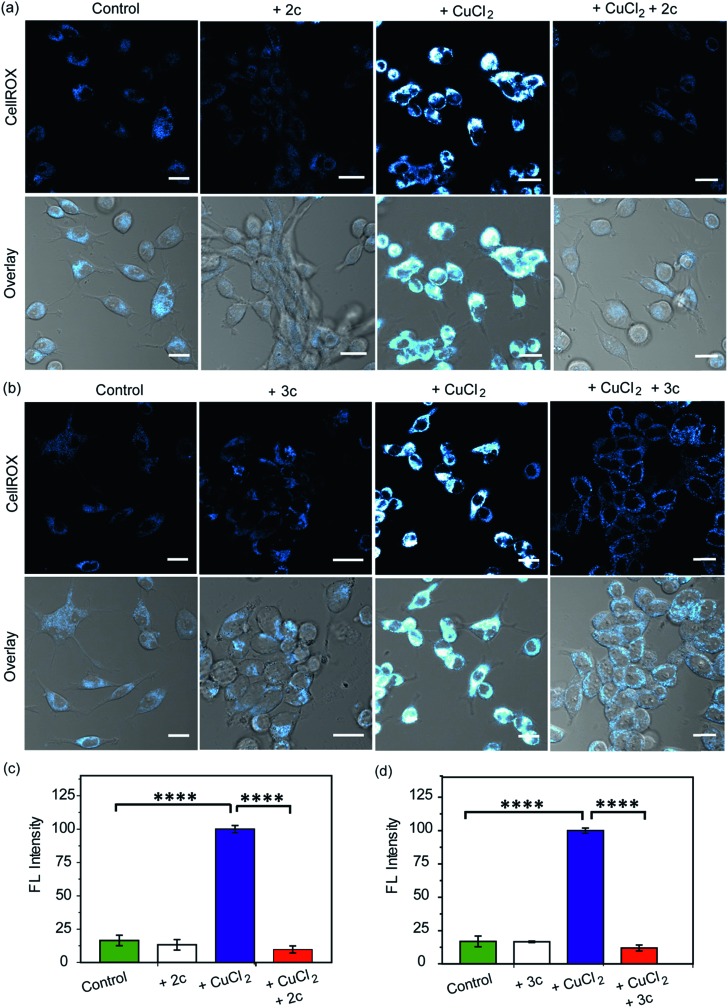
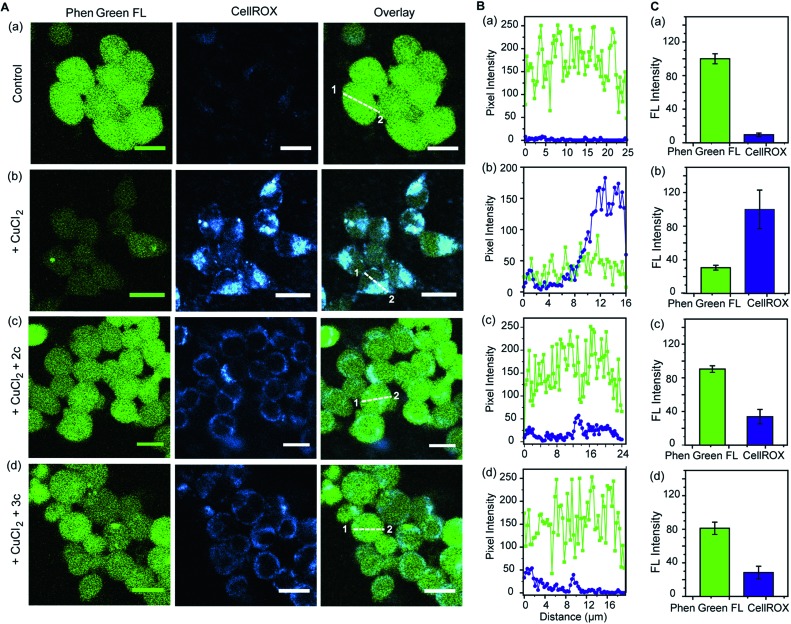
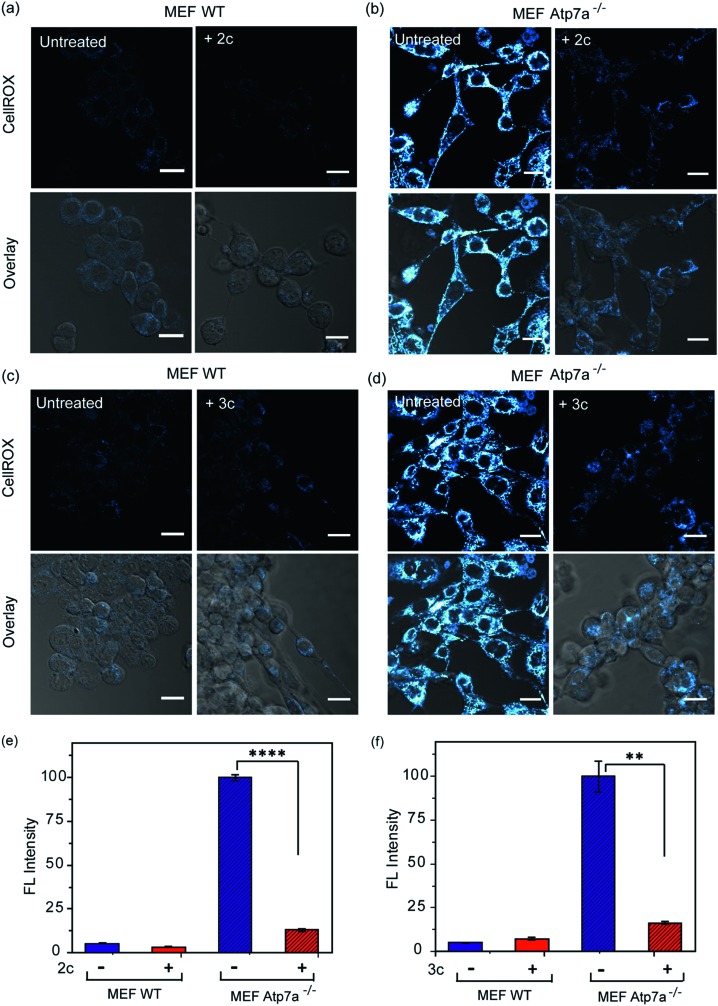
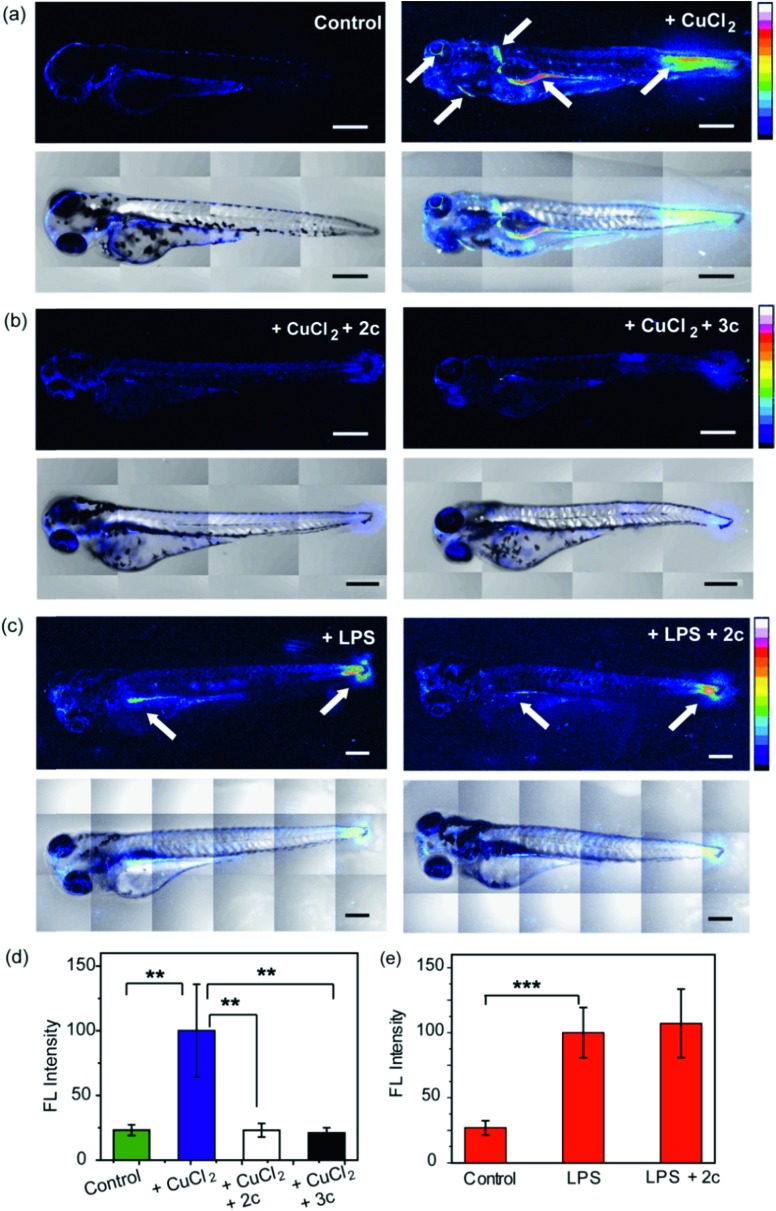
Copper ions are essential for biological function yet are severely detrimental when present in excess. At the molecular level, copper ions catalyze the production of hydroxyl radicals that can irreversibly alter essential bio-molecules. Hence, selective copper chelators that can remove excess copper ions and alleviate oxidative stress will help assuage copper-overload diseases. However, most currently available chelators are non-specific leading to multiple undesirable side-effects. The challenge is to build chelators that can bind to copper ions with high affinity but leave the levels of essential metal ions unaltered. Here we report the design and development of redox-state selective Cu ion chelators that have 108 times higher conditional stability constants toward Cu2+ compared to both Cu+ and other biologically relevant metal ions. This unique selectivity allows the specific removal of Cu2+ ions that would be available only under pathophysiological metal overload and oxidative stress conditions and provides access to effective removal of the aberrant redox-cycling Cu ion pool without affecting the essential non-redox cycling Cu+ labile pool. We have shown that the chelators provide distinct protection against copper-induced oxidative stress in vitro and in live cells via selective Cu2+ ion chelation. Notably, the chelators afford significant reduction in Cu-induced oxidative damage in Atp7a-/- Menkes disease model cells that have endogenously high levels of Cu ions. Finally, in vivo testing of our chelators in a live zebrafish larval model demonstrate their protective properties against copper-induced oxidative stress.


Figures

Fig. 1
Fig. 1. (A) Scheme highlighting mechanisms that can increase intracellular Cu ion levels. Exposure to external agents and mis-folded peptides can cause increased levels of reactive oxygen species (ROS) leading to oxidative stress. Increased oxidative stress leads to protein oxidation releasing Cu ions from proteins and also reduces levels of glutathione (GSH) bound Cu+. Mutations in Cu ion transporters lead to elevated intracellular Cu ion levels. (B) Cu+/Cu2+ catalyzed Fenton reaction produces reactive hydroxyl radicals, HO˙. Cu2+ is reduced by cellular reductants like superoxide (O2˙) and hydroascorbate (AscH) to complete the catalytic cycle. (C) Proposed cell-permeable Cu2+ chelators that alleviate oxidative stress via selective Cu2+ chelation.
Scheme 1
Scheme 1. Synthesis of chelators 2c and 3c. aReagents and conditions: (a) sodium acetate buffer, pH 4.5 and methanol, 100 °C; (b) sodium borohydride in dry methanol, 0 °C.
Fig. 2
Fig. 2. Absorbance response of ligands 2c and 3c with Cu2+. (a) Ultraviolet (UV)-visible titration of 2c (50 μM) with CuCl2 (0–60 μM) in buffer. Black arrows indicate spectral changes upon addition of Cu2+. The inset shows the plot of absorbance at 420 nm versus concentration of Cu2+. (b) UV-visible titration of 3c (50 μM) with CuCl2 (0–60 μM) in buffer. Black arrows indicate spectral changes upon addition of Cu2+. The inset shows the plot of absorbance at 450 nm versus concentration of Cu2+. (c) Visible-near infra-red (NIR) absorbance spectra for titration of 2c with Cu2+. The inset shows visible-NIR absorbance spectra for titration of 3c with Cu2+. (d) Area normalized absorbance spectra representing titration of CuCl2 to 3c. Black arrows indicate isosbestic points. (e) Job's plot depicting absorbance versus mole fraction for the Cu2+3c system. (f) Absorption binding plot for titration of Cu2+ to 2c (50 μM, black squares) with simulated fits (fitted to equation: conditional stability constant β = [ML2]/[M][L]2), using log β as 9 (green dashed line), 11 (purple dashed line), 12 (blue dashed line), 13 (red dashed line), 14 (light green dashed line). Buffer used 20 mM HEPES (100 mM NaCl, pH 7.0).
Fig. 3
Fig. 3. MOMEC optimized structures for (a) [Cu2+(2c)(OH2)4] (12; 1 : 1) and (b) [Cu2+(2c)2(OH2)2] (12; 1 : 2) complexes. Ligand 2c is in the phenolate form. In the structures, carbon, nitrogen, oxygen and hydrogen atoms are represented in light brown, blue, red and white colors, respectively. Copper ions are represented in gold.
Fig. 4
Fig. 4. Effect of chelators 2c and 3c on deoxyribose degradation via Cu ion mediated hydroxyl radical formation. Salicylaldehyde (SAL) and desferroxamine mesylate (DFO) were used as controls. Ratio of values of absorbance in the presence of chelator (A) versus absorbance in the absence of chelator (Ao) <1 signify protection against hydroxyl radical mediated deoxyribose degradation. Conditions: CuSO4 (10 μM), 2-deoxyribose (15 mM), H2O2 (100 μM), ascorbic acid (2 mM), at pH 7.4 in phosphate buffer.
Fig. 5
Fig. 5. Confocal fluorescence images of live HEK293T cells to show the effect of Cu2+ chelators using a Cu ion responsive dye Phen Green FL. All cells were incubated with Phen Green FL dye (5 μM) initially for 30 min before any further treatments. (a) Left to right: control cells; cells treated with CuCl2 (20 μM) for 30 min. (b) Left to right: cells treated with CuCl2 (20 μM) for 30 min followed by 2c (80 μM) for 30 min; CuCl2 (20 μM) for 30 min followed by 3c (80 μM) for 30 min. Cells were washed three times with PBS buffer after each addition and then imaged (λex/em: 488/498–600 nm). Fluorescence intensity analyses of confocal images were carried out by using ImageJ software. (c) Bar plots represent the intensity analyses results. Intensity data were normalized to intensity of control untreated cells. Error bars denote SEM, n = 3. Statistical analyses were performed using an unpaired, two-tailed Student's t-test (**p ≤ 0.01, ***p ≤ 0.001). Images were acquired using a 40× objective; scale bar: 20 μm.
Fig. 6
Fig. 6. Confocal fluorescence images of live HEK293T cells in presence of chelators and a ROS sensitive dye. (a) Left to right: control cells; cells treated with chelator 2c (40 μM) for 30 min; with CuCl2 (20 μM) for 30 min; with CuCl2 (20 μM) for 30 min followed by 2c (40 μM) for 30 min. (b) Left to right: control cells; cells treated with 3c (40 μM) for 30 min; CuCl2 (20 μM) for 30 min; CuCl2 (20 μM) for 30 min followed by 3c (40 μM) for 30 min. Cells were stained with CellROX (5 μM) for 30 min at the final step before imaging. (λex/em: 633/641–700 nm). Cells were washed three times with PBS buffer after each addition and then imaged. Lower panels of (a) and (b) shows bright field images of cells overlaid with confocal images. Fluorescence intensity analyses of confocal images were carried out by using ImageJ software. Bar plots represent the intensity analyses results for (c) chelator 2c and (d) chelator 3c. Intensity data were normalized to intensity of CuCl2 treated cells. Error bars denote SEM, n = 3. Statistical analyses were performed using an unpaired, two-tailed Student's t-test (****p ≤ 0.0001). Images were acquired using a 40× objective; scale bar: 20 μm.
Fig. 7
Fig. 7. Simultaneous imaging of copper levels and oxidative stress in live HEK293T cells in the presence and absence of chelators 2c and 3c. Phen Green FL was used to image Cu ions and CellROX was used to image ROS. (A) Top to bottom (a–d): confocal images of control untreated cells; cells treated with CuCl2 (20 μM) for 30 min; cells treated with CuCl2 (20 μM) for 30 min followed by 2c (80 μM) for 30 min; cells treated with CuCl2 (20 μM) for 30 min followed by 3c (80 μM) for 30 min. All cells were incubated with Phen Green FL (5 μM) for 30 min prior to any other treatment (λex/em: 488/498–600 nm) and incubated with CellROX (5 μM) for 30 min at the final step before imaging (λex/em: 633/641–700 nm). Cells were washed three times with PBS buffer after each addition and then imaged. Number of washings was identical for all experiments. Left to right: HEK293T cells showing Phen Green FL emission, CellROX emission, and overlaid confocal images. (B) The white lines in the overlaid images were used to calculate the fluorescence intensity of Phen Green FL (green) and CellROX (blue) in the line scan along the direction of 1 to 2. (C) Bar plots represent the intensity analyses results for panel (A, a–d). Intensity data were normalized to intensity of control untreated or CuCl2 treated cells. Error bars denote SEM, n = 3. Images were acquired using a 40× objective; scale bar: 20 μm.
Fig. 8
Fig. 8. Confocal fluorescence imaging in mouse embryonic fibroblast wildtype (MEF WT) and mouse embryonic fibroblast Atp7a knockout (MEF Atp7a–/–) cells in presence of chelators and a ROS sensitive dye. (a) MEF WT cells: left to right, untreated cells; cells treated with chelator 2c (40 μM) for 60 min. (b) MEF Atp7a–/– cells: left to right, untreated cells; cells treated with chelator 2c (40 μM) for 60 min. (c) MEF WT cells: left to right, untreated cells; cells treated with chelator 3c (40 μM) for 60 min. (d) MEF Atp7a–/– cells: left to right, untreated cells; cells treated with chelator 3c (40 μM) for 60 min. Cells were stained with CellROX (5 μM) for 30 min at the final step before imaging (λex/em: 633/641–700 nm). Cells were washed three times with PBS buffer after each addition and then imaged. Lower panels of (a)–(d) shows bright field images of cells overlaid with confocal images. Fluorescence intensity analyses of confocal images were carried by using ImageJ software. Bar plots represent the intensity analyses of fluorescence images for chelators (e) 2c and (f) 3c. Fluorescence intensities were normalized to intensity of MEF Atp7a–/– cells. Error bars denote SEM, n = 3. Statistical analyses were performed using an unpaired, two-tailed Student's t-test (**p ≤ 0.01, ****p ≤ 0.0001). Images were acquired using a 40× objective; scale bar: 20 μm.
Fig. 9
Fig. 9. Confocal fluorescence images depicting the effect of chelators on live 3.5 dpf zebrafish larvae treated with copper salts. (a–c) Upper panels depict Z stacked confocal fluorescence images and lower panels depict bright field images overlaid with Z stacked confocal fluorescence images. (a) Control Cu-untreated larvae (left) and larvae treated with CuCl2 (30 μM) for 30 min (right). (b) Larvae treated with CuCl2 (30 μM) for 30 min followed by 2c (60 μM) for 30 min (left) and larvae treated with CuCl2 (30 μM) for 30 min followed by 3c (60 μM) for 30 min (right). (c) Larvae treated with LPS (10 μg mL–1) for 30 min (left) and larvae treated with LPS (10 μg mL–1) for 30 min followed by 2c (60 μM) for 30 min (right). White arrows indicate regions exhibiting high oxidative stress. Larvae were stained with CellROX (10 μM) for 30 min in the final step before imaging. (d) Bar plots representing average fluorescence intensities obtained from intensity analysis of confocal images of the zebrafish larvae experiments for which representative images are shown in panels (a and b). Intensity data were normalized to intensity of CuCl2 treated larvae. (e) Quantification of fluorescence intensities of confocal images of zebrafish larvae for which representative images are shown in panel (c). Intensity data were normalized to LPS treated larvae. For both panels (d and e) intensity analyses were carried out on Z-stacked confocal images of zebrafish larvae. ImageJ software (NIH, USA) was used for image analysis. For fluorescence quantification, a region of interest (ROI) was created, and fluorescence intensity was measured. The reported fluorescence intensity was determined by averaging the measured intensity of at least fifteen different ROIs from experiments on at least six different zebrafish larvae. Error bars denote SEM, n = 6. Statistical analyses were performed using an unpaired, two-tailed Student's t-test (**p ≤ 0.01, ***p ≤ 0.001). 20× objective was used for imaging; scale bar: 200 μm.

Similar articles

Cited by

References

    1. Chang C. J. Nat. Chem. Biol. 2015;11:744–747. - PubMed
    1. Daly M. J., Gaidamakova E. K., Matrosova V. Y., Vasilenko A., Zhai M., Venkateswaran A., Hess M., Omelchenko M. V., Kostandarithes H. M., Makarova K. S., Wackett L. P., Fredrickson J. K., Ghosal D. Science. 2004;306:1025–1028. - PubMed
    1. Barnese K., Gralla E. B., Valentine J. S., Cabelli D. E. Proc. Natl. Acad. Sci. U. S. A. 2012;109:6892–6897. - PMC - PubMed
    1. Hatori Y., Yan Y., Schmidt K., Furukawa E., Hasan N. M., Yang N., Liu C.-N., Sockanathan S., Lutsenko S. Nat. Commun. 2016;7:10640. - PMC - PubMed
    1. Schlief M. L., West T., Craig A. M., Holtzman D. M., Gitlin J. D. Proc. Natl. Acad. Sci. U. S. A. 2006;103:14919–14924. - PMC - PubMed