

Preliminary study on visual recognition under low visibility conditions caused by artificial dynamic smog
- PMID: 30450314
- PMCID: PMC6232330
- DOI: 10.18240/ijo.2018.11.14
Preliminary study on visual recognition under low visibility conditions caused by artificial dynamic smog
Abstract
Aim: To quantitatively evaluate the effect of a simulated smog environment on human visual function by psychophysical methods.
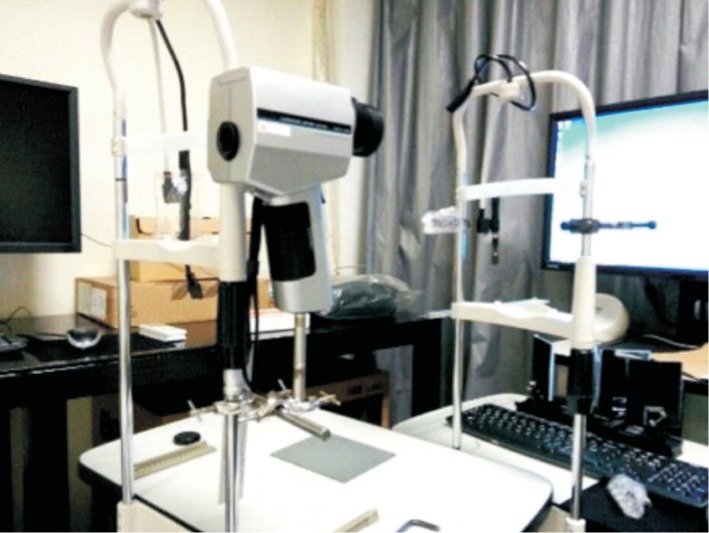
Methods: The smog environment was simulated in a 40×40×60 cm3 glass chamber filled with a PM2.5 aerosol, and 14 subjects with normal visual function were examined by psychophysical methods with the foggy smog box placed in front of their eyes. The transmission of light through the smog box, an indication of the percentage concentration of smog, was determined with a luminance meter. Visual function under different smog concentrations was evaluated by the E-visual acuity, crowded E-visual acuity and contrast sensitivity.
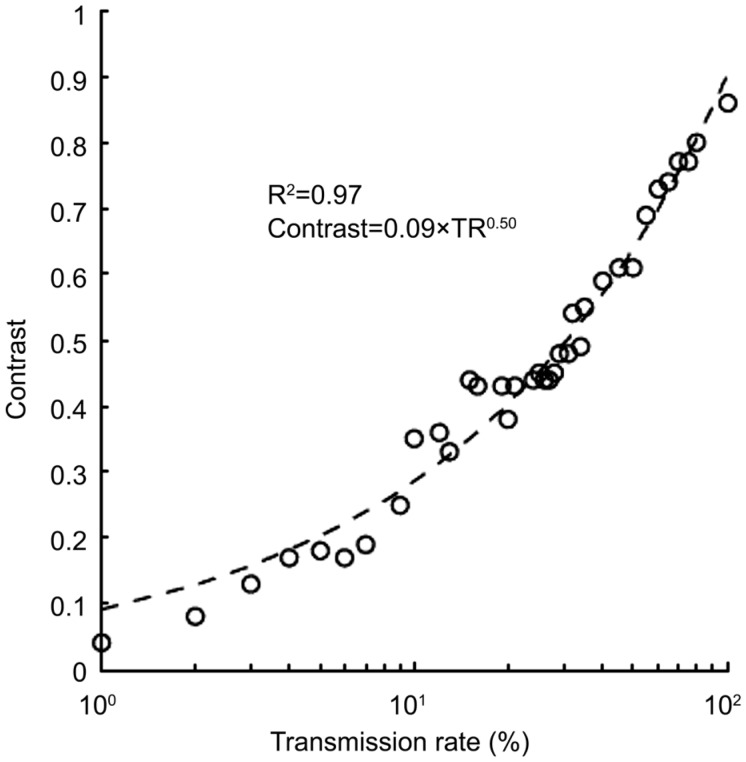
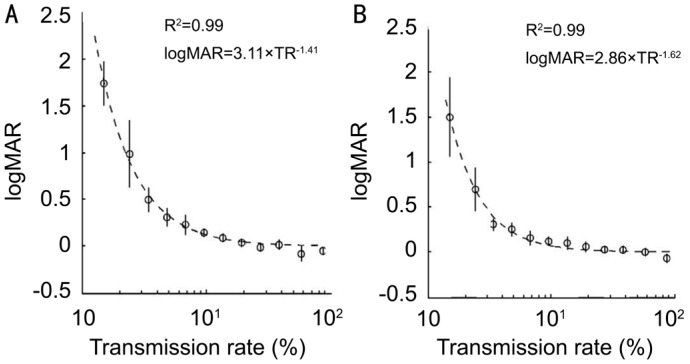
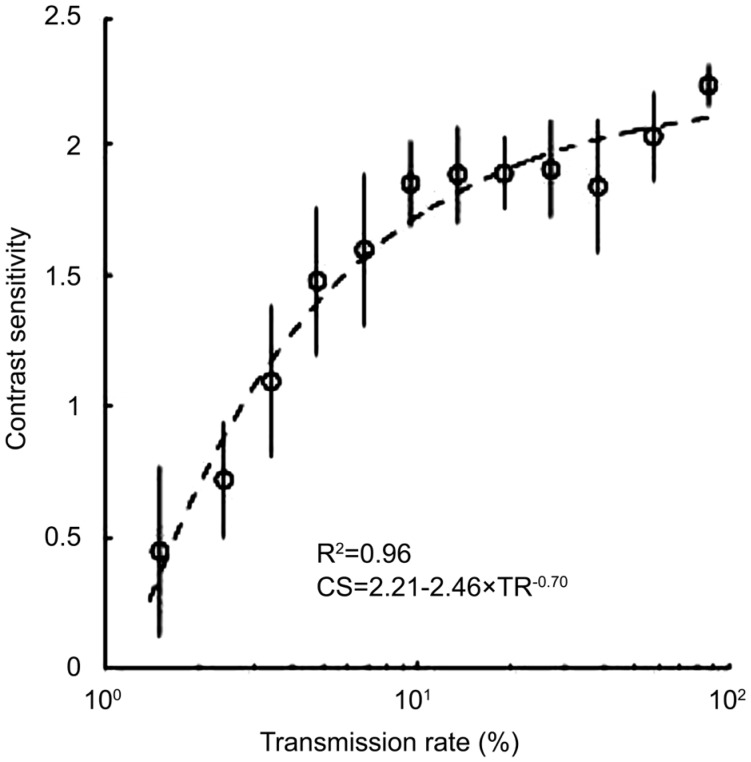
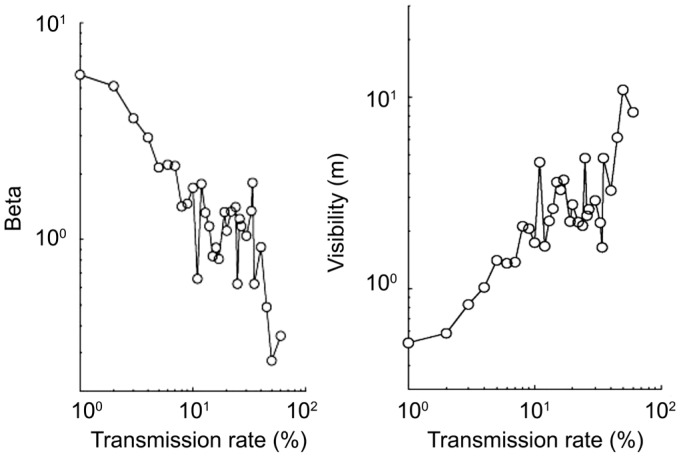
Results: E-visual acuity, crowded E-visual acuity and contrast sensitivity were all impaired with a decrease in the transmission rate (TR) according to power functions, with invariable exponents of -1.41, -1.62 and -0.7, respectively, and R2 values of 0.99 for E and crowded E-visual acuity, 0.96 for contrast sensitivity. Crowded E-visual acuity decreased faster than E-visual acuity. There was a good correlation between the TR, extinction coefficient and visibility under heavy-smog conditions.
Conclusion: Increases in smog concentration have a strong effect on visual function.
Keywords: artificial smog; low visibility conditions; visual recognition.
Figures
Similar articles
-
Standard measures of visual acuity do not predict drivers' recognition performance under day or night conditions.Optom Vis Sci. 2005 Aug;82(8):698-705. doi: 10.1097/01.opx.0000175562.27101.51. Optom Vis Sci. 2005. PMID: 16127335
-
Vision-targeted health related quality of life in older adults: patient-reported visibility problems in low luminance activities are more likely to decline than daytime activities.BMC Ophthalmol. 2016 Jul 7;16:92. doi: 10.1186/s12886-016-0274-5. BMC Ophthalmol. 2016. PMID: 27386942 Free PMC article.
-
Mesopic visual acuity is less crowded.Graefes Arch Clin Exp Ophthalmol. 2018 Sep;256(9):1739-1746. doi: 10.1007/s00417-018-4017-6. Epub 2018 May 28. Graefes Arch Clin Exp Ophthalmol. 2018. PMID: 29808376
-
[Concentration distribution of metal elements in atmospheric aerosol under different weather conditions in Qingdao Coastal Region].Huan Jing Ke Xue. 2014 Oct;35(10):3651-62. Huan Jing Ke Xue. 2014. PMID: 25693366 Chinese.
-
Training on spatiotemporal masking improves crowded and uncrowded visual acuity.J Vis. 2015;15(6):12. doi: 10.1167/15.6.12. J Vis. 2015. PMID: 26024459
References
-
- Wu D, Wu C, Liao B, Chen H, Wu M, Li F, Tan H, Deng T, Li H, Jiang D, Yu JZ. Black carbon over the South China Sea and in various continental locations in South China. Atmospheric Chemistry and Physics. 2013;13(24):12257–12270.
-
- Pui DYH, Chen SC, Zuo Z. PM2.5 in China: measurements, sources, visibility and health effects, and mitigation. Particuology. 2014;13:1–26.
LinkOut - more resources
Full Text Sources