

Discriminating Alzheimer's disease progression using a new hippocampal marker from T1-weighted MRI: The local surface roughness
- PMID: 30451343
- PMCID: PMC6865478
- DOI: 10.1002/hbm.24478
Discriminating Alzheimer's disease progression using a new hippocampal marker from T1-weighted MRI: The local surface roughness
Abstract
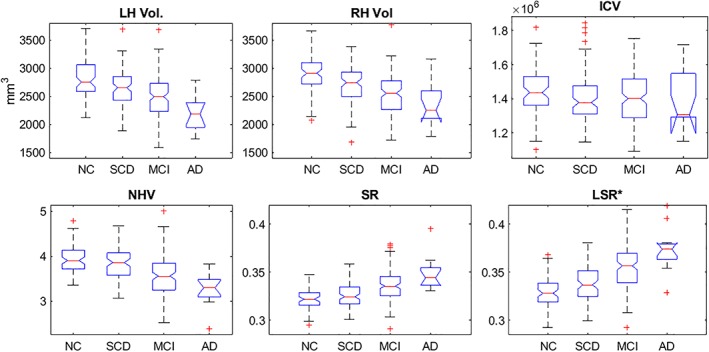
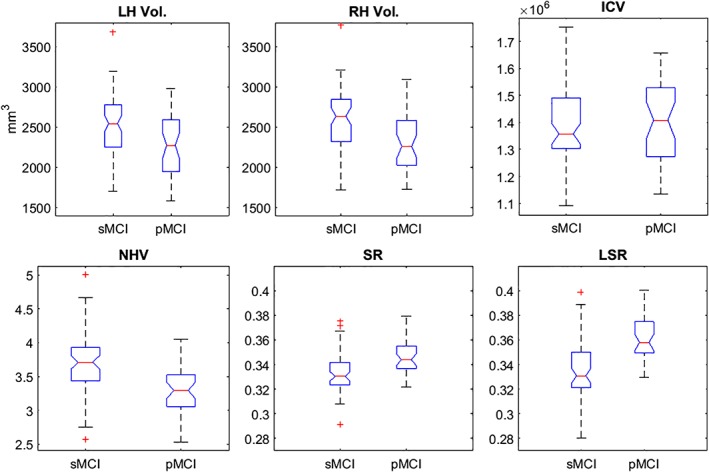
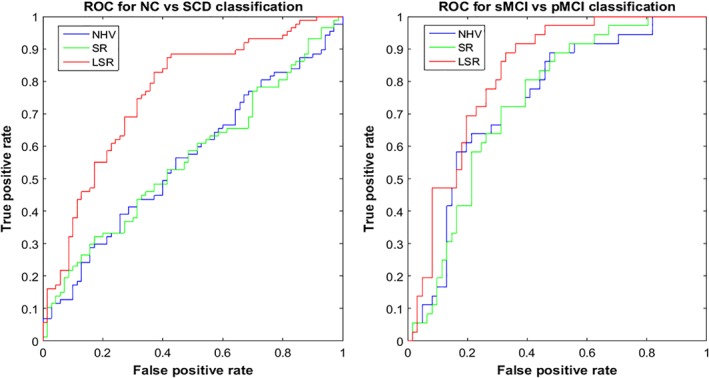
Hippocampal atrophy is one of the main hallmarks of Alzheimer's disease (AD). However, there is still controversy about whether this sign is a robust finding during the early stages of the disease, such as in mild cognitive impairment (MCI) and subjective cognitive decline (SCD). Considering this background, we proposed a new marker for assessing hippocampal atrophy: the local surface roughness (LSR). We tested this marker in a sample of 307 subjects (normal control (NC) = 70, SCD = 87, MCI = 137, AD = 13). In addition, 97 patients with MCI were followed-up over a 3-year period and classified as stable MCI (sMCI) (n = 61) or progressive MCI (pMCI) (n = 36). We did not find significant differences using traditional markers, such as normalized hippocampal volumes (NHV), between the NC and SCD groups or between the sMCI and pMCI groups. However, with LSR we found significant differences between the sMCI and pMCI groups and a better ability to discriminate between NC and SCD. The classification accuracy of the LSR for NC and SCD was 68.2%, while NHV had a 57.2% accuracy. In addition, the classification accuracy of the LSR for sMCI and pMCI was 74.3%, and NHV had a 68.3% accuracy. Cox proportional hazards models adjusted for age, sex, and education were used to estimate the relative hazard of progression from MCI to AD based on hippocampal markers and conversion times. The LSR marker showed better prediction of conversion to AD than NHV. These results suggest the relevance of considering the LSR as a new hippocampal marker for the AD continuum.
Keywords: Alzheimer's disease continuum; hippocampal biomarkers; hippocampal segmentation; local surface roughness; progression to AD.
© 2018 Wiley Periodicals, Inc.
Figures
References
-
- Albert, M. S. , DeKosky, S. T. , Dickson, D. , Dubois, B. , Feldman, H. H. , Fox, N. C. , … Phelps, C. H. (2011). The diagnosis of mild cognitive impairment due to Alzheimer's disease: Recommendations from the National Institute on Aging‐Alzheimer's Association workgroups on diagnostic guidelines for Alzheimer's disease. Alzheimer's & Dementia, 7, 270–279. - PMC - PubMed
-
- Apostolova, L. G. , Green, A. E. , Babakchanian, S. , Hwang, K. S. , Chou, Y.‐Y. , Toga, A. W. , & Thompson, P. M. (2012). Hippocampal atrophy and ventricular enlargement in normal aging, mild cognitive impairment and Alzheimer's disease. Alzheimer Disease and Associated Disorders, 26(1), 17–27. - PMC - PubMed
-
- Battaglini, M. , Smith, S. M. , Brogi, S. , & De Stefano, N. (2008). Enhanced brain extraction improves the accuracy of brain atrophy estimation. NeuroImage, 40, 583–589. - PubMed
-
- Boccardi, M. , Ganzola, R. , Bocchetta, M. , Pievani, M. , Redolfi, A. , Bartzokis, G. , … Frisoni, G. B. (2011). Survey of protocols for the manual segmentation of the hippocampus: Preparatory steps towards a joint EADC‐ADNI harmonized protocol. The Journal of Alzheimer's Disease, 26, 61–75. - PMC - PubMed
-
- Buckner, R. L. , Head, D. , Parker, J. , Fotenos, A. F. , Marcus, D. , Morris, J. C. , & Snyder, A. Z. (2004). A unified approach for morphometric and functional data analysis in young, old, and demented adults using automated atlas‐based head size normalization: Reliability and validation against manual measurement of total intracranial volume. NeuroImage, 23, 724–738. - PubMed
Publication types
MeSH terms
Substances
Grants and funding
LinkOut - more resources
Full Text Sources
Other Literature Sources
Medical
