. 2018 Nov 19;9(1):4877.
doi: 10.1038/s41467-018-07307-6.

Single cell RNA-seq and ATAC-seq analysis of cardiac progenitor cell transition states and lineage settlement

Affiliations

Single cell RNA-seq and ATAC-seq analysis of cardiac progenitor cell transition states and lineage settlement

Guangshuai Jia et al. Nat Commun. .

Abstract

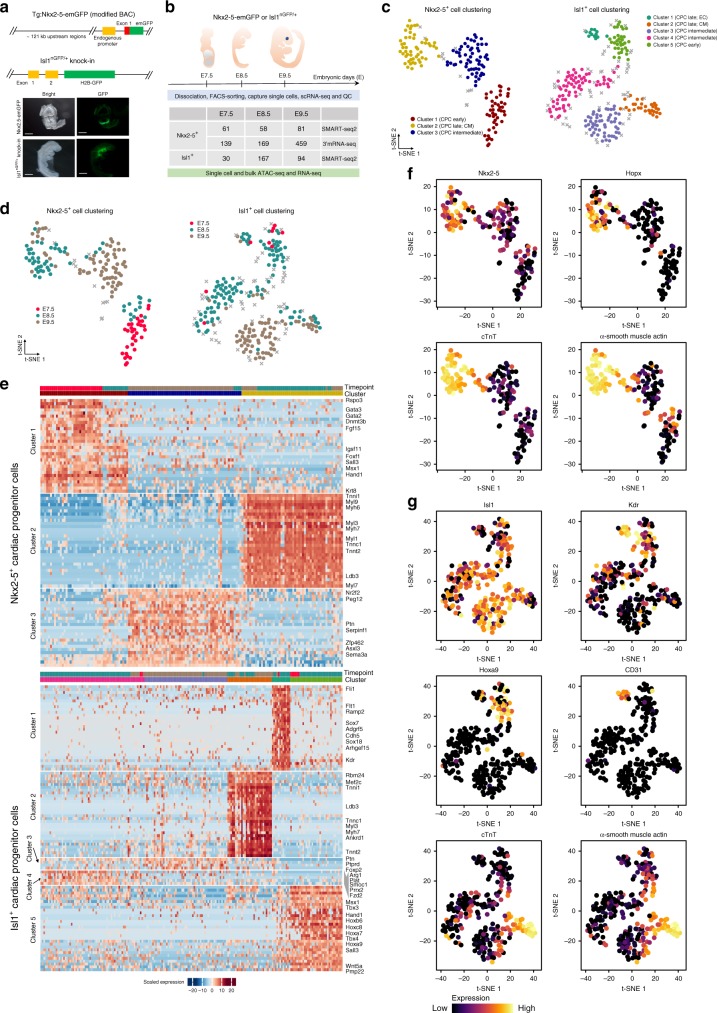
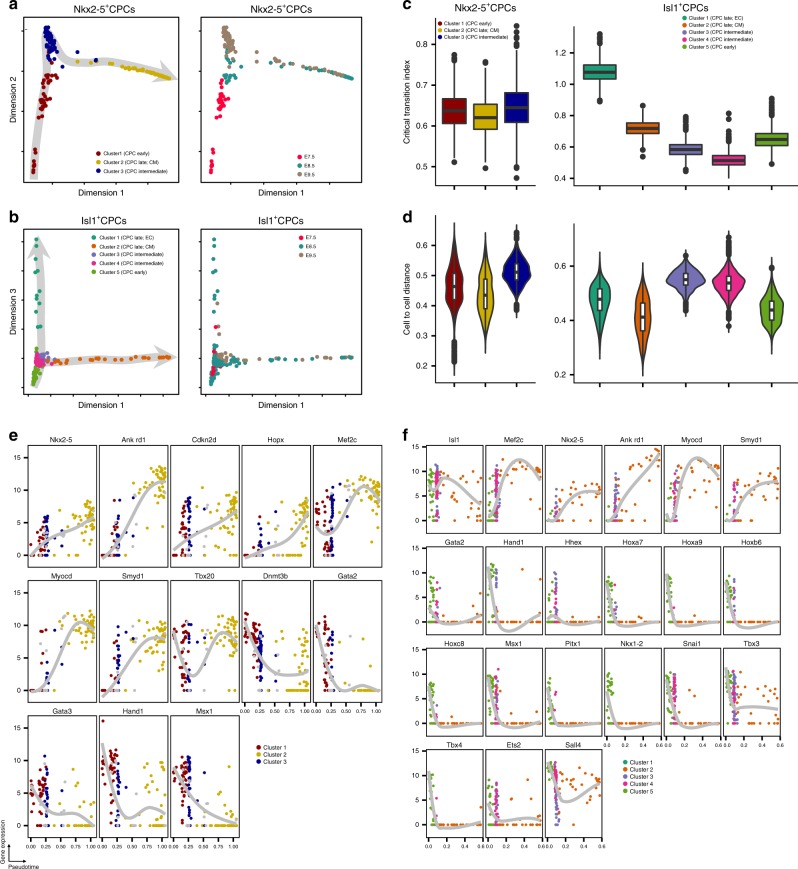
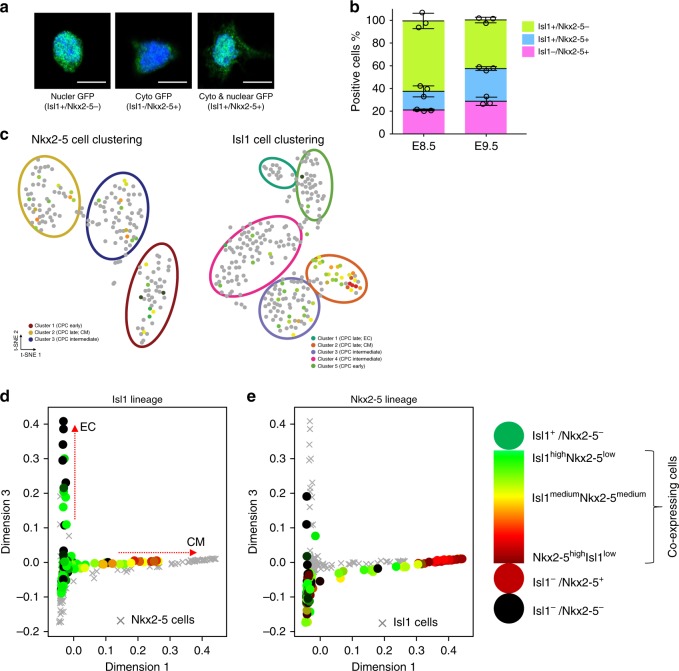
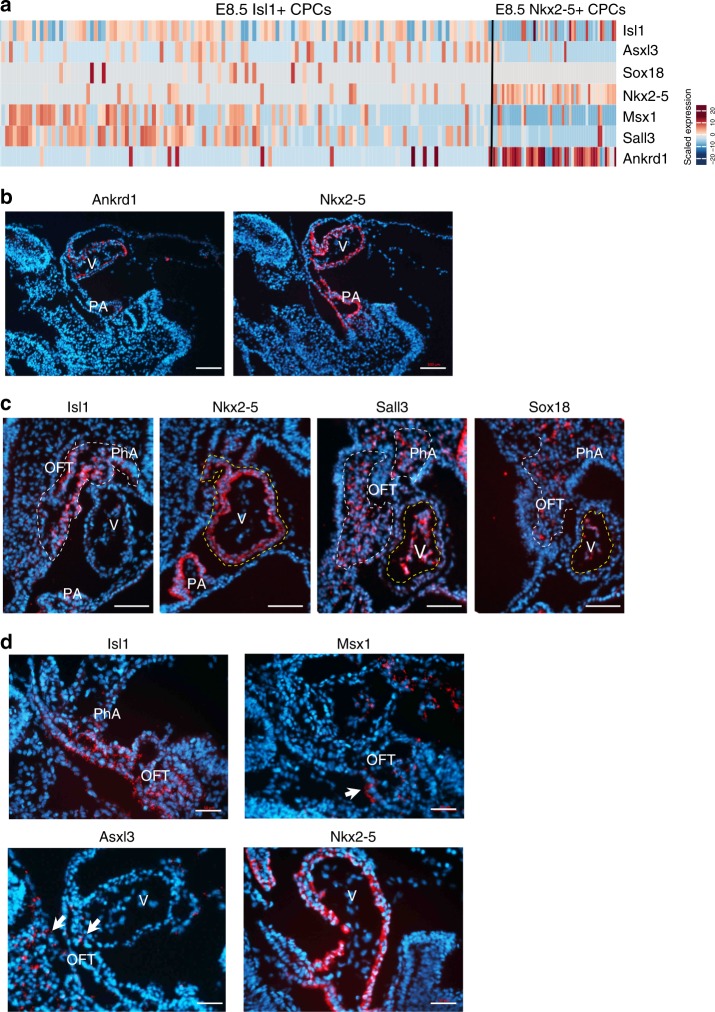
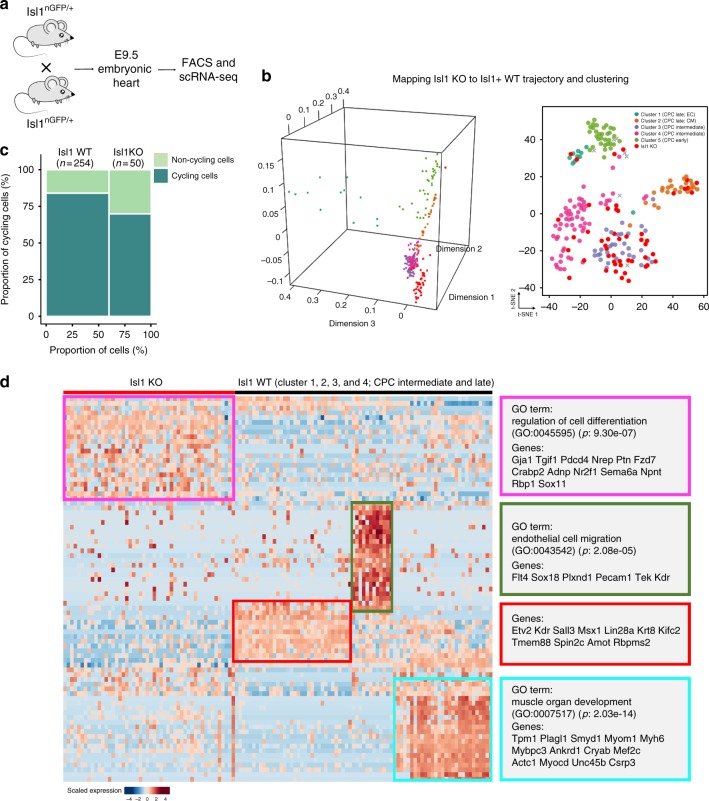
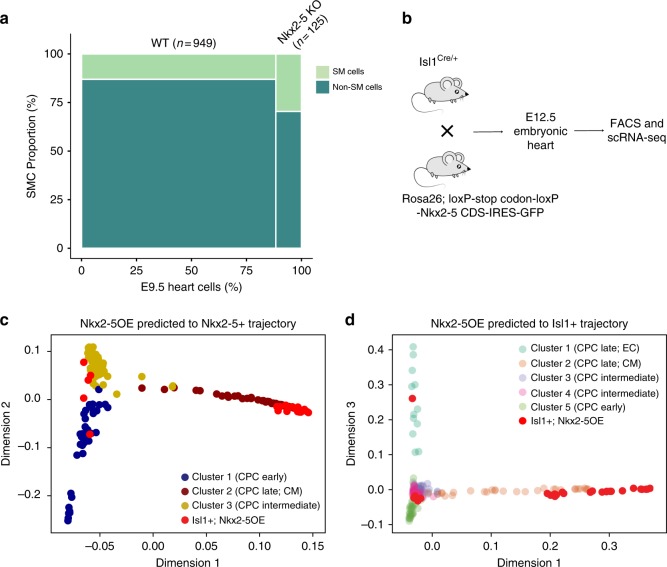
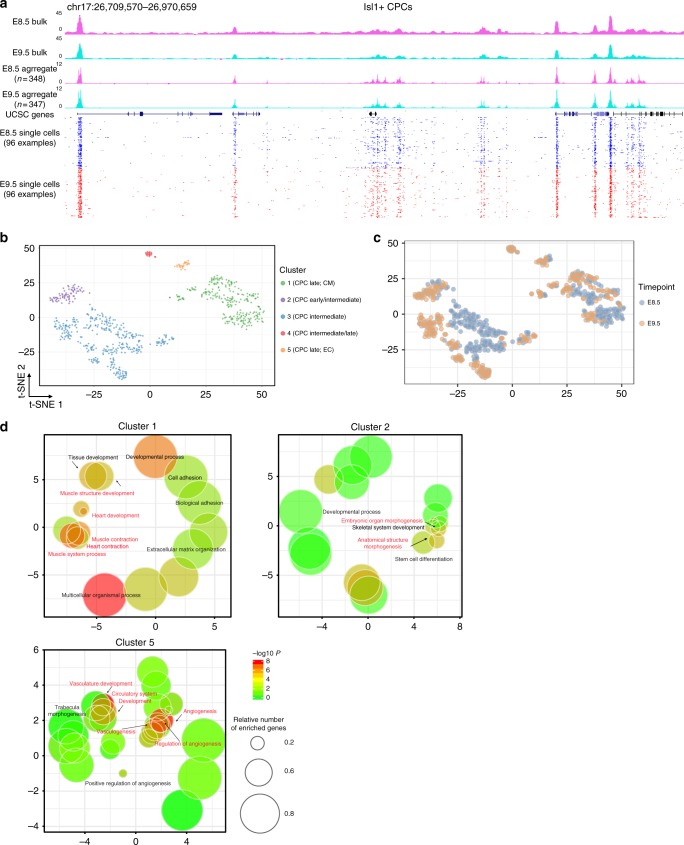
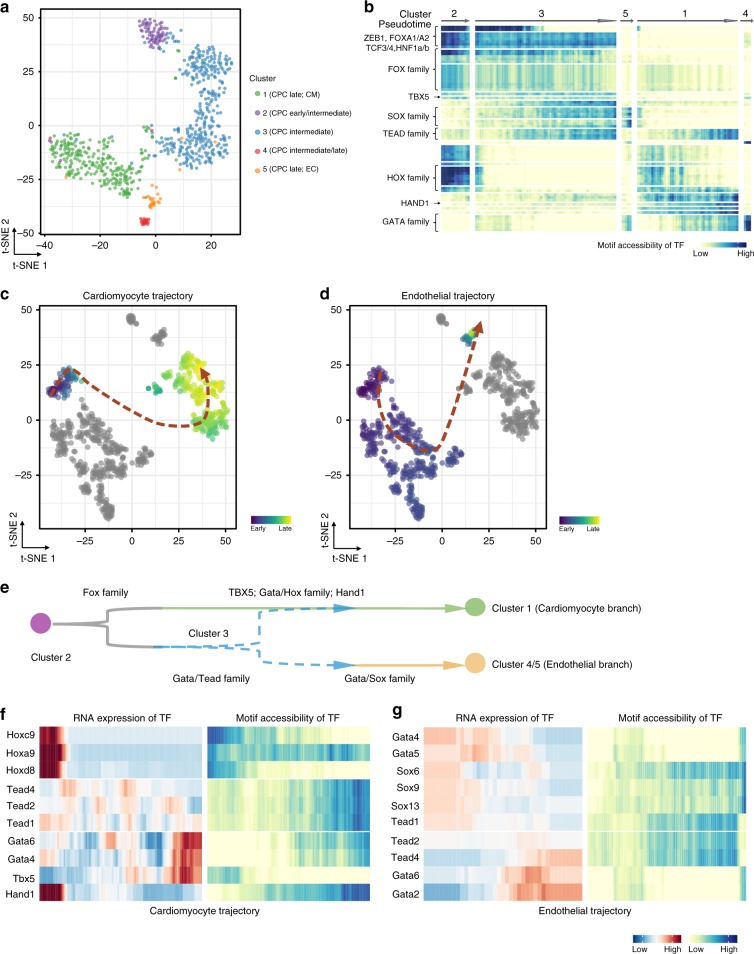
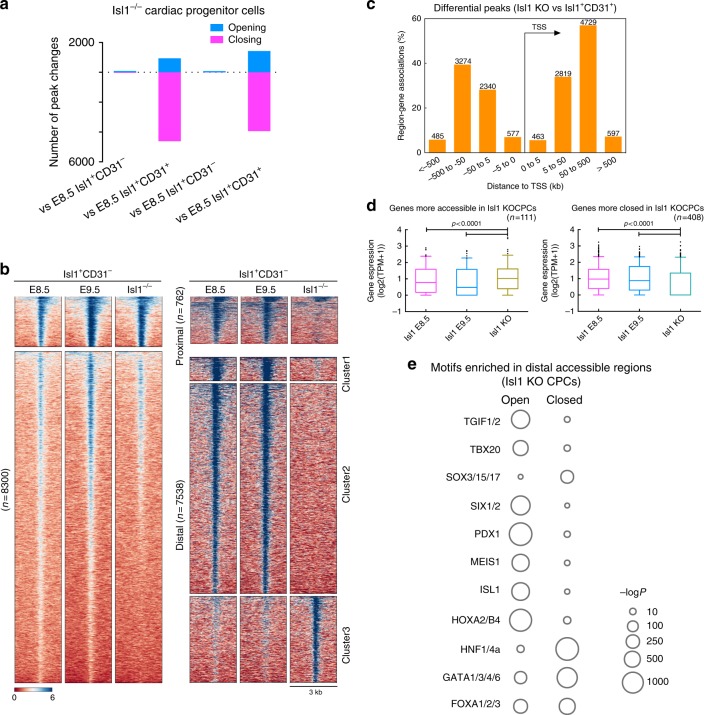
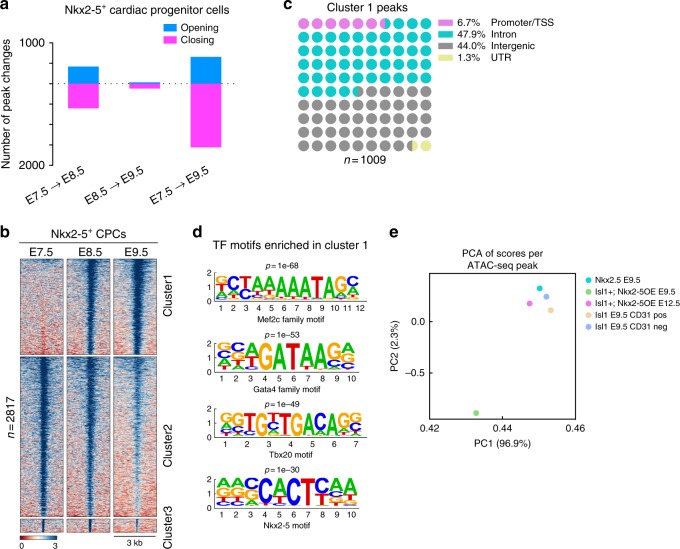
Formation and segregation of cell lineages forming the heart have been studied extensively but the underlying gene regulatory networks and epigenetic changes driving cell fate transitions during early cardiogenesis are still only partially understood. Here, we comprehensively characterize mouse cardiac progenitor cells (CPCs) marked by Nkx2-5 and Isl1 expression from E7.5 to E9.5 using single-cell RNA sequencing and transposase-accessible chromatin profiling (ATAC-seq). By leveraging on cell-to-cell transcriptome and chromatin accessibility heterogeneity, we identify different previously unknown cardiac subpopulations. Reconstruction of developmental trajectories reveal that multipotent Isl1+ CPC pass through an attractor state before separating into different developmental branches, whereas extended expression of Nkx2-5 commits CPC to an unidirectional cardiomyocyte fate. Furthermore, we show that CPC fate transitions are associated with distinct open chromatin states critically depending on Isl1 and Nkx2-5. Our data provide a model of transcriptional and epigenetic regulations during cardiac progenitor cell fate decisions at single-cell resolution.


Conflict of interest statement

The authors declare no competing interests.

Figures

Fig. 1
Fig. 1
Identification of CPC subpopulations by single-cell RNA-seq. a Schematic representation of the Nkx2-5-emGFP transgenic reporter and Isl1nGFP/+ allele (top). Expression of Nkx2-5-emGFP and Isl1-nGFP at E8.5 in mouse embryonic hearts. (bottom). b Sampling time points for scRNA-seq, bulk RNA-seq, scATAC-seq, and bulk ATAC-seq. The table shows numbers of cells used for scRNA-seq. QC: quality control. c, d t-SNE visualization of individual Nkx2-5+ and Isl1+ CPCs to identify subpopulations. Colors denote corresponding clusters, and (d) development stages. Outlier cells are indicated by gray crosses. e Hierarchical clustering of expression heatmaps showing differentially expressed marker genes (AUROC > 0.8, FDR < 0.01; and lower bound of LogFC > 2 or higher bound of LogFC < −2, FDR < 0.01) across different clusters in Nkx2-5+ CPCs (top) and Isl1+ CPCs (bottom). Source data are provided in the Source Data file. f, g Expression of selected individual genes in Nkx2-5+ (f) and Isl1+ (g) CPCs. The colors represent expression levels of cells that are shown in the t-SNE plots in (c). EC, endothelial cell. CM, cardiomyocyte. Scale bar: 300 μm
Fig. 2
Fig. 2
Reconstruction of trajectories and transition states of CPCs. a t-SNE plots showing diffusion pseudotimes (gray arrows) of Nkx2-5+ and b Isl1+ CPCs. Clusters and development stages of individual cells are color-coded as indicated. c Boxplots representing the distribution of IC(C) values from all marker genes for each cluster of Nkx2-5+ (left) and Isl1+ (right) cells. Lower and upper hinges correspond to the first and third quantile (25th and 75th percentile), while whiskers extend from the hinge to the smallest (largest) datum not further than 1.5 times the interquartile range. Outliers are plotted individually. d Violin plots showing the distribution of pairwise cell-to-cell distances across each cluster of Nkx2-5+ (left) and Isl1+ (right) cells. Inset boxplots show the median, lower and upper hinges as well as whiskers and outliers as in (c). e, f Expression levels of different transcription factors and key marker genes on the pseudotime axis in Nkx2-5+ (e) and Isl1+ (f) cells. Trend lines calculated by Loess regression are indicated in gray. Source data for (cf) are provided in the Source Data file
Fig. 3
Fig. 3
Comparison of Isl1+ and Nkx2-5+ cardiac progenitor cells. a Confocal images showing nuclear-, cytoplasmic- and co-localization of GFP in CPCs FACS-sorted from Isl1+/nGFP/Nkx2-5-emGFP+ embryos. Nuclei were stained with DAPI (blue). b Immunofluorescence-based quantification of (a). Isl1+Nkx2-5, Isl1+Nkx2-5+ and Isl1Nkx2-5+ cells were FACS-sorted from Isl1+/nGFP/Nkx2-5-emGFP+ embryos at E8.5 and E9.5. Quantification of different cell populations was achieved by counting all immunostained cells in a multiwell dish. Mean ± s.d. are shown. Circles represent results from different biological replicates [n = 3; Σ (cell number) of E8.5 = 225, 260, 100; Σ (cell number) of E9.5 = 175, 180, 100]. c Clustering of Isl1 and Nkx2-5 co-expressing cells in Nkx2-5+ and Isl1+ CPC subpopulations. Cells that are not double-positive are labeled in gray, and clusters are indicated by colored circles. d, e Plots showing the predicted diffusion pseudotime of Nkx2-5+ cells projected on t-SNE plots of Isl1+ cells, and the expression of Isl1+ (d) and Nkx2-5+ (e). Expression levels of Isl1 and Nkx2-5 in CPCs are represented by a color spectrum as indicated. EC, endothelial cell. CM, cardiomyocyte
Fig. 4
Fig. 4
Spatial expression pattern of genes identified by scRNA-seq of CPCs. a Heatmap showing expression of selected genes in Isl1+ and Nkx2-5+ CPCs at E8.5. bd In situ hybridization of sections from E8.5 embryos to reveal spatial expression profiles of genes identified by scRNA-seq. Scale bar: 100 μm for (b), 50 μm for (c, d). V: ventricle. PA: primitive atria. PhA: pharyngeal arches. OFT: outflow tract. Arrows indicate positive cells
Fig. 5
Fig. 5
Inactivation of Isl1 prevents CPC fate bifurcation. a Schematic illustration depicting generation of Isl1 embryos and scRNA-seq. b t-SNE plots showing the predicted diffusion pseudotime of Isl1 knockout CPCs projected on Isl1+ cells (left), and clustering with Isl1+ cells (right). c Ratios of cycling and non-cycling Isl1 knockout and wild type Isl1+ CPCs. χ2 test: p = 0.062. n indicates cells numbers. d Heatmap showing expression of deregulated genes in Isl1+ cells at E8.5 and E9.5 (cluster 1, 2, and 5) isolated from Isl1 knockout and control embryos. Source data are provided in the Source Data file
Fig. 6
Fig. 6
Nkx2-5 institutes a unidirectional fate in CPCs to cardiomyocytes. a Re-analysis of published data showing the ratio of smooth muscle cells in embryonic hearts of wild type and Nkx2-5 knockout embryos at E9.5. Smooth muscle cells are scored by low expression of Nkx2-5 (LogTPM < 1, null expression) and high expression of smooth muscle cell genes (Tagln, Cnn1, Acta2, Cald1, Mylk, Hexim1, and Smtnl2 moderate to high (LogTPM > 2) for at least 5 of these 7 genes). χ2 test: p < 2.37e−6. n indicates cells numbers. b Schematic illustration of forced expression of Nkx2-5 in Isl1+ cells and scRNA-seq. c Predicted diffusion pseudotime of Isl1+/Nkx2-5OE cells projected on t-SNE plots of Nkx2-5+ and Isl1+ d CPCs
Fig. 7
Fig. 7
Single cell chromatin accessibility profiles of Isl1+ CPCs. a Representative genomic region showing ATAC-seq tracks of single, aggregate and bulk cells. b, c t-SNE visualization of individual Nkx2-5+ and Isl1+ CPCs to identify subpopulations based on chromatin accessibility. Colors denote corresponding clusters (b), and (c) development stages. d Gene ontology (GO) enrichment analyses of scATAC-seq clusters 1, 2, 5 of Isl1+ CPCs. Each bubble represents one of the top enriched GO terms. The relevant GO terms (p < 0.05, calculated from the hypergeometric distribution) are highlighted
Fig. 8
Fig. 8
Chromatin accessibility of transcription factor binding sites. a t-SNE showing clustering of Z-scores of TF motif accessibility. Colors denote the same clusters as Fig. 7b. b Heatmap showing smoothened Z-scores of TF motif accessibility across defined clusters. Source data are provided in the Source Data file. c, d t-SNE visualization of highlighted single-cells progressing through the inferred (c) cardiomyocyte, (d) endothelial developmental trajectory (red dashed lines). Cells used for inference are colored by Z-scores of TF motif accessibility. All other cells are shown in gray. e Inferred model showing TF dynamics during Isl1+ CPC developmental bifurcation. f, g Smoothened heatmap showing dynamic RNA expression and motif accessibility of indicated TFs during cardiomyocyte (f), endothelial (d) pseudotime trajectories for gene-motif pairs (RNA:ATAC pairs). EC, endothelial cell. CM, cardiomyocyte
Fig. 9
Fig. 9
Chromatin accessibility in CPCs is shaped by Isl1. a Number of differential chromatin accessibility peaks (log2(FC) > 2, false discovery rate [FDR] < 0.05). b Genome-wide distribution of differential open chromatin peaks grouped by K-means (left), and by distance to promoter and K-means (right). Each row represents one differential peak, normalized to sequencing depth, in sequential comparisons (log2[FC] > 2, FDR < 0.05). c Number of differential peaks and their distance to the nearest promoters. d Boxplots of mRNA expression levels in E8.5 and 9.5 Isl1+ CPCs, and of genes that are more accessible (left) or more closed (right) in Isl1 KO cells. Box lines show the median, 25th and 75th percentiles; whiskers represent 5th and 95th percentiles; dots represent outlier data points. p-values were calculated using Student’s t-test. n indicates the genes numbers. e Bubble chart showing the enrichment of transcription factor motifs in differential peaks (p-values were calculated from the hypergeometric distribution)
Fig. 10
Fig. 10
Bulk ATAC-seq analysis of Nkx2-5+ CPCs. a Number of differential chromatin accessibility peaks (log2(FC) > 2, false discovery rate [FDR] < 0.05). b Genome-wide distribution of differential open chromatin peaks grouped by K-means. Each row represents one differential peak, normalized to sequencing depth, in sequential comparisons (log2[FC] > 2, FDR < 0.05). c Distribution of genomic features of differential regulatory elements. d Enrichment of known transcription factor motifs in Isl1+/Nkx2-5OE differential peaks. The height of the letters represents the frequency of each base in the cognate motif. e Principle component analysis (PCA) showing chromatin accessibility features among indicated samples by reducing dimensionality

References

    1. Meilhac SM, Lescroart F, Blanpain C, Buckingham ME. Cardiac cell lineages that form the heart. Cold Spring Harb. Perspect. Med. 2014;4:a013888. doi: 10.1101/cshperspect.a013888. - DOI - PMC - PubMed
    1. Moretti A, et al. Multipotent embryonic isl1+ progenitor cells lead to cardiac, smooth muscle, and endothelial cell diversification. Cell. 2006;127:1151–1165. doi: 10.1016/j.cell.2006.10.029. - DOI - PubMed
    1. Wu SM, et al. Developmental origin of a bipotential myocardial and smooth muscle cell precursor in the mammalian heart. Cell. 2006;127:1137–1150. doi: 10.1016/j.cell.2006.10.028. - DOI - PubMed
    1. Harvey RP. Patterning the vertebrate heart. Nat. Rev. Genet. 2002;3:544–556. doi: 10.1038/nrg843. - DOI - PubMed
    1. Meilhac SM, Esner M, Kelly RG, Nicolas JF, Buckingham ME. The clonal origin of myocardial cells in different regions of the embryonic mouse heart. Dev. Cell. 2004;6:685–698. doi: 10.1016/S1534-5807(04)00133-9. - DOI - PubMed

Publication types

MeSH terms

LinkOut - more resources