. 2018 Nov 19;9(1):4844.
doi: 10.1038/s41467-018-07271-1.

A chromosome-scale assembly of the sorghum genome using nanopore sequencing and optical mapping

Affiliations

A chromosome-scale assembly of the sorghum genome using nanopore sequencing and optical mapping

Stéphane Deschamps et al. Nat Commun. .

Abstract

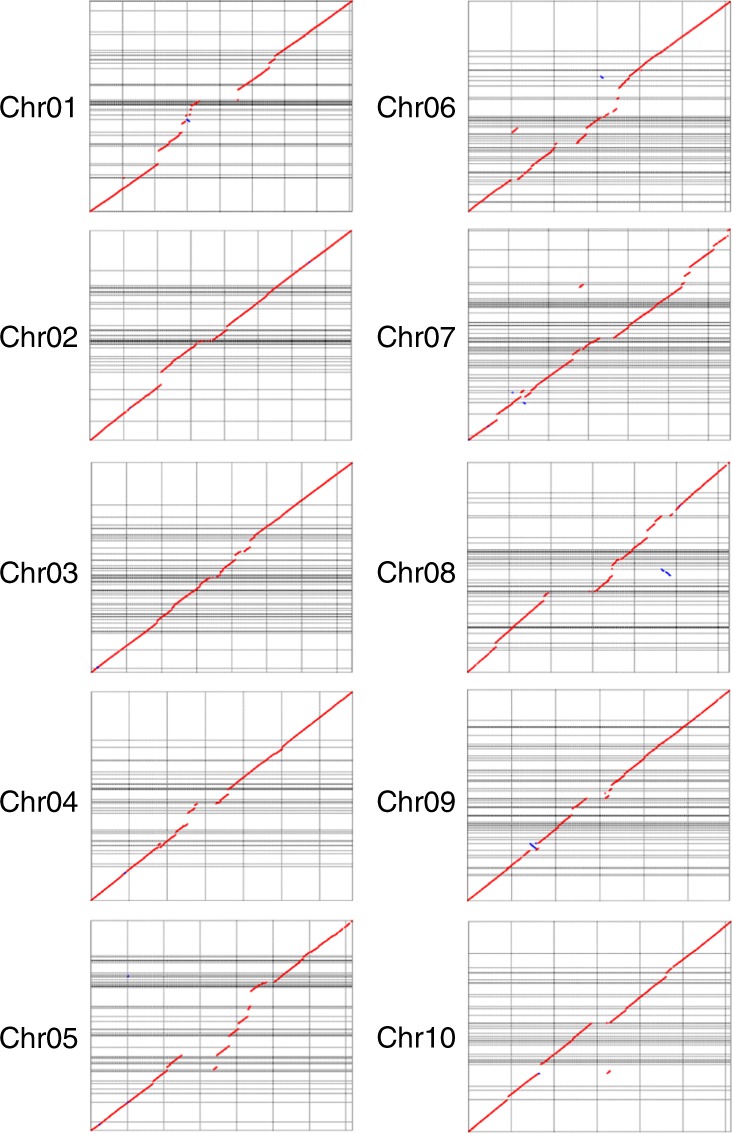
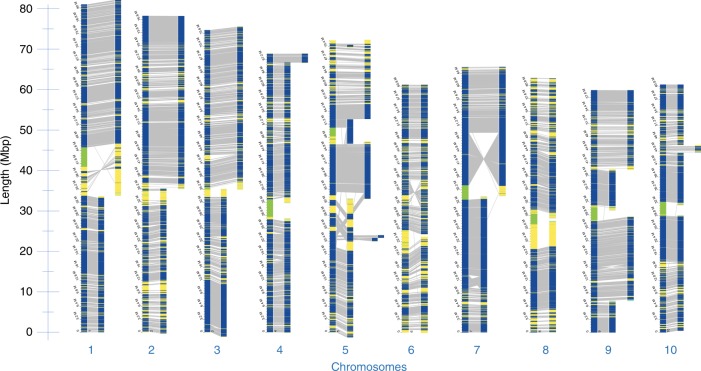
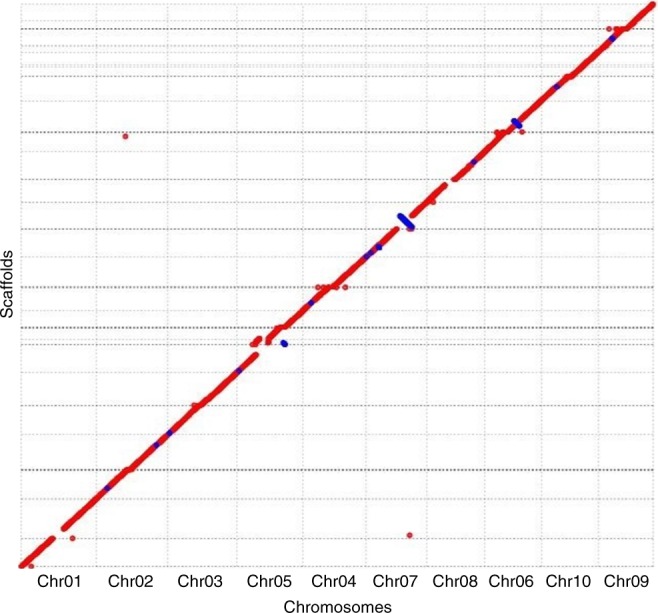
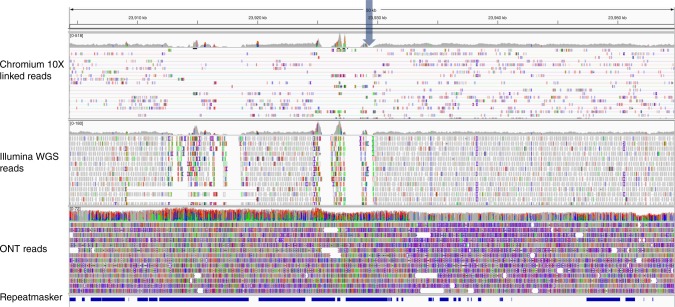
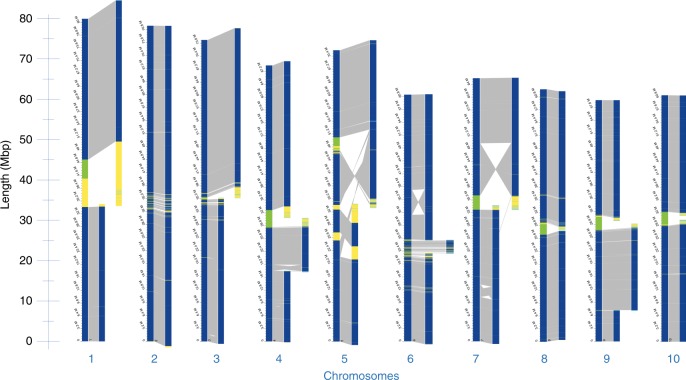
Long-read sequencing technologies have greatly facilitated assemblies of large eukaryotic genomes. In this paper, Oxford Nanopore sequences generated on a MinION sequencer are combined with Bionano Genomics Direct Label and Stain (DLS) optical maps to generate a chromosome-scale de novo assembly of the repeat-rich Sorghum bicolor Tx430 genome. The final assembly consists of 29 scaffolds, encompassing in most cases entire chromosome arms. It has a scaffold N50 of 33.28 Mbps and covers 90% of the expected genome length. A sequence accuracy of 99.85% is obtained after aligning the assembly against Illumina Tx430 data and 99.6% of the 34,211 public gene models align to the assembly. Comparisons of Tx430 and BTx623 DLS maps against the public BTx623 v3.0.1 genome assembly suggest substantial discrepancies whose origin remains to be determined. In summary, this study demonstrates that informative assemblies of complex plant genomes can be generated by combining nanopore sequencing with DLS optical maps.


Conflict of interest statement

The authors declare no competing interests.

Figures

Fig. 1
Fig. 1
MUMmerplot comparison of Tx430 ONT assembly with the BTx623 reference assembly. ONT contigs (Y-axis) (Tx430) were aligned to all 10 chromosomes from the public BTx623 v3.0.1 genome assembly (X-axis) (BTx623) with NUCmer, and results were subsequently filtered for 1-on-1 alignments and rearrangements with a 20 Kbps length cutoff. BTx623 chromosomes are labeled by number and contain multiple megabase-scale regions in the form of unresolved nucleotide sequences
Fig. 2
Fig. 2
Alignment of Tx430 maps against in-silico maps of the BTx623 reference assembly. Collinear DLE-1 markers on the two maps are linked (gray lines). All but three chromosomes are captured by two DLS maps. Large inversions are shown on chromosomes 6 and 7. Regions in green are stretches of random nucleotides in the reference assembly. Regions in yellow exhibit breaks in collinearity between the two maps
Fig. 3
Fig. 3
MUMmerplot comparison of Tx430 hybrid scaffolds with the reference BTx623 assembly. Hybrid scaffolds (Y-axis) were aligned to all 10 BTx623 chromosomes (X-axis) using NUCmer and alignments were subsequently filtered for 1-on-1 alignments and rearrangements with a 20 Kbps length cutoff. Chromosome order on the X-axis is related to the alignment of Tx430 scaffolds mapping to more than one chromosome. Chromosomal inversions and breakage in scaffold orientation in relation to the chromosomal sequence on the X-axis are shown as blue lines
Fig. 4
Fig. 4
Close-up view of one inversion breakpoint area on Chromosome 6. A 50 Kbps region is shown, where Tx430 Chromium 10X linked reads, Tx430 Illumina whole genome shotgun (WGS) reads, individual Tx430 ONT reads aligning to the region and RepeatMasker screening output are shown, from top to bottom. The approximate location of the breakpoint area is marked by an arrow
Fig. 5
Fig. 5
Alignment of BTx623 maps against in-silico maps of the BTx623 reference assembly. Large inversions were detected on chromosomes 6 and 7 after aligning the BTx623 DLS map to in silico maps derived from the v3.0.1 public BTx623 assembly. A third inversion was detected on chromosome 5 while a separate inversion originally detected on chromosome 9 (Fig. 2) was absent in BTx623. Chromosomes are listed in numerical order. Regions in green are stretches of random nucleotides in the reference assembly. Regions in yellow exhibit breaks in collinearity between the two maps

References

    1. Pennisi E. New technologies boost genome quality. Science. 2017;357:10–11. doi: 10.1126/science.357.6346.10. - DOI - PubMed
    1. Zhao G, et al. The Aegilops tauschii genome reveals multiple impacts of transposons. Nat. Plants. 2017;3:946–955. doi: 10.1038/s41477-017-0067-8. - DOI - PubMed
    1. Quick J, Quinlan AR, Loman NJ. A complete bacterial genome assembled de novo using only nanopore sequencing data. Nat. Methods. 2015;12:733–735. doi: 10.1038/nmeth.3444. - DOI - PubMed
    1. Wick RR, Judd LM, Gorrie CL, Holt KE. Completing bacterial genome assemblies with multiplex MinION sequencing. Microb. Genom. 2017;3:e000132. - PMC - PubMed
    1. Risse J, et al. A single chromosome assembly of Bacteroides fragilis strain BE1 from Illumina and MinION Nanopore sequencing data. Gigascience. 2015;4:60. doi: 10.1186/s13742-015-0101-6. - DOI - PMC - PubMed

Publication types