. 2018 Nov 19;9(1):4859.
doi: 10.1038/s41467-018-07253-3.

Age-related declines in α-Klotho drive progenitor cell mitochondrial dysfunction and impaired muscle regeneration

Affiliations

Age-related declines in α-Klotho drive progenitor cell mitochondrial dysfunction and impaired muscle regeneration

A Sahu et al. Nat Commun. .

Abstract

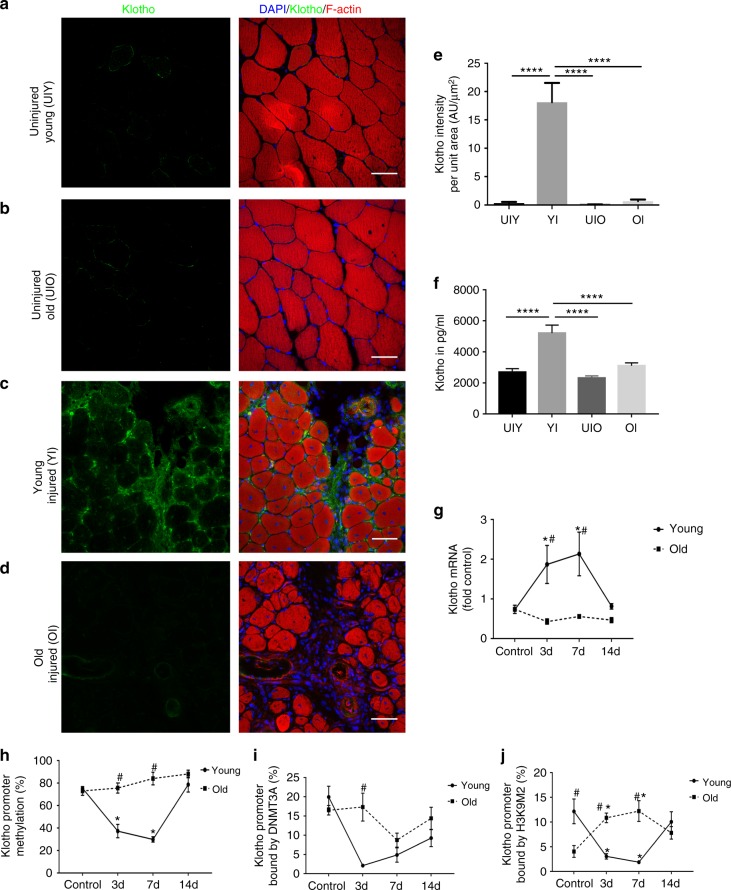
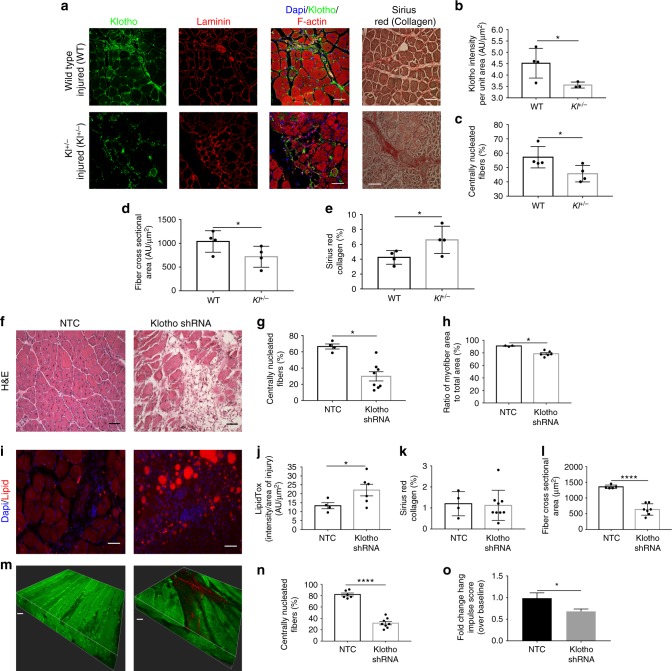
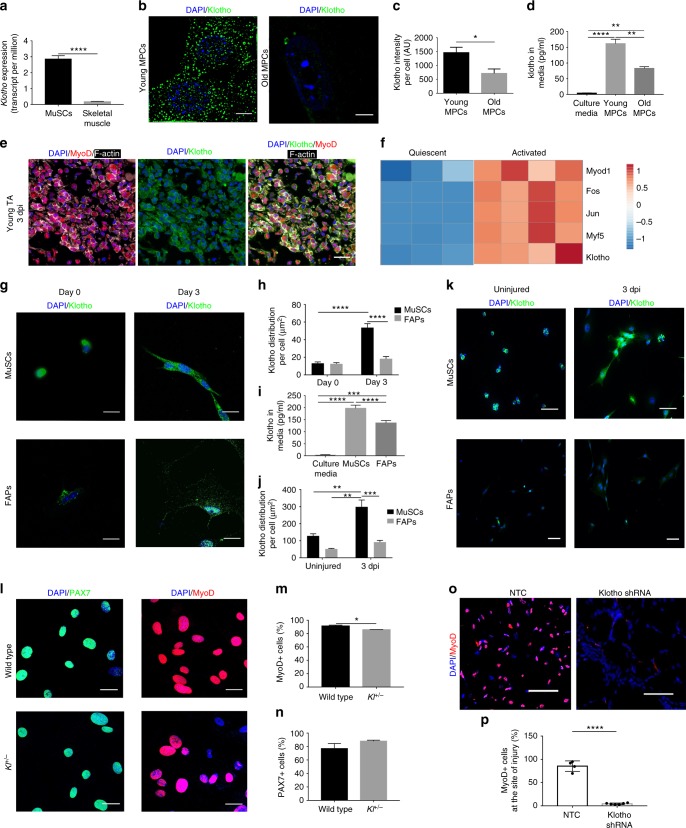
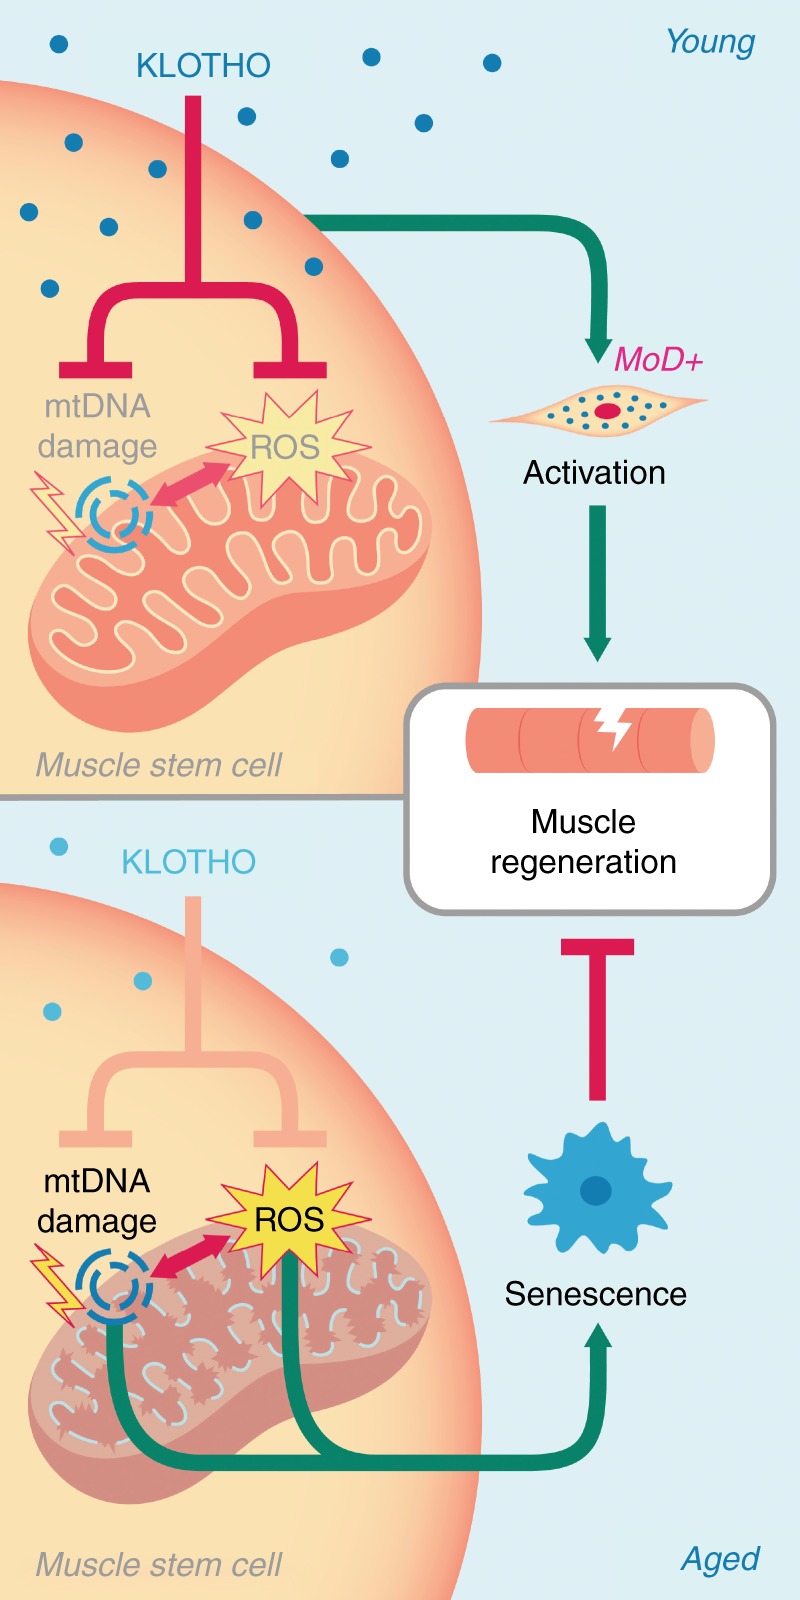
While young muscle is capable of restoring the original architecture of damaged myofibers, aged muscle displays a markedly reduced regeneration. We show that expression of the "anti-aging" protein, α-Klotho, is up-regulated within young injured muscle as a result of transient Klotho promoter demethylation. However, epigenetic control of the Klotho promoter is lost with aging. Genetic inhibition of α-Klotho in vivo disrupted muscle progenitor cell (MPC) lineage progression and impaired myofiber regeneration, revealing a critical role for α-Klotho in the regenerative cascade. Genetic silencing of Klotho in young MPCs drove mitochondrial DNA (mtDNA) damage and decreased cellular bioenergetics. Conversely, supplementation with α-Klotho restored mtDNA integrity and bioenergetics of aged MPCs to youthful levels in vitro and enhanced functional regeneration of aged muscle in vivo in a temporally-dependent manner. These studies identify a role for α-Klotho in the regulation of MPC mitochondrial function and implicate α-Klotho declines as a driver of impaired muscle regeneration with age.


Conflict of interest statement

M.F. is an employee of Boehringer Ingelheim Pharmaceutical Company. The remaining authors declare no competing interests.

Figures

Fig. 1
Fig. 1
α-Klotho is increased in young muscle after injury, but the response is lost  with increased age. ad Immunofluorescent imaging of α-Klotho and F-actin in skeletal muscle from uninjured young (UIY; 4–6 months) and old mice (UIO; 22–24 months) as well as 14 days post injury (dpi) in young (YI) and old (OI) mice. Scale: 50 µm. e Quantification of α-Klotho across the four comparison groups, UIY, UIO, YI, and OI. Experimental cohorts were performed in duplicate, n = 3/group/cohort. ****p < 0.0001. f ELISA analysis of serum obtained from UIY, UIO, YI, and OI mice (n = 8–11/group; ****p < 0.0001). g RT-qPCR analysis of α-Klotho in young and old muscles at 0 (control), 3, 7, and 14 dpi (n = 4/age/timepoint). h MSPCR analysis of young and old muscle at 0 (control), 3, 7, and 14 dpi (n = 4/age/timepoint). i ChIP analysis of DNMT3a in young and old muscle at 0 (control), 3, 7, and 14 dpi (n = 3-4/age/timepoint). j ChIP analysis of H3K9me2 in the Klotho promoter in young and old muscle at 0 (control), 3, 7, and 14 dpi (n = 4/age/timepoint) (*p< 0.05 compared to young, sex-matched uninjured muscles; #p< 0.05 indicates a significant difference between young and aged groups at the respective timepoint). eg One-way ANOVA with Tukey’s post-hoc test. hj Two-way ANOVA with Tukey’s post-hoc test. Data represented as mean ± SEM
Fig. 2
Fig. 2
Genetic and muscle-specific loss of α-Klotho impairs skeletal muscle regeneration. a Immunofluorescence of α-Klotho, laminin, F-actin, and Sirius red stain in wild-type and Kl+/− mice 14 dpi. Scale: 50 µm. b Quantitation of α-Klotho in wild-type versus Kl+/− mice 14 dpi (n = 3–4/group; *p < 0.05, one-tailed Student’s t test). ce Quantitation of the % of centrally nucleated fibers (n = 4/group; *p< 0.05, Mann−Whitney U test), fiber cross-sectional area (n = 4/group; *p< 0.05, one-tailed Student’s t test) and collagen (Sirius red) deposition (n = 4/group; *p< 0.05, Welchʼs t test). f Representative hematoxylin and eosin stain of non-targeting control (NTC) and shRNA to α-Klotho (0.2–3.82×10⁶ TU/TA) Scale: 50 µm. g, h Quantification of the % centrally nucleated fibers and ratio of myofiber area to total area, respectively, in NTC and Klotho shRNA-treated mice at 14 dpi (n = 3–8/group; *p< 0.05, Mann−Whitney U test). i Representative immunofluorescence imaging of lipid in NTC and α-Klotho shRNA-treated muscle at 14 dpi. Scale: 50 µm. j Quantification of lipid in NTC and Klotho shRNA-treated muscle 14 dpi (n = 4–6/group; *p< 0.05, one-tailed Student’s t test). k Quantification of collagen deposition (Sirius red) in NTC and Klotho shRNA groups (n = 4–9/group; p > 0.05, Student’s t test). l Quantification of fiber cross-sectional area of regenerating muscle fibers in NTC and α-Klotho shRNA-treated muscle (n = 5–7/group; ****p < 0.0001, one-tailed Student’s t test). m Representative second harmonic generation (SHG) images of tibialis anterior (TA) muscles injected with NTC or α-Klotho shRNA. Scale: 30 µm. n SHG quantification of the regeneration index in NTC and Klotho shRNA-treated mice at 14 dpi (n = 6–8/group; ****p < 0.0001, one-tailed Student’s t test). o Hang impulse (calculated as hanging time × mouse weight) at 14 dpi represented as a fold  change from baseline score pre-injury (n = 6/group; *p< 0.05, one-tailed Student’s t test). Data represented as mean ± SEM
Fig. 3
Fig. 3
α-Klotho expression in quiescent and activated MuSCs. a Klotho expression in isolated MuSCs versus whole muscle lysates as per RNAseq analysis in transcripts per million (TPM) (n = 4/group; ****p < 0.0001, one-tailed Student’s t test). b Representative structured illuminescent microscopy of α-Klotho in young and old MPCs. Scale: 5 µm. c Quantification of α-Klotho in young and old MPCs (*p< 0.05, one-tailed Student’s t test). d ELISA analysis of α-Klotho in culture media alone, as well as conditioned media from young and old MPCs (n = 3/group; **p < 0.01, ****p < 0.0001, one-way ANOVA with Tukey’s post-hoc test). e Immunofluorescent colocalization of MyoD, F-actin, and α-Klotho 3 dpi. Scale: 50 µm. f Heat-map representation of α-Klotho as well as markers of MuSC activation (MyoD1, Fos, Jun, Myf5) in quiescent and activated cells from RNASeq analysis of publicly archived data from a recent report. g Immunofluorescence staining of α-Klotho and DAPI in sorted MuSCs and fibroadipogenic progenitors (FAPs) fixed immediately after isolation (Day 0) or after activation in culture (Day 3). Scale: 12.5 µm. h Quantification of α-Klotho expression in MuSCs and FAPs at Day 0 and Day 3 of culture (****p < 0.0001, two-way ANOVA with Tukey’s post-hoc test). i Quantification of α-Klotho in the conditioned media of MuSCs and FAPs sorted from uninjured muscle. Conditioned media was obtained after 3 days in culture (n = 3/group; ****p < 0.0001, one-way ANOVA with Tukey’s post-hoc test). j Quantification of α-Klotho in MuSCs and FAPs isolated from uninjured muscle and muscle 3 dpi (**p < 0.01, ***p < 0.001, two-way ANOVA with Tukey’s post-hoc test). k Immunofluorescence imaging of α-Klotho and DAPI in MuSCs and FAPs sorted from uninjured muscle and muscle 3 dpi. Scale: 50 µm. l Immunofluorescent imaging of Pax7 and MyoD in MPCs isolated from wild-type and Kl+/− mice. Scale: 50 µm. m Quantification of the % of MyoD+ cells in MPCs from wild-type and Kl+/− mice (*p< 0.05, one-tailed Student’s t test). n Quantification of the % of Pax7+ cells in MPCs from wild-type and Kl+/− mice (One-tailed Student’s t test). o Immunofluorescent imaging of MyoD and DAPI in the injured muscles of nontargeting control (NTC) and shRNA to α-Klotho 14 dpi. Scale: 25 µm. p Quantification of the percentage of MyoD+ nuclei within the injured muscles of nontargeting control (NTC) and shRNA to α-Klotho 14 dpi (n = 4–6/group; ****p < 0.0001, one-tailed Student’s t test). Data represented as mean ± SEM
Fig. 4
Fig. 4
Loss of α-Klotho drives mitochondrial dysfunction and disrupts mitochondrial DNA integrity. a TEM images of young, old, young + scramble and young + siRNA MPCs showing mitochondria (M), lipid droplet accumulation (L), as well as endoplasmic reticuli (ER). Scale: 400 nm. b, c Seahorse analysis of young, old, young + scramble and young + siRNA MPCs quantifying the basal oxygen consumption rate (OCR). d Seahorse analysis of basal OCR of MPCs isolated from wild-type and Kl+/− mice. e, f Seahorse analysis of reserve capacity (calculated as the difference between basal and maximum OCR) of young, old, young + scramble and young + siRNA MPCs. g Seahorse analysis of reserve capacity of MPCs isolated from wild-type and Kl+/− mice. h, i RT-qPCR based analysis of mtDNA damage in young, old, young + scramble and young + siRNA MPCs. j RT-qPCR analysis of mtDNA damage in MPCs isolated from wild-type and Kl+/− mice (*p < 0.05, **p < 0.01, ****p < 0.0001, one-tailed Student’s t test). Data represented as mean ± SEM
Fig. 5
Fig. 5
Mitochondrial structure and function are impaired in Kl+/− mice, but are rescued with SS-31. a, b Representative TEM images and analysis of damaged mitochondria of wild-type (WT), Kl+/− and Kl+/−+ SS-31 groups (10–20 images were analyzed to quantify >100 mitochondria/group; ****p < 0.0001, one-way ANOVA with Tukey’s post-hoc test). Scale: 500 nm. c, d Representative immunofluorescent images and quantification of cardiolipin content, by Nonyl Acridine Orange staining (NAO, green) in WT, Kl+/− and Kl+/−+ SS-31 MPCs (*p< 0.05, one-way ANOVA with Tukey’s post-hoc test). Scale: 50 µm. e, f Representative immunofluorescent images from live imaging and quantification of ROS as determined by MitoSox staining (red) on live cells from WT, Kl+/− and Kl+/−+ SS-31 groups (****p < 0.0001, one-way ANOVA with Tukey’s post-hoc test). Scale: 50 µm. g RT-qPCR-based analysis of mtDNA damage on WT, Kl+/− and Kl+/−+ SS-31 MPCs (n = 3/group; *p< 0.05, one-way ANOVA with Tukey’s post-hoc test). h, i Seahorse analysis of basal OCR and reserve capacity of WT, Kl+/− and Kl+/−+ SS-31 MPCs (n = 4–6/group; *p< 0.05, one-way ANOVA with Tukey’s post-hoc test). j, k Quantification of MyoD+ cells at the site of injury of TA muscles from WT, Kl+/− and Kl+/−+ SS-31 groups (n = 3–6/group; ***p < 0.001, one-way ANOVA with Tukey’s post-hoc test). Scale: 25 µm. l, m Representative SHG images and analysis of the percentage of centrally nucleated fibers from WT, Kl+/− and Kl+/−+ SS-31 mice at 14 dpi (n = 3–4/group; *p< 0.05, **p < 0.01, one-way ANOVA with Tukey’s post-hoc test). Scale: 50 µm. n Quantification of myofiber cross-sectional area from WT, Kl+/− and Kl+/−+ SS-31 groups (n = 3–4/group; *p< 0.05, **p < 0.01, one-way ANOVA with Tukey’s post-hoc test). o Hang impulse (calculated as hanging time × mouse weight) at 14 dpi, represented as a fold-change from 1 dpi score during the wire hang test (n = 3–6/group; *p< 0.05, ***p < 0.001, two-way ANOVA with Tukey’s post-hoc test). Each mouse was used as its own control in order to account for baseline variability (shown in Supplementary Figure 8). Data represented as mean ± SEM
Fig. 6
Fig. 6
α-Klotho supplementation improves aged MPC bioenergetics and muscle regeneration. a RT-qPCR-based analysis of mtDNA damage in old and MPCs and in old MPCs that received supplementation with recombinant α-Klotho in the culture medium for 48 h (n = 3/group; *p< 0.05, one-tailed Student’s t test). b, c Seahorse analysis of basal OCR and reserve capacity of age and aged+ α-Klotho MPCs (n = 6–8/group; **p < 0.01). d, e Representative immunofluorescent images and quantification of α-Klotho expression in aged muscle 14 dpi after systemic supplementation of α-Klotho via an osmotic pump, as compared to saline-infused control muscles (n = 5/group; ****p< 0.0001). Scale: 50 µm. f Quantification of the percentage of centrally nucleated fibers as per histological analysis across saline and α-Klotho infused animals 14 dpi (n = 3/group; *p< 0.05). g, h Representative SHG imaging and quantification of the percentage of centrally nucleated fibers of saline versus α-Klotho infused animals at 14 dpi (n = 5–6/group; *p< 0.05). Scale: 35 µm. i, j Representative images and quantification of MyoD+ cells at the site of injury 14 dpi in animals receiving osmotic pump delivery of saline or α-Klotho (n = 5/group; ***p< 0.001). Scale: 25 µm. k Representative immunofluorescent images showing laminin and DAPI in animals receiving i.p. administration of saline, α-Klotho 1–3 dpi, and α-Klotho 3–5 dpi. Scale: 50 µm. l Quantification of percentage of centrally nucleated fibers in aged animals receiving i.p. administration of saline, α-Klotho 1–3 dpi, and α-Klotho 3–5 dpi (n = 4/group; *p< 0.05, **p < 0.01). m Quantification of fiber cross-sectional area across the three i.p. injection groups (n = 4/group; ***p < 0.001, ****p < 0.0001). n Fold change hang impulse score over baseline scores across the three i.p. injection groups (n = 6/group). o Force-frequency curves obtained from in situ contractile testing analysis of specific force (n = 6–8/group, *p < 0.05 when comparing α-Klotho 3–5 dpi with saline control, #p < 0.05 when comparing α-Klotho 3–5 dpi with α-Klotho 1–3 dpi group; two-way ANOVA with repeated measures). aj One-tailed Student’s t test. kn One-way ANOVA with Tukey’s post-hoc test. Data represented as mean ± SEM
Fig. 7
Fig. 7
Hypothesis schematic. Youthful levels of the circulating hormone α-Klotho are critical for the maintenance of muscle stem cell (MuSC) mitochondrial ultrastructure, thereby limiting mtDNA damage and mitochondrial ROS production. This maintenance of healthy mitochondria within MuSCs is required for MuSC activation and contribution to functional skeletal muscle regeneration. However, age-related declines in α-Klotho causes disrupted mitochondrial ultrastructure, increased mtDNA damage, and ROS accumulation, resulting in cellular senescence and impaired skeletal muscle regeneration

Similar articles

Cited by

References

    1. Brack AS, et al. Increased Wnt signaling during aging alters muscle stem cell fate and increases fibrosis. Science. 2007;317:807–810. doi: 10.1126/science.1144090. - DOI - PubMed
    1. Schultz E. Satellite cell behavior during skeletal muscle growth and regeneration. Med. & Sci. Sports & Exerc. 1989;21(5 Suppl):S181–S186. - PubMed
    1. Schultz E, Gibson MC, Champion T. Satellite cells are mitotically quiescent in mature mouse muscle: an EM and radioautographic study. J. Exp. Zool. 1978;206:451–456. doi: 10.1002/jez.1402060314. - DOI - PubMed
    1. Ryall JG, Schertzer JD, Lynch GS. Cellular and molecular mechanisms underlying age-related skeletal muscle wasting and weakness. Biogerontology. 2008;9:213–228. doi: 10.1007/s10522-008-9131-0. - DOI - PubMed
    1. Conboy IM, Conboy MJ, Smythe GM, Rando TA. Notch-mediated restoration of regenerative potential to aged muscle. Science. 2003;302:1575–1577. doi: 10.1126/science.1087573. - DOI - PubMed

Publication types

MeSH terms