. 2018 Nov 19;9(1):4878.
doi: 10.1038/s41467-018-07318-3.

Flow of cerebrospinal fluid is driven by arterial pulsations and is reduced in hypertension

Affiliations

Flow of cerebrospinal fluid is driven by arterial pulsations and is reduced in hypertension

Humberto Mestre et al. Nat Commun. .

Abstract

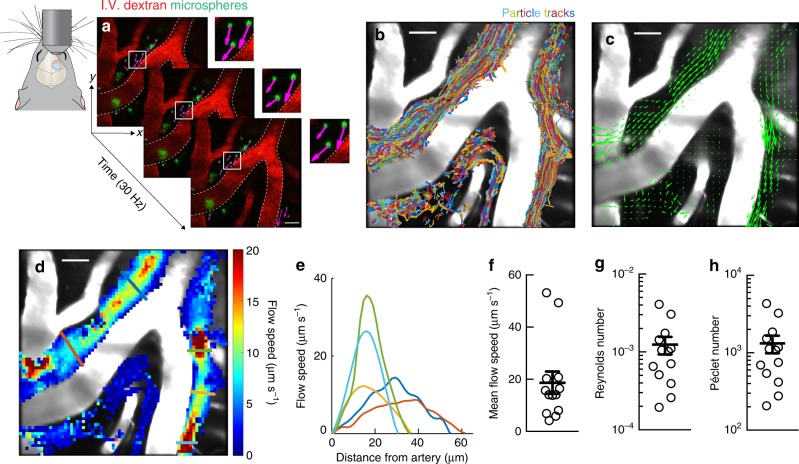
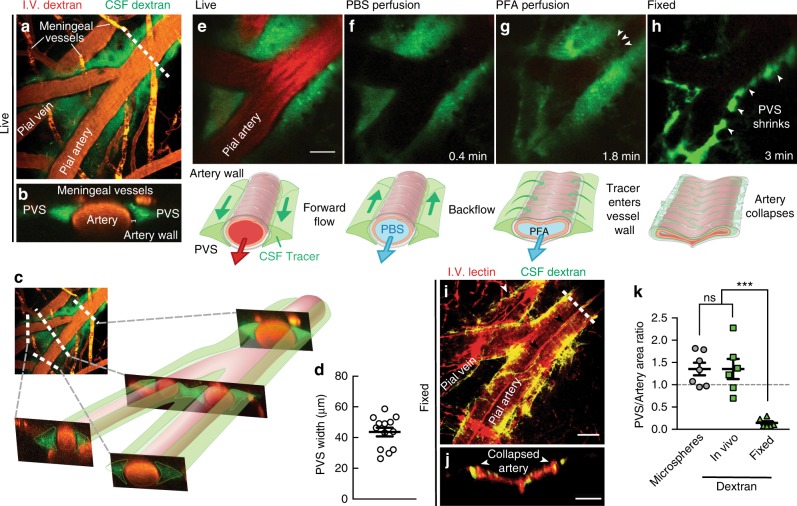
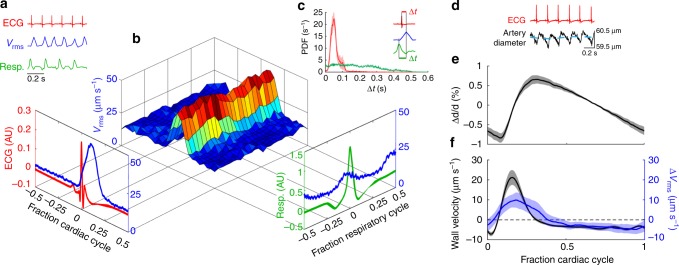
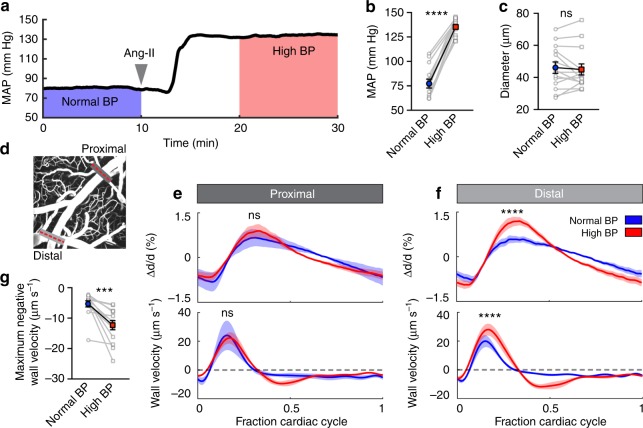
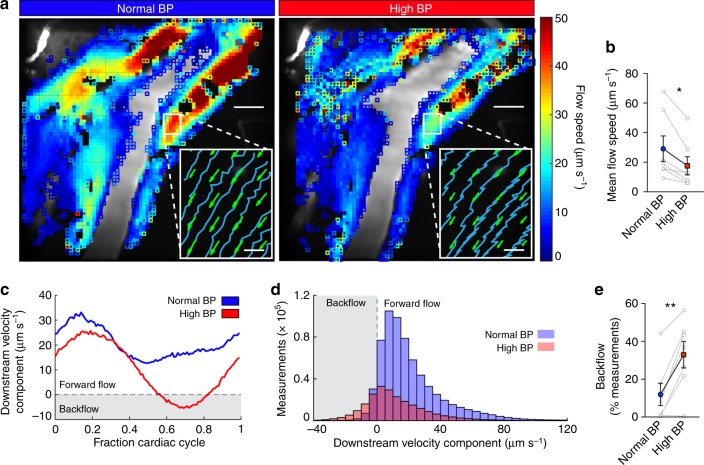
Flow of cerebrospinal fluid (CSF) through perivascular spaces (PVSs) in the brain is important for clearance of metabolic waste. Arterial pulsations are thought to drive flow, but this has never been quantitatively shown. We used particle tracking to quantify CSF flow velocities in PVSs of live mice. CSF flow is pulsatile and driven primarily by the cardiac cycle. The speed of the arterial wall matches that of the CSF, suggesting arterial wall motion is the principal driving mechanism, via a process known as perivascular pumping. Increasing blood pressure leaves the artery diameter unchanged but changes the pulsations of the arterial wall, increasing backflow and thereby reducing net flow in the PVS. Perfusion-fixation alters the normal flow direction and causes a 10-fold reduction in PVS size. We conclude that particle tracking velocimetry enables the study of CSF flow in unprecedented detail and that studying the PVS in vivo avoids fixation artifacts.


Conflict of interest statement

The authors declare no competing interests.

Figures

Fig. 1
Fig. 1
CSF in the perivascular space is transported via bulk flow. CSF flow was imaged in live mice through a cranial window using two-photon microscopy. To visualize the CSF, fluorescent microspheres were infused into the cisterna magna. a Images for particle tracking velocimetry were acquired at 30 Hz. Blood vessels were labeled with an intravenous (i.v.) dextran, while microspheres appear green; (inset) the magenta arrows show the instantaneous velocity of each microsphere. b Superimposed trajectories of tracked microspheres show that particles are transported primarily within large PVSs. Scale bar: 40 µm. c The time-averaged velocity field (green arrows) shows that net transport is in the same direction as the blood flow. d The local time-averaged flow speed shows that the interior region of the arterial bifurcation is nearly stagnant. Scale bars: 40 µm. e Average flow speed profiles plotted as a function of distance from the arterial wall. Colored lines in d indicate the location of each profile. f Mean flow speeds, g Reynolds, and h Péclet numbers for the time-averaged flow, mean ± SEM, n = 13 mice
Fig. 2
Fig. 2
Perivascular spaces (PVSs) are larger in vivo and collapse after fixation. a Fluorescent dextran in the CSF confirms the size of the PVS in vivo. b Cross-section at the dashed line in a, showing two PVSs with tracer. c Cross-sections proximal, across, and distal to a bifurcation show that the non-connecting PVS structure continues. d Average measurements of the width of the PVS from superimposed microsphere trajectories (e.g., Fig. 1b). Mean ± SEM, n = 13 mice. e To test whether the PVS and CSF tracer distribution were modified during tissue processing, we perfusion fixed a live anesthetized mouse with f phosphate-buffered saline (PBS) followed by g 4% paraformaldehyde (PFA) to h fix the tissue (Supplementary Movie 1). Diagrams are included below each image indicating our observations. Scale bar: 30 µm. i The vasculature was labeled with a lectin in the PBS perfusion solution and the same vessel in the same animal shown in a was imaged after fixation. It was necessary to remove dura to image the same vessels in situ due to the shrinkage of the brain. Small arrows point to a fold in the collapsed artery wall and tracer being redistributed around a pial vein. Overlapping lectin and dextran appear yellow. Scale bar: 40 µm. j Cross-section at the dashed line in i shows that after fixation, the vessel collapses and folds, and the tracer redistributes around the arterial wall. Scale bar: 20 µm. k To quantify the size of the PVS compared to that of the artery, we computed the ratios of the areas of the PVS and the adjacent artery for in vivo measurements utilizing tracked microspheres and dextran dye and after fixation (fixed). The lateral area of the PVS is roughly 1.4 ± 0.1 times larger than that of the artery itself in the live mice, and fixation reduces this ratio to about 0.14 ± 0.04. One-way analysis of variance (ANOVA) post hoc Tukey's test, ***P < 0.0002, ns not significant, mean ± SEM, n = 6–7/group
Fig. 3
Fig. 3
CSF in the perivascular space is pumped by arterial wall motions. a Representative traces of ECG (red curve), root-mean-square velocity vrms (blue curve), and respiration (green curve). b The vrms conditionally averaged over the cardiac and respiratory cycles. The protruding plots show vrms averaged over the cardiac (left) or respiratory (right) cycle alone. c (inset) An example illustrating how Δt, the delay time between adjacent peaks in the vrms and ECG/respiration, is calculated. Average probability density functions of Δt for ECG (red) and respiration (green), with shaded regions indicating standard error of the mean (SEM). While there is no clear trend for the occurrence of a peak in vrms after a respiration peak, the vrms peaks are most likely to occur soon after an ECG peak. d Synchronized measurements of the ECG (red curve) and artery diameter (black curve), obtained from transversal line scans of the pial arteries; the blue dashed line is a rolling average of the artery diameter. e The normalized average change in the artery diameter (i.e., the shape of the arterial wall traveling wave) averaged over the cardiac cycle. Mean ± SEM, n = 7 mice. f The arterial wall velocity (black curve) obtained by calculating the average derivative of the change in artery diameter over the cardiac cycle, and Δvrms (blue curve) obtained by calculating the difference in vrms from its mean over the cardiac cycle. Mean ± SEM, n = 7 mice. The maximum arterial wall velocity (21.2 ± 3.7 µm s−1, n = 7) agrees well with the peak Δvrms value (9.9 ± 3.8 µm s−1, n = 8) and occurs 34.5 ± 7.4 ms after the ECG peak, indicating that perivascular pumping is most likely the principal driving mechanism
Fig. 4
Fig. 4
Acute arterial hypertension changes vessel wall dynamics. a We induced acute arterial hypertension with an intravenous infusion of angiotensin-II (Ang-II). b Average blood pressure over the two intervals indicated in (a). Ang-II increased mean arterial blood pressure (MAP) by 75% (77.1 ± 4.5 to 134.9 ± 2.2 mm Hg). Paired t-test, ****P < 0.0001, mean ± SEM, n = 15 mice. c Average artery diameter before and after Ang-II infusion. Paired t-test, P = 0.5500, ns not significant, mean ± SEM, n = 14 (2 arteries/7 mice). d Line scans to quantify artery diameter were acquired at a proximal location of the pial artery and at a distal location before and after Ang-II infusion (gray lines). e, f The average change in artery diameter (top panel) and the average arterial wall velocity (bottom panel) in normal and high blood pressure, measured at the e proximal (dark gray) and f distal (light gray) locations indicated in d. Inducing high blood pressure alters the form of the arterial traveling wave and makes arteries expand and contract faster; the effects are more prominent at more distal locations. Two-way repeated measures ANOVA. ***P < 0.0001, ns not significant, mean ± SEM. g High blood pressure increases maximum negative wall velocity. Paired t-test, P = 0.0003, mean ± SEM, n = 14 (2 arteries/7 mice)
Fig. 5
Fig. 5
Acute arterial hypertension reduces net CSF flow in the perivascular space by increasing backflow. a Local time-averaged flow speeds for the normal and high blood pressure time intervals. Closed squares indicate regions with at least 20 measurements, open squares fewer than 20. The flow speed is substantially reduced in hypertension. Scale bars: 40 µm. (Insets) Sample microsphere trajectories (blue curves) and mean flow velocities (green arrows) in the region indicated by the white box. Microsphere trajectories show increased backflow in hypertension. Scale bars: 5 µm. b Measurements of the mean flow speed for normal and high blood pressure. Paired t-test, *P = 0.0119, mean ± SEM, n = 7. c The average downstream velocity component plotted as a function of the fraction of the cardiac cycle, averaged over all velocity measurements obtained in a small region, for normal and high blood pressure (measurements correspond to the mouse shown in a). Hypertension is characterized by backflow over a short segment of the cardiac cycle. d Histograms of the downstream velocity component computed for intervals of normal and high blood pressure for the mouse shown in a. We obtain fewer high blood pressure measurements (2.3 × 105, compared to 6.6 × 105 for normal blood pressure) because slower flow brings fewer particles into the field of view. The distribution shifts left indicating an increase in backflow when blood pressure is high. e The percent of total measurements which correspond to backflow (i.e., negative measurements of the downstream velocity component) calculated for normal and high blood pressure. Paired t-test, **P = 0.0035, mean ± SEM, n = 7. In hypertension, slower net flow and increased backflow are consistent with an alteration of the perivascular pump, characterized by the changes to the arterial waveform and wall velocity

References

    1. Iliff JJ, et al. A paravascular pathway facilitates CSF flow through the brain parenchyma and the clearance of interstitial solutes, including amyloid beta. Sci. Transl. Med. 2012;4:147ra111. doi: 10.1126/scitranslmed.3003748. - DOI - PMC - PubMed
    1. Brinker T, Stopa E, Morrison J, Klinge P. A new look at cerebrospinal fluid circulation. Fluids Barriers CNS. 2014;11:10. doi: 10.1186/2045-8118-11-10. - DOI - PMC - PubMed
    1. Morris AW, et al. Vascular basement membranes as pathways for the passage of fluid into and out of the brain. Acta Neuropathol. 2016;131:725–736. doi: 10.1007/s00401-016-1555-z. - DOI - PMC - PubMed
    1. Bakker EN, et al. Lymphatic clearance of the brain: perivascular, paravascular and significance for neurodegenerative diseases. Cell. Mol. Neurobiol. 2016;36:181–194. doi: 10.1007/s10571-015-0273-8. - DOI - PMC - PubMed
    1. Abbott NJ. Evidence for bulk flow of brain interstitial fluid: significance for physiology and pathology. Neurochem. Int. 2004;45:545–552. doi: 10.1016/j.neuint.2003.11.006. - DOI - PubMed

Publication types

MeSH terms

Substances