. 2018 Nov 19;9(1):4883.
doi: 10.1038/s41467-018-07329-0.

Invasive Salmonella exploits divergent immune evasion strategies in infected and bystander dendritic cell subsets

Affiliations

Invasive Salmonella exploits divergent immune evasion strategies in infected and bystander dendritic cell subsets

Anna Aulicino et al. Nat Commun. .

Abstract

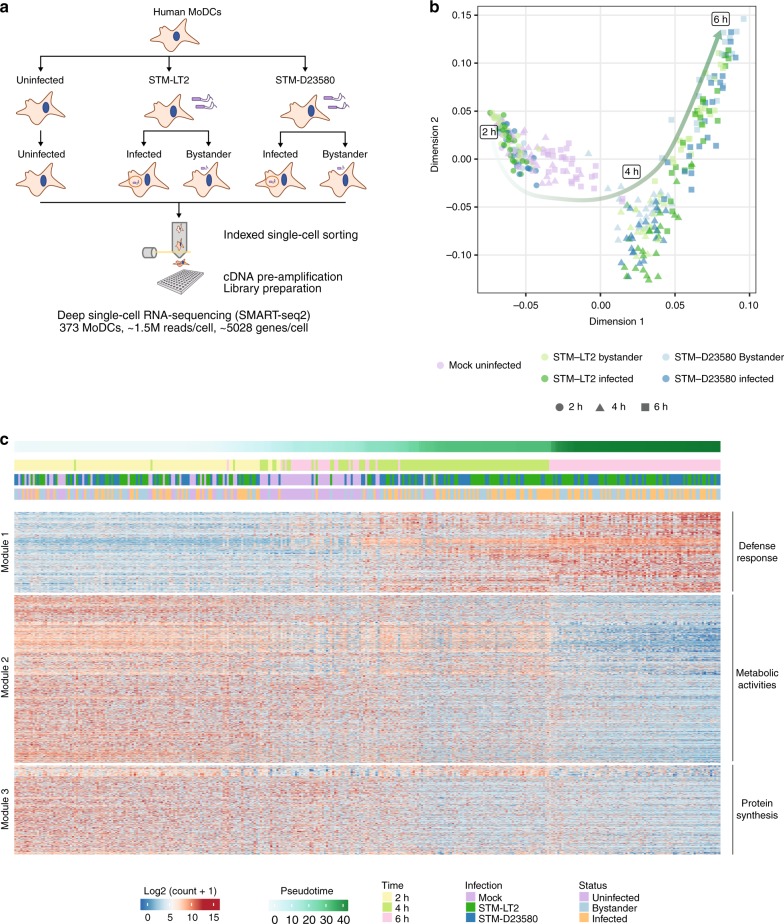
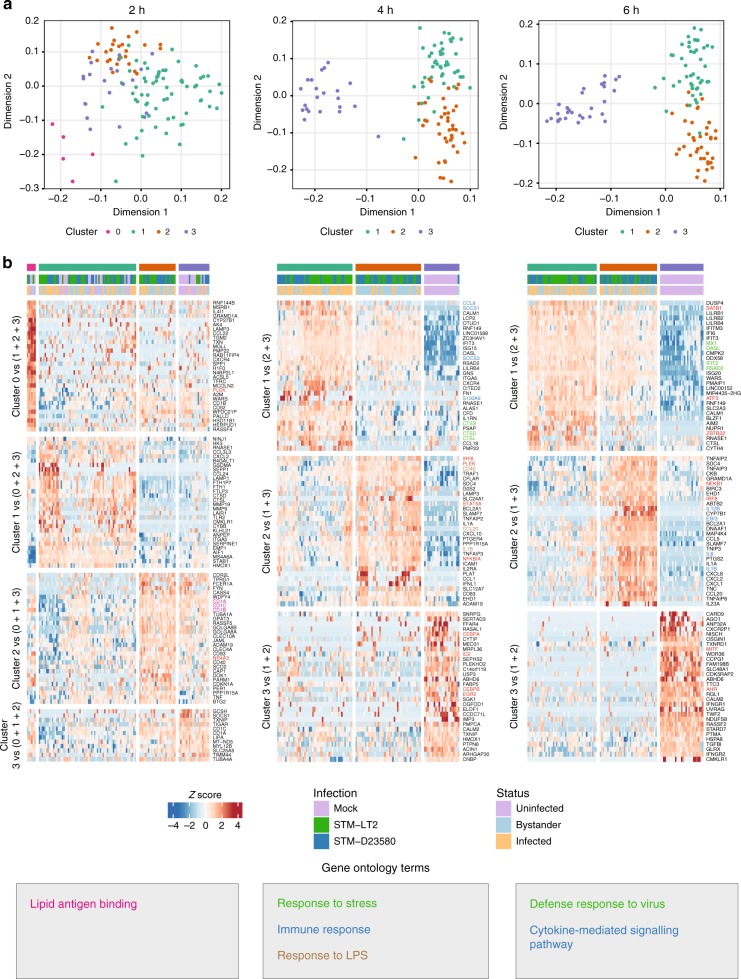
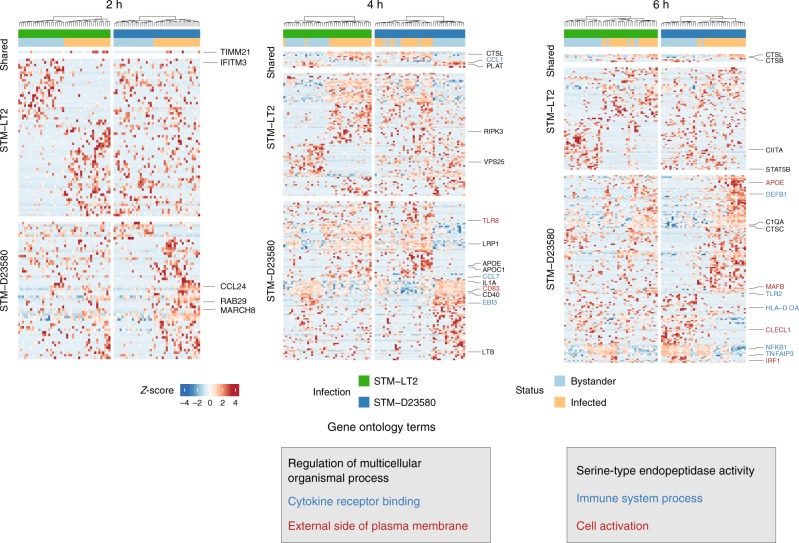
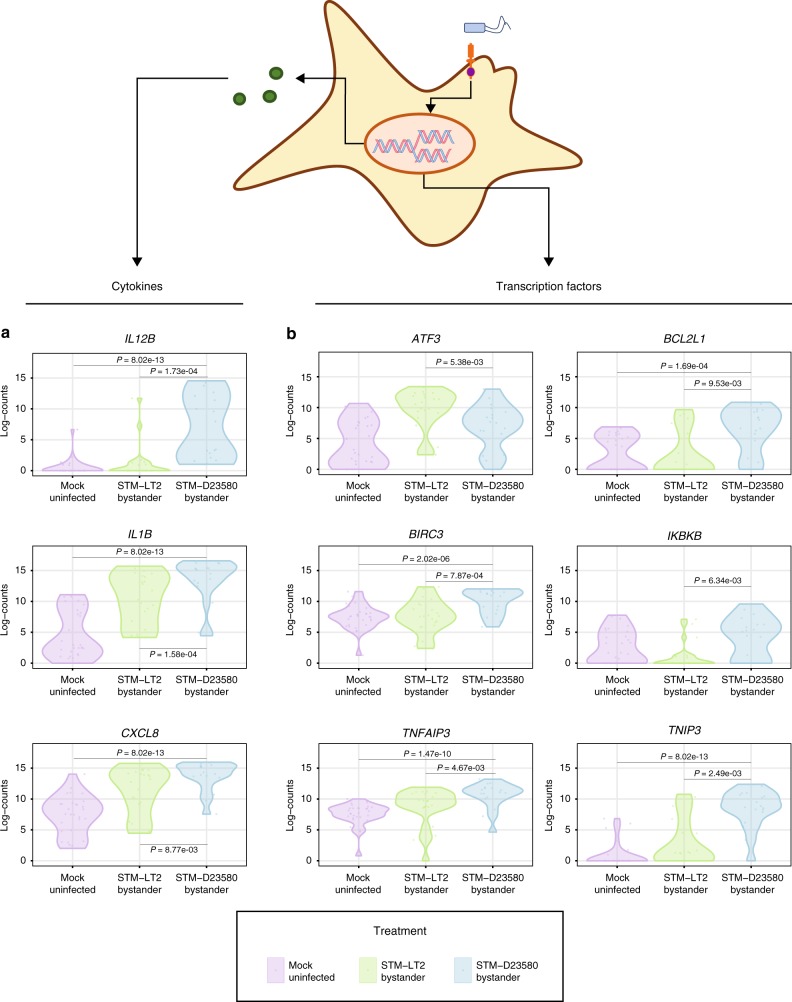
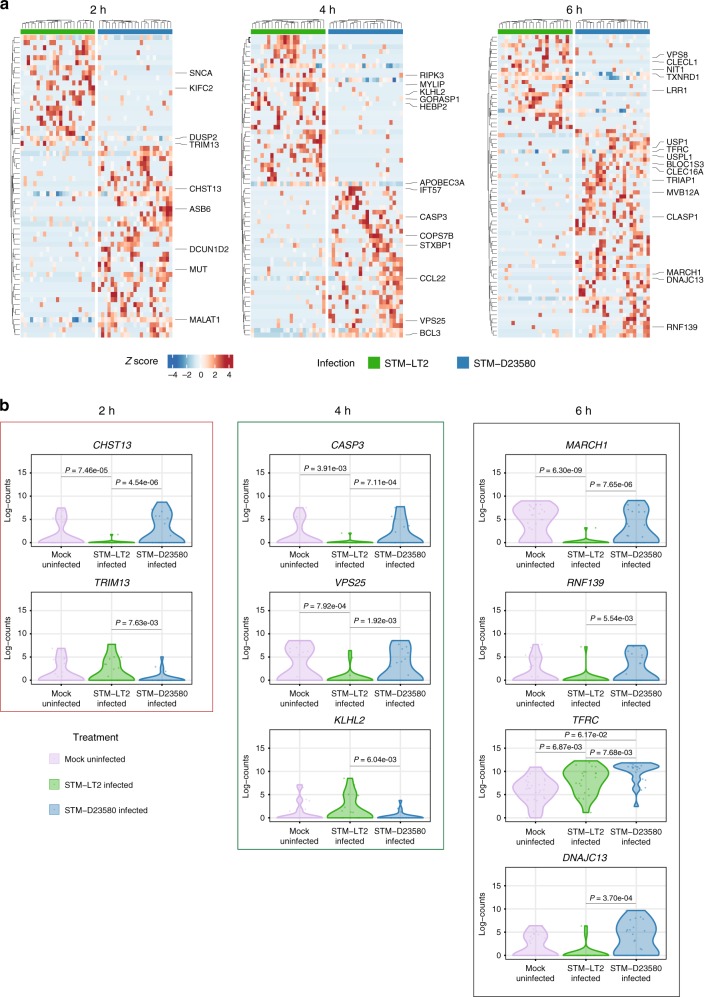
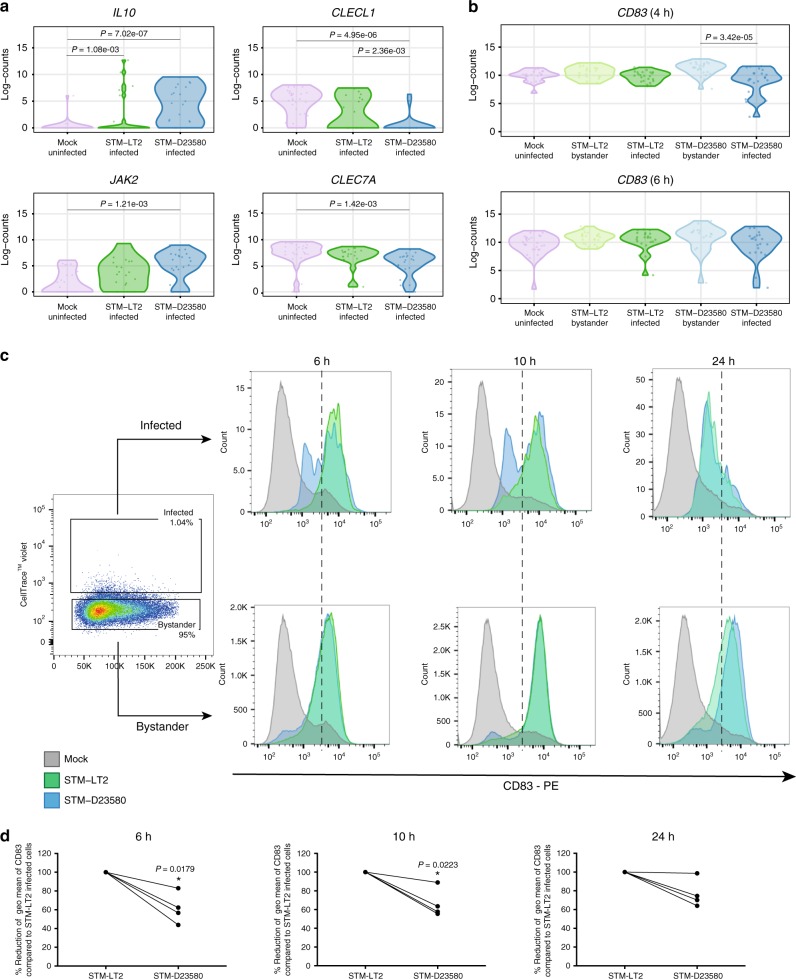
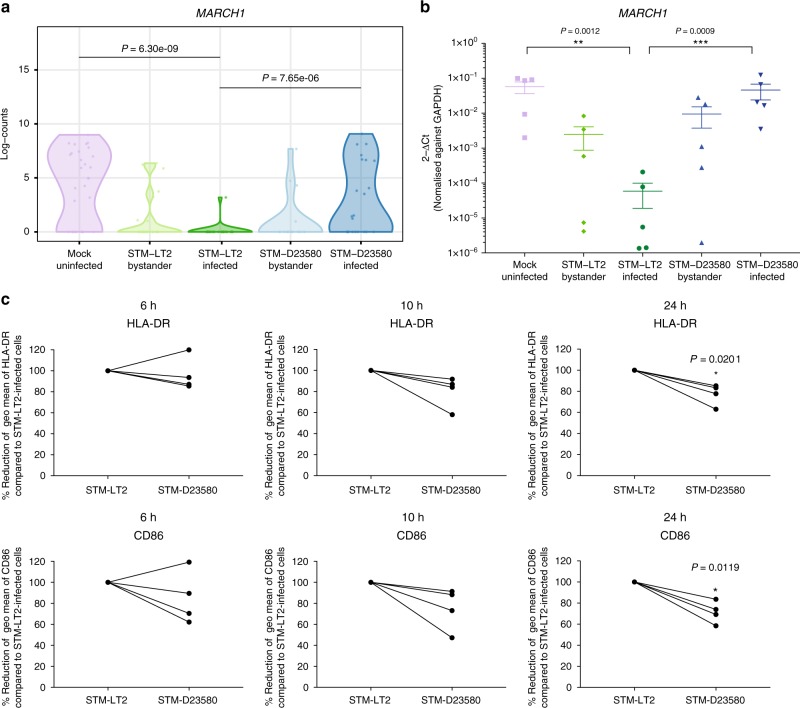
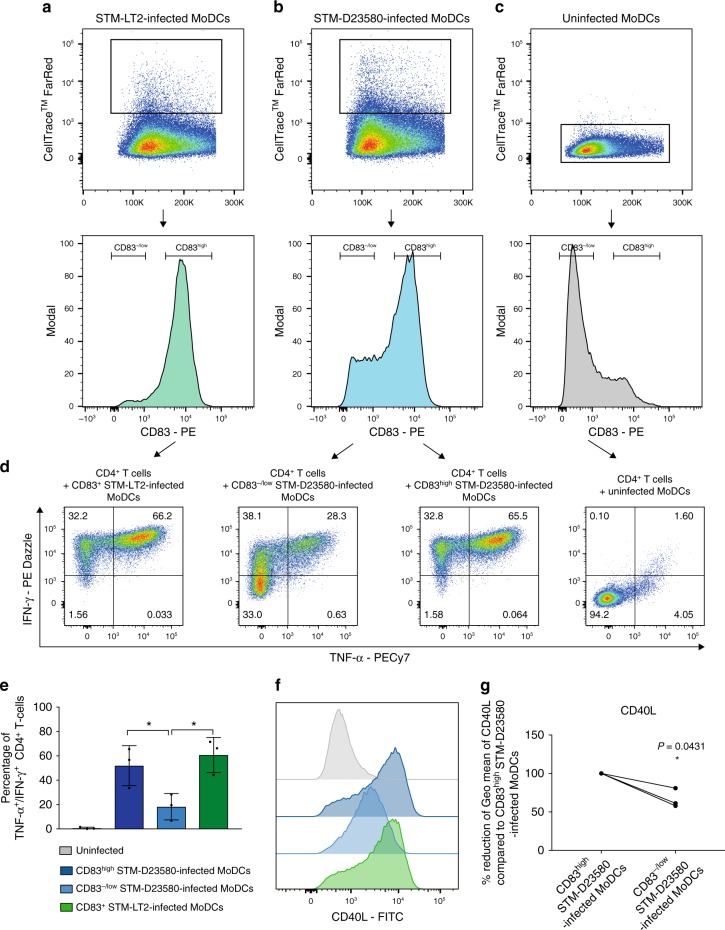
Non-typhoidal Salmonella (NTS) are highly prevalent food-borne pathogens. Recently, a highly invasive, multi-drug resistant S. Typhimurium, ST313, emerged as a major cause of bacteraemia in children and immunosuppressed adults, however the pathogenic mechanisms remain unclear. Here, we utilize invasive and non-invasive Salmonella strains combined with single-cell RNA-sequencing to study the transcriptome of individual infected and bystander monocyte-derived dendritic cells (MoDCs) implicated in disseminating invasive ST313. Compared with non-invasive Salmonella, ST313 directs a highly heterogeneous innate immune response. Bystander MoDCs exhibit a hyper-activated profile potentially diverting adaptive immunity away from infected cells. MoDCs harbouring invasive Salmonella display higher expression of IL10 and MARCH1 concomitant with lower expression of CD83 to evade adaptive immune detection. Finally, we demonstrate how these mechanisms conjointly restrain MoDC-mediated activation of Salmonella-specific CD4+ T cell clones. Here, we show how invasive ST313 exploits discrete evasion strategies within infected and bystander MoDCs to mediate its dissemination in vivo.


Conflict of interest statement

The authors declare no competing interests.

Figures

Fig. 1
Fig. 1
Single-cell transcriptomics analysis of human MoDCs challenged with invasive or non-invasive Salmonella. a Schematic representation of the experimental design. Human MoDCs were challenged with labelled STM-LT2 or STM-D23580 bacterial strains. At 2, 4 and 6 h post infection (p.i.), infected and bystander cells were sorted and processed according to the Smart-seq2 protocol. b The diffusion map non-linear dimensionality reduction technique was applied on the first 50 components of a principal component analysis (PCA) computed on the 500 most variable genes to visualize the high-dimensional relations between cells in the data set. The diffusion map reveals distinct cell populations that progress through the three time points of the experimental design. c Heat map displaying log2-transformed normalized counts for 3188 genes that significantly change with pseudotime across all single-cells (q-value < 0.001). Pseudotime was computed from a set of 2759 genes differentially expressed between Salmonella-challenged cells at 2 and 6 h p.i. (q-value < 0.001). Experimental metadata (i.e., time point, infection, status) are indicated for each cell as colour bars above the heat map
Fig. 2
Fig. 2
Unsupervised clustering reveals variability within infected and bystander cells. a Diffusion maps highlighting the unsupervised clusters identified by rank correlations between gene expression profiles of cells at each time point separately. Diffusion maps were computed on the first 50 components of a principal component analysis (PCA) using the 500 most variable genes identified within cells at each time point separately. b Heat maps displaying up to 30 significant marker genes identified as DE genes (P-value < 0.01) between each unsupervised cluster and all other cells at the corresponding time point (2, 4 and 6 h p.i, respectively). Rows and columns were clustered using Euclidian distance and complete linkage method applied to the row-scaled values across all heat map panels at that time point. Enriched GO categories and associated genes are indicated by colors. Transcription factors are highlighted in red
Fig. 3
Fig. 3
STM-D2350 and STM-LT2 induce divergent single-cell profiles in infected and bystander cells. Heat maps displaying significant DE genes (P-value < 0.01) identified between infected and bystander cells at time points 2, 4 and 6 h p.i, respectively. Rows and columns were clustered using Euclidian distance and Ward’s clustering criterion applied to the row-scaled log-transformed normalized counts across all heat map panels at that time point. Enriched GO categories and associated genes are indicated by colors
Fig. 4
Fig. 4
STM-D23580 bystander MoDCs show an exaggerated pro-inflammatory response. a Pro-inflammatory cytokines IL12B(*), IL1B(*) and CXCL8(*) and b transcription factors BCL2L1(*), BIRC3(*), IKBKB(**), TNIP3(*) and TNFAIP3(*) show significant (P-value < 0.01) upregulation in STM-D23580 bystander cells compared to both STM-LT2 bystander MoDCs and uninfected control(*) or compared to STM-LT2 bystander MoDCs only(**). ATF3 shows significant downregulation in STM-D23580 bystander cells compared to STM-LT2 bystander MoDCs
Fig. 5
Fig. 5
Direct comparison of MoDCs infected with STM-D23580 or STM-LT2. a Heat maps displaying significant DE genes (P-value < 0.01) identified between STM-D23580 and STM-LT2-infected cells at each time point (2, 4 and 6 h p.i, respectively). Rows and columns were clustered using Euclidian distance and complete linkage method applied to the row-scaled values across all heat map panels at that time point. b Violin plots displaying the log-transformed normalized gene expression level of relevant DE genes (P-value < 0.01) identified between STM-D23580- and STM-LT2-infected MoDCs
Fig. 6
Fig. 6
Intracellular STM-D23580 reduces CD83 surface expression. a Violin plots showing single-cell gene expression of IL10, JAK2, CLECL1 and CLEC7A at 6 h p.i. in infected and uninfected cells. b Violin plots showing single-cell gene expression of CD83 at 4 and 6 h p.i. in all experimental groups. c Flow cytometry histograms showing the expression of surface CD83 on gated infected and bystander cells challenged with STM-D23580 (blue), STM-LT2 (green) or left uninfected (grey) for 6, 10 or 24 h. STM-D23580-infected MoDCs display decreased surface expression of CD83 as compared with STM-LT2. Histograms from one representative example of at least four biological replicates. d STM-D23580 infection reduces surface CD83 levels detected by flow cytometry. On the y-axis, the geometric mean of fluorescence levels for CD83 on STM-D23580-infected cells is represented as a percentage of the level in STM-LT2-infected cells, set at 100%. Four independent experiments are shown. Two-tailed paired Student’s t-test, P-value < 0.05 (*)
Fig. 7
Fig. 7
Intracellular STM-D23580 reduces HLA-DR and CD86 surface expression compared to STM-LT2. a Violin plot showing single-cell gene expression of MARCH1 at 6 h p.i. in all the experimental groups. b Dot plot showing gene expression of MARCH1 at 6 h p.i detected by qPCR in all experimental groups. The mean±SEM of five independent experiments is shown. Two-way ANOVA test, P-value < 0.01(**), <0.001(***). c Surface HLA-DR and CD86 expression measured by flow cytometry. On the y-axis, the geometric mean of fluorescence levels for HLA-DR and CD86 on STM-D23580-infected cells is represented as a percentage of the level in STM-LT2 infected cells, set at 100%. Four independent experiments are shown. Two-tail paired Student’s t-test, P-value < 0.05 (*)
Fig. 8
Fig. 8
CD83-/low STM-D23580-infected MoDCs direct defective activation of Salmonella-specific CD4+ T cells. At 6 h p.i., a STM-LT2-infected MoDCs were sorted as CD83+ while b STM-D23580-infected MoDCs were sorted as CD83-/low or CD83high. c Uninfected MoDCs were used as negative control. Sorted subsets of infected MoDCs were co-cultured overnight with PhoN-specific CD4+ T cell clones cross-reactive against typhoidal and non-typhoidal serovars. d Capacity of CD4+ T cell to secrete IFN‐γ and TNF-α, as detected by intracellular staining. FACS plots show the percentage of IFN‐γ+/TNF-α+ cells out of total CD3+ CD4+ T cells. Dot plots comprise a representative experiment out of four. e CD83−/low STM-D23580-infected MoDCs induce a significantly lower amount of cytokine-producing T cells, as compared to CD83high STM-D23580 or CD83+ STM-LT2 infected cells. The mean±SEM of three independent experiments is shown One-way ANOVA test, P-value < 0.05 (*). f Flow cytometry histogram showing CD40L expression on T cells co-cultured with CD83+ STM-LT2 infected MoDCs, CD83−/low or CD83high STM-D23580-infected cells. Histograms from one representative example of at least three biological replicates. g Geometric mean of fluorescence intensity for CD40L in T cells co-cultured with CD83−/low STM-D23580-infected MoDCs, represented as a percentage of reduction from CD83high STM-D23580-infected MoDCs. three independent experiments are shown. Two-tailed paired Student’s t-test, P-value < 0.05 (*)

Similar articles

Cited by

References

    1. Feasey NA, Dougan G, Kingsley RA, Heyderman RS, Gordon MA. Invasive non-typhoidal salmonella disease: an emerging and neglected tropical disease in Africa. Lancet. 2012;379:2489–2499. doi: 10.1016/S0140-6736(11)61752-2. - DOI - PMC - PubMed
    1. Majowicz SE, et al. The global burden of nontyphoidal Salmonella gastroenteritis. Clin. Infect. Dis. 2010;50:882–889. doi: 10.1086/650733. - DOI - PubMed
    1. Hendriksen RS, et al. Global monitoring of Salmonella serovar distribution from the World Health Organization Global Foodborne Infections Network Country Data Bank: results of quality assured laboratories from 2001 to 2007. Foodborne Pathog. Dis. 2011;8:887–900. doi: 10.1089/fpd.2010.0787. - DOI - PubMed
    1. Kingsley RA, et al. Epidemic multiple drug resistant Salmonella Typhimurium causing invasive disease in sub-Saharan Africa have a distinct genotype. Genome Res. 2009;19:2279–2287. doi: 10.1101/gr.091017.109. - DOI - PMC - PubMed
    1. Leekitcharoenphon P, et al. Genomics of an emerging clone of Salmonella serovar Typhimurium ST313 from Nigeria and the Democratic Republic of Congo. J. Infect. Dev. Ctries. 2013;7:696–706. doi: 10.3855/jidc.3328. - DOI - PubMed

Publication types

MeSH terms