. 2018 Nov 19;9(1):4845.
doi: 10.1038/s41467-018-07295-7.

Competitive repopulation of an empty microglial niche yields functionally distinct subsets of microglia-like cells

Affiliations

Competitive repopulation of an empty microglial niche yields functionally distinct subsets of microglia-like cells

Harald Lund et al. Nat Commun. .

Abstract

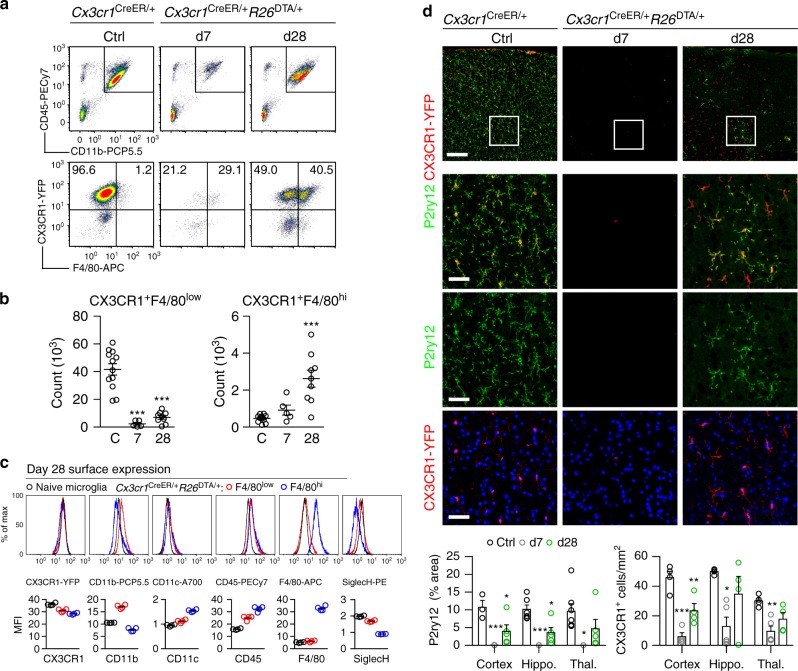
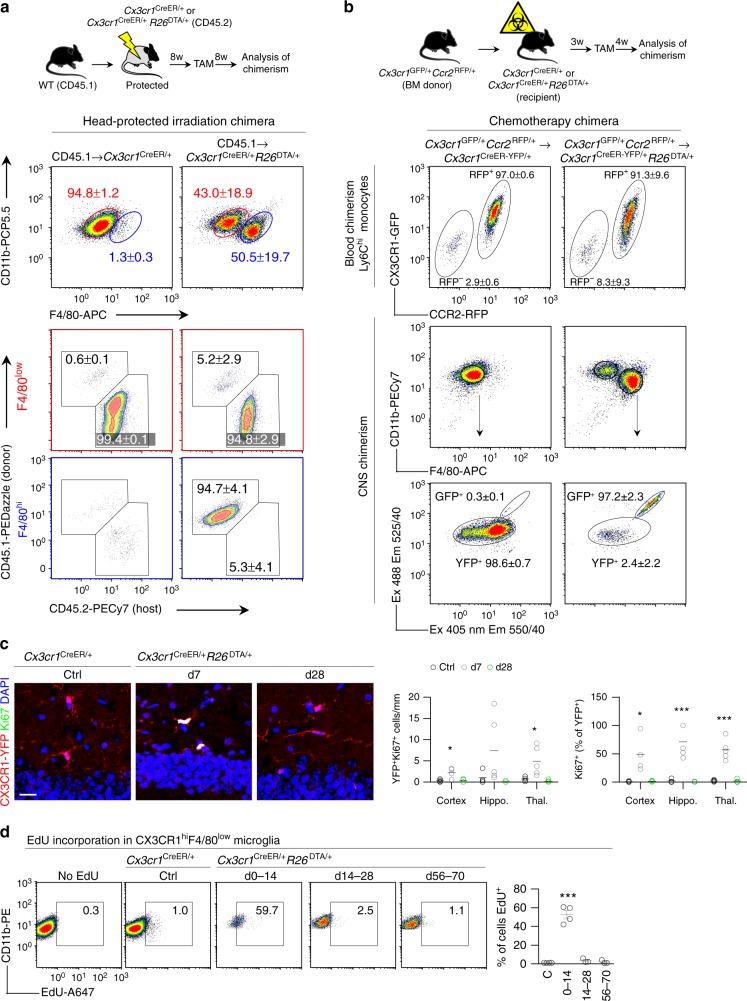
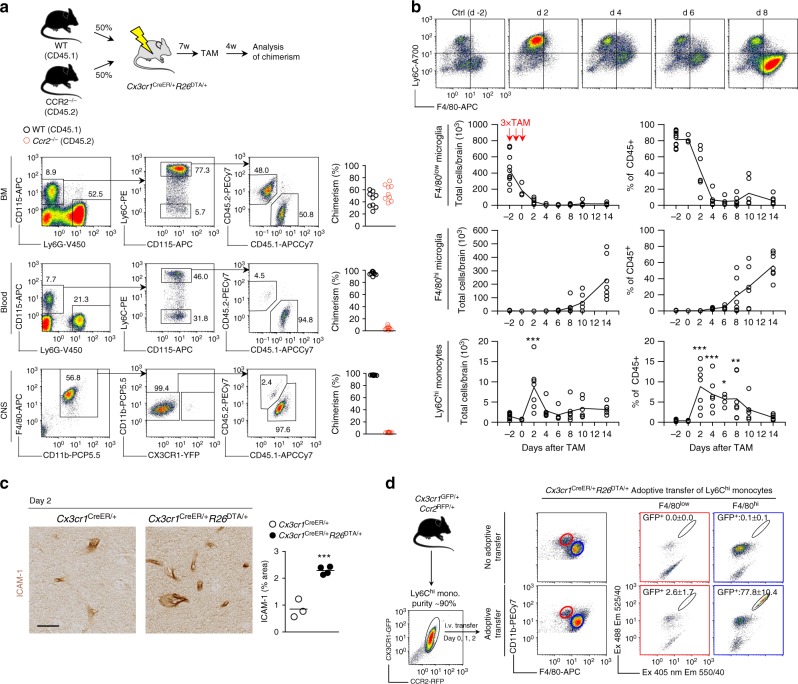
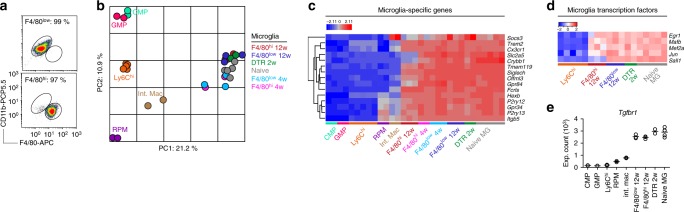
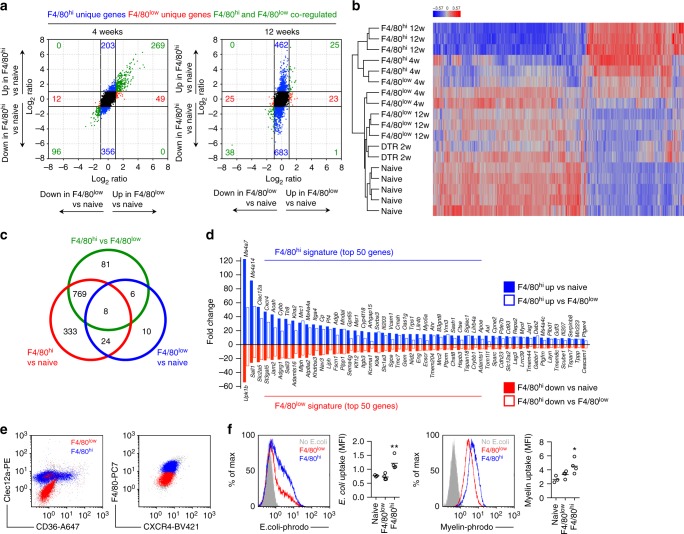
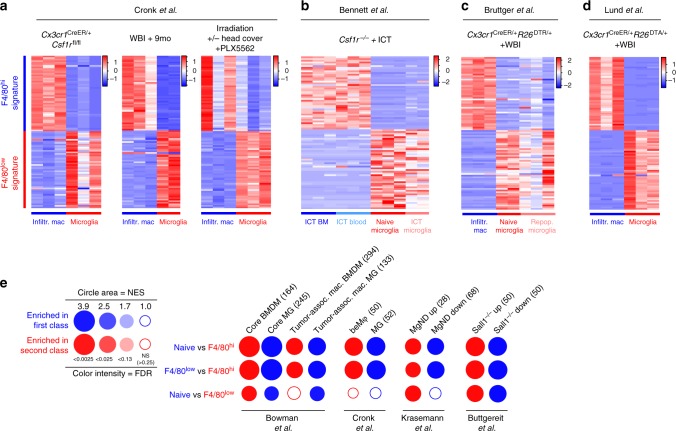
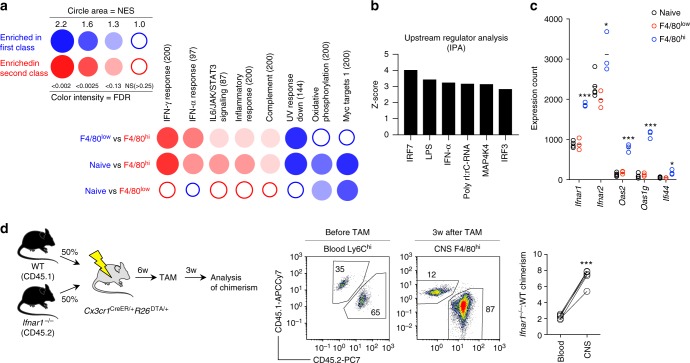
Circulating monocytes can compete for virtually any tissue macrophage niche and become long-lived replacements that are phenotypically indistinguishable from their embryonic counterparts. As the factors regulating this process are incompletely understood, we studied niche competition in the brain by depleting microglia with >95% efficiency using Cx3cr1CreER/+R26DTA/+ mice and monitored long-term repopulation. Here we show that the microglial niche is repopulated within weeks by a combination of local proliferation of CX3CR1+F4/80lowClec12a- microglia and infiltration of CX3CR1+F4/80hiClec12a+ macrophages that arise directly from Ly6Chi monocytes. This colonization is independent of blood brain barrier breakdown, paralleled by vascular activation, and regulated by type I interferon. Ly6Chi monocytes upregulate microglia gene expression and adopt microglia DNA methylation signatures, but retain a distinct gene signature from proliferating microglia, displaying altered surface marker expression, phagocytic capacity and cytokine production. Our results demonstrate that monocytes are imprinted by the CNS microenvironment but remain transcriptionally, epigenetically and functionally distinct.


Conflict of interest statement

The authors declare no competing interests.

Figures

Fig. 1
Fig. 1
Kinetics of depletion and repopulation of microglia in Cx3cr1CreER/+R26DTA/+ mice. a Dot plots detailing depletion and repopulation of microglia in Cx3cr1CreER/+R26DTA/+ mice on the indicated days after TAM administration. Top panel is gated on live singlet cells. Bottom panel is gated on CD11b+CD45+Ly6CLy6G. b Quantification of CX3CR1+F4/80low and CX3CR1+F4/80hi populations by flow cytometry. n = 12, 5, 9 mice, mean ± s.e.m. ***p < 0.001 by one-way ANOVA with Dunnett’s Multiple Comparison test. Data are pooled from three separate experiments. The experiment was repeated twice for each time point. c Surface expression by flow cytometry on repopulated F4/80low and F4/80hi cells at day 28 compared to naive microglia. Gated on CD11b+CD45+Ly6CLy6G. n = 4 mice/group. Lines represent mean values. The experiment was performed twice. d Quantification of P2ry12 and CX3CR1-YFP staining in the indicated brain regions. Representative images are from the cortex. n = 3–7 mice/group, mean ± s.e.m. ***p < 0.001, **p < 0.01, *p < 0.05 by one-way ANOVA with Dunnett’s Multiple Comparison test. Scale bar top panel 200 µm, bottom three panels 50 µm. Hippo. Hippocampus. Thal. Thalamus
Fig. 2
Fig. 2
Repopulating microglia have dual origins. a Analysis of chimerism in F4/80low and F4/80hi populations in CD45.1 chimeras. Top panel gated on CD11b+F4/80+Ly6CLy6G. Bottom panels gated on F4/80low and F4/80hi as indicated. Percentages are mean ± s.d. of n = 5 mice/group. The experiment was performed twice. b Analysis of chimerism in Cx3cr1GFP/+Ccr2RFP/+ → Cx3cr1CreER/+R26DTA/+ chimeras that had received busulfan chemotherapeutic for myeloablation. Successful separation of GFP+ and YFP+ populations is demonstrated in Supplementary Fig. 3. Blood is gated on CD11b+Ly6GCD115+Ly6Chi and CNS is gated on CD11b + Ly6C. Values in plots are mean ± s.d of n = 4 and six mice. The experiment was performed once. c Quantification of CX3CR1-YFP+Ki67+ proliferating microglia in the indicated brain regions. Representative images are from the hippocampus. n = 4–5 mice/group. Lines represent mean values. ***p < 0.001, *p < 0.05 by one-way ANOVA with Dunnett’s Multiple Comparison test. Scale bar 20 μm. d Proliferation in repopulating F4/80low microglia assessed by EdU. EdU was administered in the drinking water for 14 days during the indicated time periods after TAM. Control mice were given EdU days 0–14 after TAM. Gated on CD11b+Ly6CLy6GCX3CR1+F4/80low. n = 3–4 mice/group, the experiment was performed twice. Lines represent mean values. ***p < 0.001 by one-way ANOVA with Dunnett’s Multiple Comparison test
Fig. 3
Fig. 3
F4/80hi macrophages are derived from CCR2+Ly6Chi monocytes. a Analysis of BM, blood and CNS chimerism in WT:Ccr2–/– → Cx3cr1CreER/+R26DTA/+ competitive chimeras. In all organs gated on live singlet cells. n = 9 mice. The experiment was performed twice. b Kinetic analysis of Ly6Chi monocytes in relation to F4/80low microglia and F4/80hi macrophages in the CNS during depletion in Cx3cr1CreER/+R26DTA/+ mice. Representative flow cytometry plots are gated on CD11b+CD45hiLy6G cells. Ly6Chi, F4/80low, and F4/80hi gated as indicated in Supplementary Fig. 1. Data is from two pooled experiments. n = 12, 3, 7, 6, 5, 7, 6, 7 mice/time point. Connecting lines represent mean values. **p < 0.01, ***p < 0.001 by one-way ANOVA with Dunnett’s Multiple Comparison test. c Activation of the cerebral vasculature as assessed by ICAM-1 staining on day 2 after TAM administration. Quantification was performed in the thalamus on n = 3 and 4 mice/group and 3 sections/mouse. Scale bar 25 µm. Lines represent mean values. ***p < 0.001 by Student’s unpaired two-tailed t-test. d Analysis of reconstitution of the F4/80low and F4/80hi compartments after adoptive transfer of 1.7–3.0 × 106 Ly6Chi monocytes/day from Cx3cr1GFP/+Ccr2RFP/+ mice into microglia-depleted Cx3cr1CreER/+R26DTA/+ mice on days 0, 1, and 2 after TAM administration. Gated on CD11b + Ly6C. Analysis of CNS was performed day 14 after TAM administration. Successful separation of GFP and YFP signals is demonstrated in Supplementary Fig. 3. Values are mean ± s.d of 4 mice/group. The experiment was performed once
Fig. 4
Fig. 4
Gene expression profile of repopulating microglia/macrophages. a FACS purities of sorted F4/80low and F4/80hi populations. b PCA of microarray expression profiles. n(biological + technical) = 2 GMP, 2 CMP, 3 + 2 Ly6Chi, 2 RPM, 2 int. mac, 3 + 2 naive microglia, 2 DTR, 3 F4/80low 4w, 3 F4/80low 12w, 2 F4/80hi 4w, 3 F4/80hi 12w. Naive microglia were sorted from Cx3cr1CreER/+ mice that received TAM. DTR microglia were sorted from Cx3cr1CreER/+R26DTR/+ mice 14 days after DT administration. F4/80low and F4/80hi subsets in Cx3cr1CreER/+R26DTA/+ mice were sorted 4 and 12 weeks after TAM administration. RPM, int. mac, CMP, GMP, and Ly6Chi monocytes were sorted from naive mice. Int. mac. intestinal macrophage. Sorting strategies are detailed in the Methods section. Each sample represents pools of 2–5 mice. c Heat map (z-scores) of expression profiles of 15 microglia-specific genes. d Heat map (z-scores) of expression profiles of microglia-specific transcription factors. e Microarray expression counts of Tgfbr1. Lines represent mean values
Fig. 5
Fig. 5
Monocyte-derived macrophages are transcriptionally and functionally distinct from resident and proliferating microglia. a FC/FC plots comparing differential gene expression in F4/80low and F4/80hi subsets with naive microglia, respectively, after 4 and 12 weeks. b Heat map (z-scores) of 1137 genes differentially expressed (>2 fold change both directions, adj. p < 0.05) between naive microglia and F4/80hi 12 week subsets. c Venn diagram of differential gene expression between naive microglia, F4/80low and F4/80hi subsets at 12 weeks. d F4/80hi and F4/80low gene signature; Top 50 up/down-regulated genes in F4/80hi macrophages compared to both naive microglia and F4/80low microglia at 12 weeks. e Clec12a, CD36, CXCR4 surface expression in F4/80low and F4/80hi subsets analyzed by flow cytometry. Gated on CX3CR1hiCD11b+ cells from Cx3cr1CreER/+R26DTA/+ mice > 5 weeks after TAM. f Phagocytosis of pHrodo Red E. coli microparticles and pHrodo Red-labeled myelin in CD11b-enriched CNS cells, stained with F4/80 to gate on CX3CR1+F4/80low (red) and CX3CR1+F4/80hi (blue) subsets in Cx3cr1CreER/+R26DTA/+ mice 5 weeks after TAM. Naive CX3CR1+F4/80low microglia were used as control. Lines represent mean values. *p < 0.05, **p < 0.01 by Student’s paired two-tailed t-test (comparing F4/80low and F4/80hi)
Fig. 6
Fig. 6
Monocyte-derived macrophages adopt a conserved gene signature associated with neuroinflammation and neurodegeneration. ad Expression (z-scores) of the F4/80low and F4/80hi gene signatures from Fig. 5d in published datasets. These studies were chosen because they compared the transcriptomic profiles of CNS-infiltrating macrophages with resident microglia, with or without microglial depletion. Normalized RNA-seq expression counts were used to plot the data. WBI whole body irradiation. ICT intracerebral transplantation. e Gene set enrichment analysis visualized using BubbleGum. Color indicates the cell subset showing enrichment, and the size and color of circles represent enrichment score and significance, respectively. Numbers in parentheses denote the number of genes in the gene set. BMDM bone-marrow derived macrophage MgND neurodegeneration-associated microglia
Fig. 7
Fig. 7
Type I IFNs regulate niche colonization. a Analysis of enrichment of hallmark gene sets visualized using BubbleGum. Color indicates the cell subset showing enrichment, and the size and color of circles represent enrichment score and significance, respectively. b Top activated upstream regulators using ingenuity pathway analysis. c Microarray expression counts of type I IFN receptors and response genes. Lines represent mean values. *p < 0.05, ***p < 0.001 by Student’s unpaired two-tailed t-test comparing F4/80low and F4/80hi. d Analysis of chimerism in WT:Ifnar1–/– competitive chimeras before TAM administration (blood) or 3 weeks after TAM (CNS). Blood is gated on CD11b+SSClowLy6Chi monocytes and CNS on CD11b+F4/80hi. n = 4 mice. The experiment was performed once. ***p < 0.001 by Student’s paired two-tailed t-test

References

    1. Ginhoux F, et al. Fate mapping analysis reveals that adult microglia derive from primitive macrophages. Science. 2010;330:841–845. doi: 10.1126/science.1194637. - DOI - PMC - PubMed
    1. Schulz C, et al. A lineage of myeloid cells independent of Myb and hematopoietic stem cells. Science. 2012;336:86–90. doi: 10.1126/science.1219179. - DOI - PubMed
    1. Hashimoto D, et al. Tissue-resident macrophages self-maintain locally throughout adult life with minimal contribution from circulating monocytes. Immunity. 2013;38:792–804. doi: 10.1016/j.immuni.2013.04.004. - DOI - PMC - PubMed
    1. Yona S, et al. Fate mapping reveals origins and dynamics of monocytes and tissue macrophages under homeostasis. Immunity. 2013;38:79–91. doi: 10.1016/j.immuni.2012.12.001. - DOI - PMC - PubMed
    1. van Furth R, et al. The mononuclear phagocyte system: a new classification of macrophages, monocytes, and their precursor cells. Bull. World Health Organ. 1972;46:845–852. - PMC - PubMed

Publication types

MeSH terms