. 2018 Nov 19;8(1):16985.
doi: 10.1038/s41598-018-35069-0.

Silibinin, A Natural Blend In Polytherapy Formulation For Targeting Cd44v6 Expressing Colon Cancer Stem Cells

Affiliations

Silibinin, A Natural Blend In Polytherapy Formulation For Targeting Cd44v6 Expressing Colon Cancer Stem Cells

Shanaya Patel et al. Sci Rep. .

Erratum in

Abstract

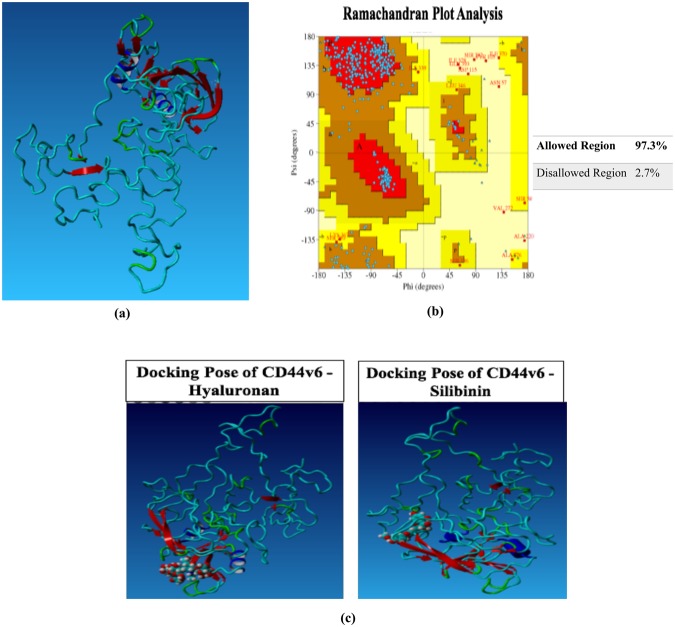
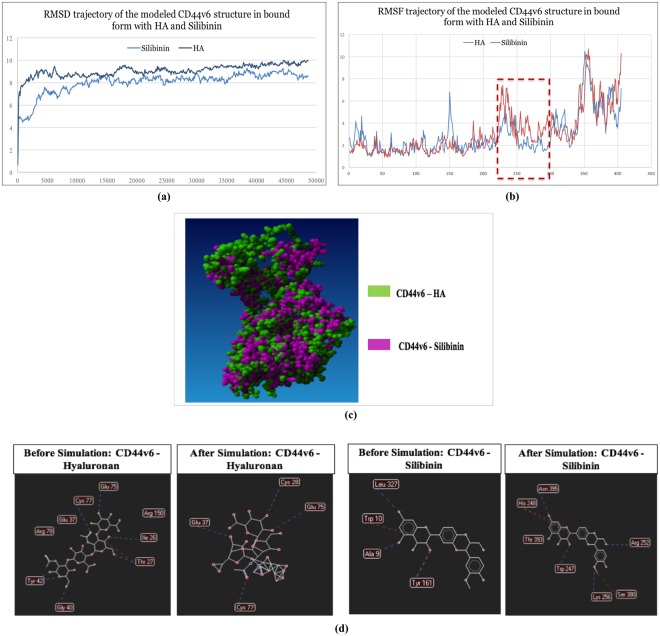
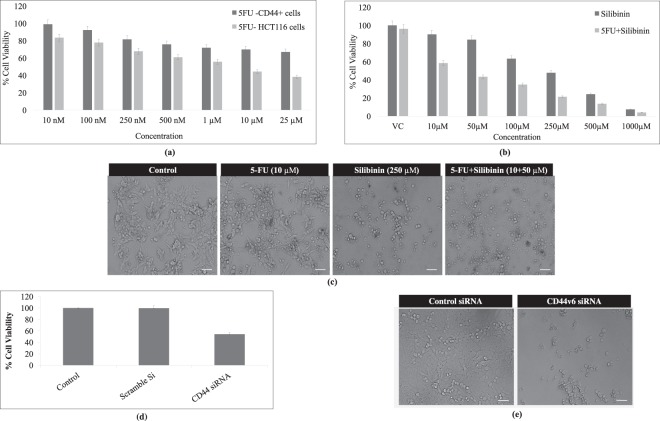
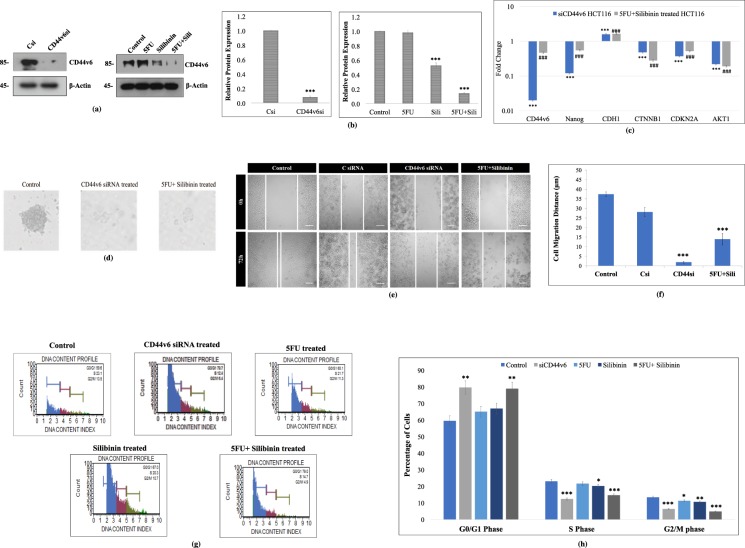
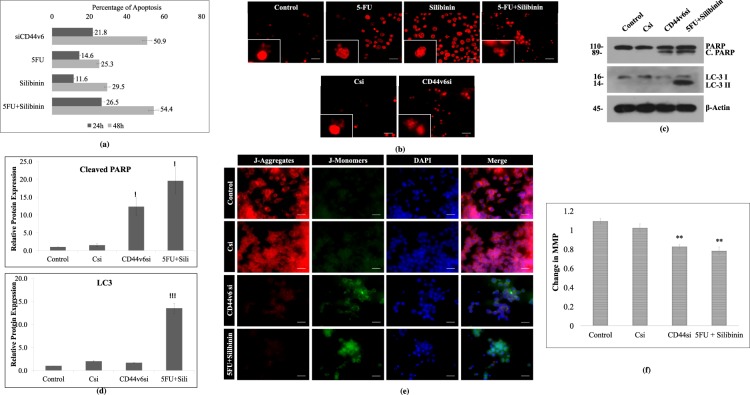
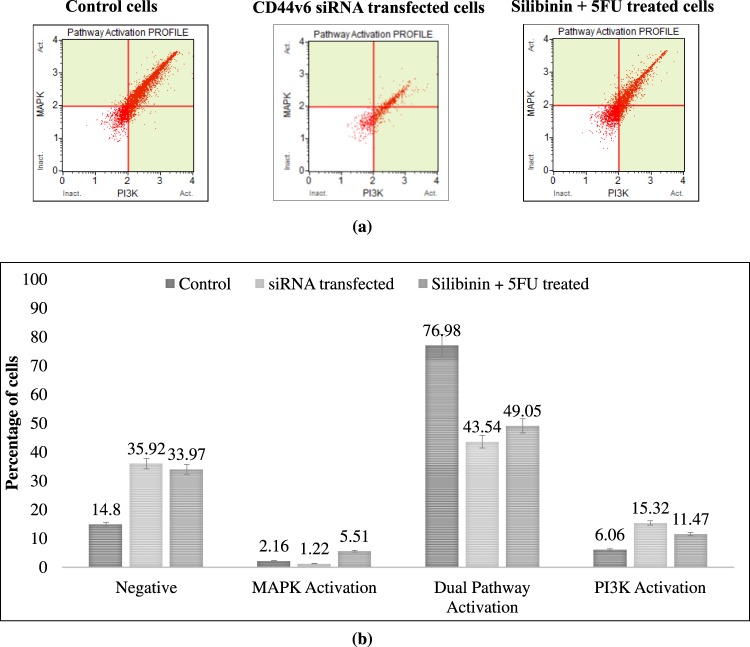
Colon cancer stem cells have been attributed to poor prognosis, therapeutic resistance and aggressive nature of the malignancy. Recent reports associated CD44v6 expression with relapse, metastasis and reduced 5-year survival of colon cancer patients, thereby making it a potential therapeutic target. Thus, in this study, comprehensive prediction and screening of CD44v6 against 1674 lead compounds was conducted. Silibinin was identified as a potential compound targeting CD44v6. Inorder to substantiate these findings, the cytotoxic effect of 5FU, Silibinin and 5FU+ Silibinin was assessed on human colon carcinoma cell line HCT116 derived CD44+ subpopulation. 5FU+ Silibinin inhibited cell proliferation of CD44+ subpopulation at lower concentration than Silibinin standalone. Further, corresponding to CD44v6 knockdown cells, 5FU+ Silibinin treatment significantly decreased CD44v6, Nanog, CTNNB1 and CDKN2A expression whereas increased E-cadherin expression in HCT116 derived CD44+ cells. Moreover, synergistic effect of these drugs suppressed sphere formation, inhibited cell migration, triggered PARP cleavage and perturbation in mitochondrial membrane potential, thereby activating intrinsic apoptotic pathways and induced autophagic cell death. Importantly, 5FU+ Silibinin could inhibit PI3K/MAPK dual activation and arrest the cell cycle at G0/G1 phase. Thus, our study suggests that inhibition of CD44v6 attenuates stemness of colon cancer stem cells and holds a prospect of potent therapeutic target.


Conflict of interest statement

The authors declare no competing interests.

Figures

Figure 1
Figure 1
Structure prediction of CD44v6 and virtual screening of potential lead compounds targeting CD44v6. (a) Comprehensive prediction of three-dimensional CD44v6 protein structure using template based homology modeling. (b) Ramachandran plot analysis assessing the sensitivity and specificity of the predicted structure. (c) 3D representation of the complex between Hyaluronan (HA) and Silibinin in the HA-binding domain of CD44v6 by virtual molecular docking.
Figure 2
Figure 2
Molecular dynamics, molecular modeling and structural perturbation analysis of CD44v6 by selected potential drug compound. (a) RMSD trajectory analysis of the modeled CD44v6 structure in bound form with HA and Silibinin during 50 ns long MD simulations. Notes: Duration of MD simulations scaled on X-axis and Y-axis on the left side represents the RMSD deviation of protein structure in Å. Y-axis on the right side represents the HA ligand RMSD trajectory in their respective binding pockets. (b) RMSF analysis of the modeled CD44v6 structure in bound form with HA and Silibinin during 50 ns long MD simulations. The highlighted regions (red) is depicting ligand induced internal residual fluctuations in CD44v6 structure captured during MD simulation process. (c) 3D representation of the superimposed complexes of CD44v6 bound to HA (green) and Silibinin (pink) respectively demonstrating ligand induced conformational change in the structure of CD44v6 protein. (d) Difference in H-bond interaction profile of CD44v6 with HA and Silibinin before and after MD simulation process.
Figure 3
Figure 3
Cytotoxic effect of 5FU, Silibinin and Silibinin+ 5FU on cell proliferation of HCT116 derived CD44+ subpopulation. (a) Determination of cytotoxic effects of 5FU on HCT116 cell line and HCT116 derived CD44+ subpopulation. The graph represents the percentage of cell viability at various concentrations (10 nM, 100 nM, 250 nM, 500 nM, 1 μM, 10 μM, 25 μM) of 5FU for 48 h. (b) Assessment of cytotoxic effects of Silibinin and Silibinin+ 5-FU on cell viability of HCT116 derived CD44+ subpopulation at various concentrations (10 μM, 50 μM, 100 μM, 250 μM, 500 μM, 1000 μM) of silibinin standalone and in synergism with 10 μM of 5FU for 48 h. (c) Morphological analysis of 5FU, Silibinin and Silibinin+ 5FU treated CD44+ cells by Bright–field microscopy. Scale bar:10 μm. (d) Evaluation of the inhibitory effects of CD44v6 siRNA (10 nm) on HCT116 derived CD44+ cells as compared to control for 48 h. (e) Morphological analysis of CD44v6 knockdown cells by Bright–field microscopy as compared to scramble control (Control siRNA). Scale bar:10 μm. Note: DMSO was used as a vehicle control. Error bars represent mean ± SEM of three independent experiments with p-value indicated as *p < 0.05, **p < 0.01 and ***p < 0.001.
Figure 4
Figure 4
Effect of 5FU, Silibinin and 5FU+ Silibinin on gene and protein expression profile, sphere forming ability, migratory potential and cell cycle mechanism of HCT116 derived CD44+ subpopulation. (a) Western Blot analysis of CD44v6 in HCT116 derived CD44+ cells upon treatment with CD44v6 siRNA (10 nM), 5FU (10 μM), Silibinin (250 μM) and combinatorial treatment of 5FU+ Silibinin (10 + 50 μM). β-actin was used as a loading control. (b) Densitometric analysis of western blot bands of CD44v6 protein post treatment with CD44v6 siRNA, 5FU, Silibinin and 5FU+ Silibinin. Error bars represent mean ± SEM of three independent experiments with p-value indicated as *p < 0.05, **p < 0.01 and ***p < 0.001. (c) mRNA expression of various markers was analyzed by qRT-PCR. The expression of mRNA of the respective genes (CD44v6, Nanog, CDH1, CTNNB1, CDKN2A and Akt1) was evaluated in CD44v6 siRNA (10 nM) and 5FU+ Silibinin (10 + 50 μM) treated cells as compared to their corresponding control. The data was normalized with 18 s rRNA (endogenous control). Error bars represent mean ± SEM of three independent experiments with p-value indicated as ***p < 0.001 for CD44v6 siRNA transfected cells and ###p < 0.001 for 5FU+ Silibinin treated cells normalized against their respective controls. (d) Sphere forming ability of HCT116 derived CD44+ subpopulation was analyzed post CD44v6 specific siRNA and 5FU+ Silibinin treatment (100x magnification). The data shown are representative of three isolated experiments. (e) The migration ability of HCT116 derived CD44+ subpopulation was monitored in CD44v6 knockdown and 5FU+ Silibinin treated condition by wound healing assay. DMSO was used as a vehicle control. The data shown are representative of three isolated experiments. (f) The graphs represent the relative distance migrated by cells per field (μm) in the wound healing assay. Error bars represent mean ± SEM of three independent experiments with p-value indicated as *p < 0.05, **p < 0.01 and ***p < 0.001. (g) Alteration in cell cycle mechanism was assessed using MuseTM analyser based flow cytometric analysis. (h) The graph indicates the percentage of cells in each phase of the cell cycle. Error bars represent mean ± SEM of three independent experiments with p-value indicated as *p < 0.05, **p < 0.01 and ***p < 0.001.
Figure 5
Figure 5
Enhanced effect of 5FU+ Silibinin combinatorial treatment on apoptotic mechanism of CD44+ subpopulation. (a) Apoptotic cell death analysis was conducted by Annexin-V/PI staining of CD44v6 siRNA (10 nM), 5FU (10 μM), Silibinin (250 μM) and 5FU+ Silibinin (10 + 50 μM) treated cells as compared to untreated cells using the MuseTM analyser. The graph indicates the percentage of apoptotic and live cells in treated cells compared to untreated cell population. Error bars represent mean ± SEM of three independent experiments with p-value indicated as *p < 0.05, **p < 0.01 and ***p < 0.001. (b) Nuclear morphology and fragmentation of CD44v6 siRNA (10 nM), 5FU (10 μM), Silibinin (250 μM) and 5FU+ Silibinin (10 + 50 μM) treated cells were stained with PI and observed under fluorescent microscope. Scale bar:10 μm. (c) Western Blot analysis of PARP cleavage and LC-3 I/II conversion in HCT116 derived CD44+ cells upon CD44v6 knockdown (10 nM) and combinatorial treatment of 5FU+ Silibinin (10 + 50 μM). β-actin was used as a loading control. (d) Densitometric analysis of western blot bands of PARP cleavage and LC-3 I/II conversion post treatment with CD44v6 siRNA and 5FU+ Silibinin compared to their control counterparts. Error bars represent mean ± SEM of three independent experiments with p-value indicated as *p < 0.05, **p < 0.01 and ***p < 0.001. (e) Analysis of changes in mitochondrial membrane potential (MMP) via JC-1 dye by fluorescence microscopy. Scale bar: 10 μm. (f) Quantitative analysis of loss of mitochondrial membrane potential (Ψ). Error bars represent mean ± SEM of three independent experiments with p-value indicated as *p < 0.05, **p < 0.01 and ***p < 0.001.
Figure 6
Figure 6
Synergistic effect of 5FU and Silibinin on activation of PI3K/MAPK dual pathway in CD44 subpopulation. The effect of silencing and combinatorial drug treatment induced CD44v6 suppression was examined on PI3K/MAPK dual pathway activation of HCT116 derived CD44+ cells. (a) PI3K/MAPK dual activation analysis was conducted on CD44v6 siRNA (10 nM) and 5FU+ Silibinin (10 + 50 μM) treated cells as compared to their untreated counterparts using the MuseTM analyser based flow cytometry. (b) The graph indicating the percentage of cells in treated cells compared to untreated cell population. Error bars represent mean ± SEM of three independent experiments with p-value indicated as *p < 0.05, **p < 0.01 and ***p < 0.001.

References

    1. Edwards BK, et al. Annual report to the nation on the status of cancer, 1975–2006, featuring colorectal cancer trends and impact of interventions (risk factors, screening, and treatment) to reduce future rates. Cancer. 2010;116:544–573. doi: 10.1002/cncr.24760. - DOI - PMC - PubMed
    1. Stewart, B.W. & Wild, C.P. editors. World Cancer Report 2014. Lyon, France: International Agency for Research on Cancer (2014). - PubMed
    1. Visvader JE, Lindeman GJ. Cancer stem cells in solid tumours: accumulating evidence and unresolved questions. Nature Reviews Cancer. 2008;8:755–68. doi: 10.1038/nrc2499. - DOI - PubMed
    1. Boman BM, Huang E. Human colon cancer stem cells: a new paradigm in gastrointestinal oncology. J Clin Oncol. 2008;26:2828–2838. doi: 10.1200/JCO.2008.17.6941. - DOI - PubMed
    1. Ricci-Vitiani L, Fabrizi E, Palio E, De Maria R. Colon cancer stem cells. J Mol Med. 2009;87:1097–1104. doi: 10.1007/s00109-009-0518-4. - DOI - PubMed

Publication types

MeSH terms