. 2018 Nov 19;8(1):16977.
doi: 10.1038/s41598-018-34975-7.

Spatio-temporal cluster and distribution of human brucellosis in Shanxi Province of China between 2011 and 2016

Affiliations

Spatio-temporal cluster and distribution of human brucellosis in Shanxi Province of China between 2011 and 2016

Ting Wang et al. Sci Rep. .

Abstract

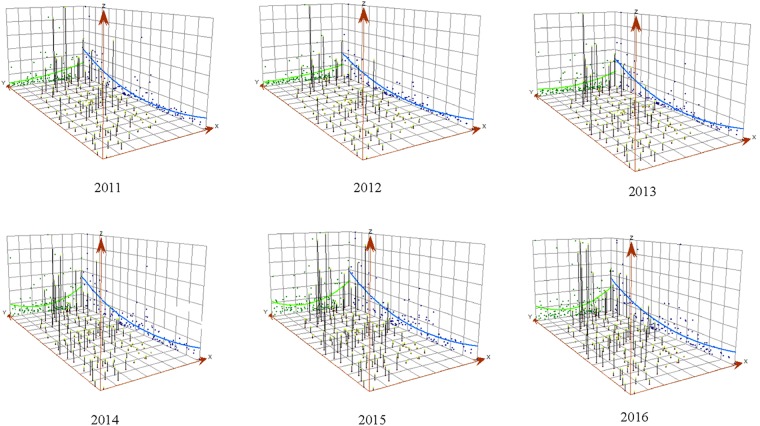
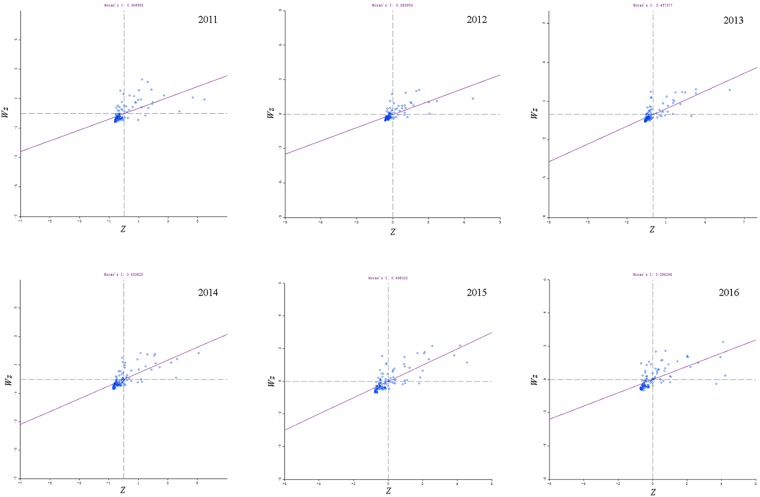
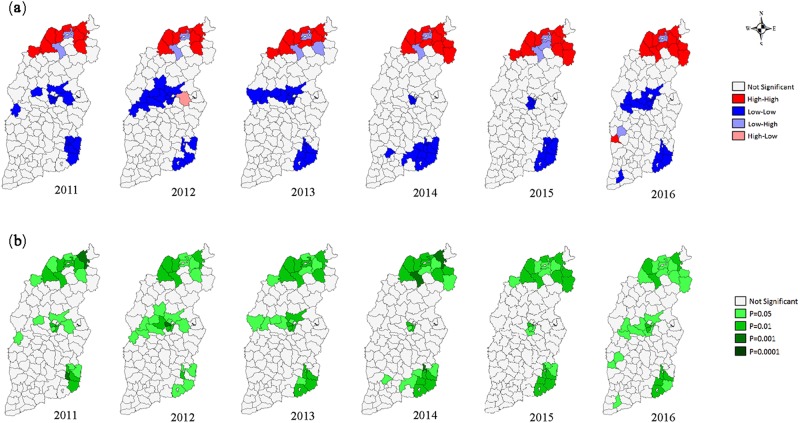
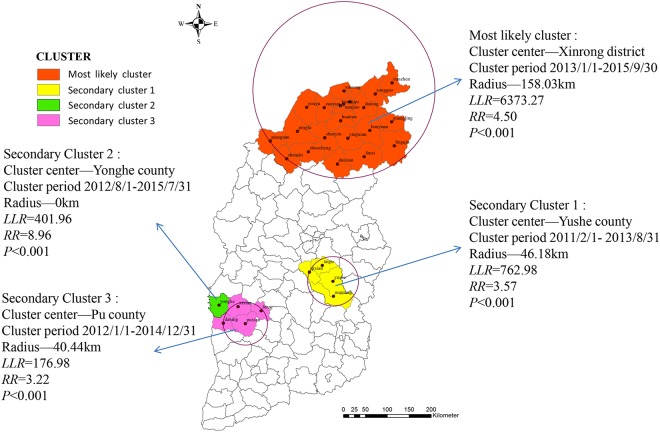
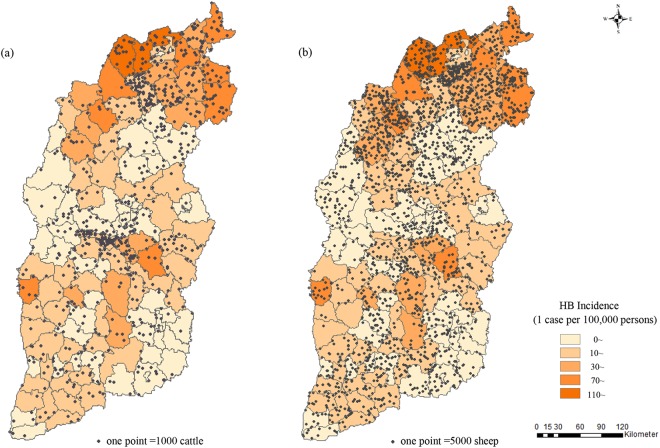
In recent years, the incidence of human brucellosis (HB) in the Shanxi province has ranked to be the top five among the 31 China provinces. HB data in Shanxi province between 2011 and 2016 were collected from the Centers for Disease Control and Prevention. Spatial and temporal distribution of HB was evaluated using spatial autocorrelation analysis and space-time scan analysis. The global Moran's I index ranged from 0.37 to 0.50 between 2011 and 2016 (all P < 0.05), and the "high-high" clusters of HB were located at the northern Shanxi, while the "low-low" clusters in the central and southeastern Shanxi. The high-incidence time interval was between March and July with a 2-fold higher risk of HB compared to the other months in the same year. One most likely cluster and three secondary clusters were identified. The radius of the most likely cluster region was 158.03 km containing 10,051 HB cases. Compared to the remaining regions, people dwelling in the most likely region were reported 4.50-fold ascended risk of incident HB. HB cases during the high-risk time interval of each year were more likely to be younger, to be males or to be farmers or herdsman than that during the low-risk time interval. The HB incidence had a significantly high correlation with the number of the cattle or sheep especially in the northern Shanxi. HB in Shanxi showed unique spatio-temporal clustering. Public health concern for HB in Shanxi should give priority to the northern region especially between the late spring and early summer.


Conflict of interest statement

The authors declare no competing interests.

Figures

Figure 1
Figure 1
Three-dimensional trend of the annual incidence rate of human brucellosis in Shanxi, China between 2011 and 2016*. X- and Y-axis represent the longitude (from west to east) and latitude (from south to north) of the geometric center of Shanxi province in China, respectively, and Z-axis represents the HB incidence, that is, one point (X, Y, Z) indicates some specific study region, and higher Z value means higher HB incidence.
Figure 2
Figure 2
Global Moran’s I scatter plot of human brucellosis incidence in 119 counties (districts) of Shanxi, China between 2011 and 2016*, *The horizontal axis of the Moran scatter plot, is the observed and normalized z-score (Zi=XiXs) for specific county or district, and the vertical axis is the weighted sum of observed and normalized z-score for the neighboring counties or districts (Wzi=i=1nwijzj). The individual dots display the specific 119 counties or districts. The first to fourth quadrants of the Moran scatter plot correspond to the high-high, low-high, low-low and high-low correlations for local Moran’s I.
Figure 3
Figure 3
Local Moran’s I diagram of human brucellosis incidence among 119 counties or districts of Shanxi, China between 2011 and 2016*. * (a) Local Moran’s I cluster map. (b) Local Moran’s I significance map.
Figure 4
Figure 4
Spatio-temporal clusters of human brucellosis among 119 counties or districts in Shanxi, China between 2011 and 2016.
Figure 5
Figure 5
The distribution of average HB incidence and the average number of sheep or cattle of 119 counties or districts of Shanxi province across six years from 2011 to 2016*. *(a,b) indicated the distribution of average HB incidence and the average number of cattle or sheep, one solid circle represented 1,000 cattle (a) or 5,000 sheep (b).

References

    1. Seleem MN, Boyle SM, Sriranganathan N. Brucellosis: A re-emerging zoonosis. Veterinary Microbiology. 2010;140:392–398. doi: 10.1016/j.vetmic.2009.06.021. - DOI - PubMed
    1. Pappas G, Papadimitriou P, Akritidis N, Christou L, Tsianos EV. The new global map of human brucellosis. Lancet Infectious Diseases. 2006;6:91–99. doi: 10.1016/S1473-3099(06)70382-6. - DOI - PubMed
    1. Pappas G, Akritidis N, Bosilkovski M, Tsianos E. Brucellosis. New England Journal of Medicine. 2005;352:2325–2336. doi: 10.1056/NEJMra050570. - DOI - PubMed
    1. Franco MP, Mulder M, Gilman RH, Smits HL. Human brucellosis. Lancet Infectious Diseases. 2007;7:775–786. doi: 10.1016/S1473-3099(07)70286-4. - DOI - PubMed
    1. Dean AS, Crump L, Greter H, Schelling E, Zinsstag J. Global burden of human brucellosis: a systematic review of disease frequency. PLoS Negl Trop Dis. 2012;6:e1865. doi: 10.1371/journal.pntd.0001865. - DOI - PMC - PubMed

Publication types