. 2018 Nov 19;8(1):16987.
doi: 10.1038/s41598-018-35250-5.

Common solar wind drivers behind magnetic storm-magnetospheric substorm dependency

Affiliations

Common solar wind drivers behind magnetic storm-magnetospheric substorm dependency

Jakob Runge et al. Sci Rep. .

Abstract

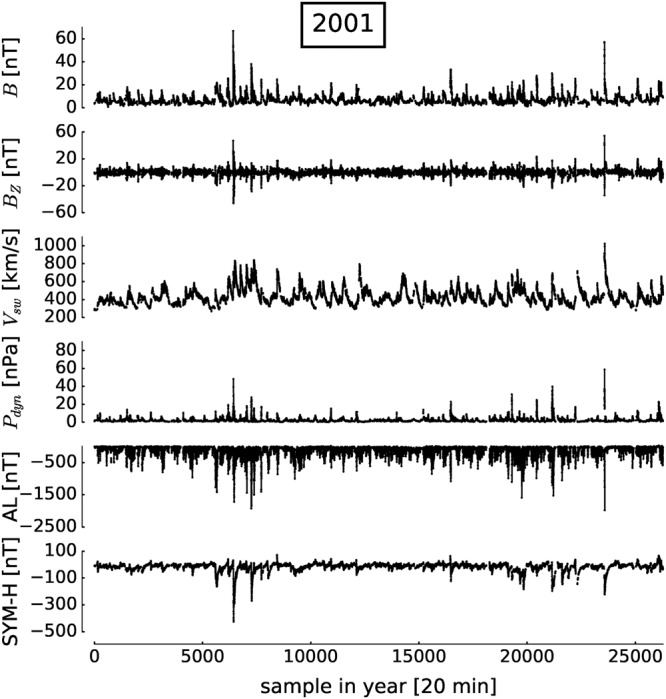
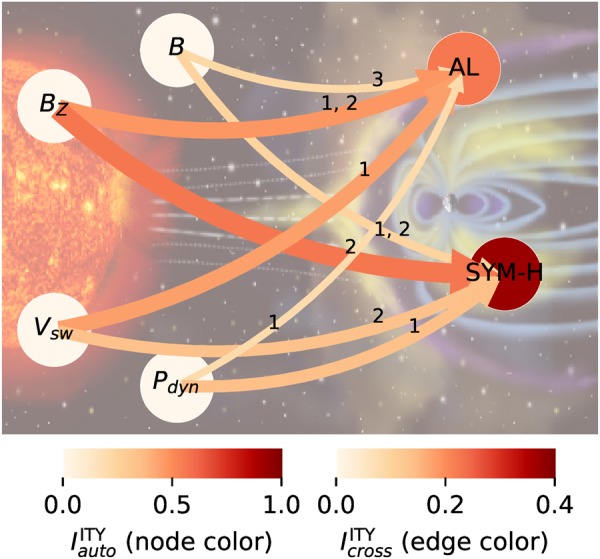
The dynamical relationship between magnetic storms and magnetospheric substorms is one of the most controversial issues of contemporary space research. Here, we address this issue through a causal inference approach to two corresponding indices in conjunction with several relevant solar wind variables. We find that the vertical component of the interplanetary magnetic field is the strongest and common driver of both storms and substorms. Further, our results suggest, at least based on the analyzed indices, that there is no statistical evidence for a direct or indirect dependency between substorms and storms and their statistical association can be explained by the common solar drivers. Given the powerful statistical tests we performed (by simultaneously taking into account time series of indices and solar wind variables), a physical mechanism through which substorms directly or indirectly drive storms or vice versa is, therefore, unlikely.


Conflict of interest statement

The authors declare no competing interests.

Figures

Figure 1
Figure 1
Time series of solar and magnetospheric variables for 2001. Time points with missing values in any of the variables are excluded from the analysis, taking lags into account. Clearly, there is strong solar and magnetospheric activity, in Supplementary Table S1 we classify storms into moderate, intense, and super-storm events.
Figure 2
Figure 2
Example of causal interactions in a three-variable process. (a) Time series graph which encodes the spatio-temporal dependencies. The set of parents PYt (blue boxes) separates Yt from the past of the whole process Xt\PYt, which implies conditional independence (Markov property) and is used in the algorithm to estimate the graph,. (b) Process graph, which aggregates the information in the time series graph for better visualization (labels denote the lags, link and node colors denote the cross- and auto-coupling strength).
Figure 3
Figure 3
Lag functions of information-transfer measures. The lag functions were estimated with nearest-neighbor CMI estimation parameter k = 50,. For example, the panel BZ → AL shows the lag function I(BZ,tτ;ALt|) of MI (Eq. (1), gray), bivTE excluding the past lag of AL (Eq. (2), black), and the multivariate ITY (Eq. (3), blue) conditioning out the influence also of other variables with the parents P given in Table 1. All (C)MI values have been rescaled to the (partial) correlation scale via I1e2I[0,1]. For ITY, the solid line marks the significance threshold. MI and bivTE are clearly significant for a large range of lags. Confidence intervals (errorbars) are mostly smaller than the dots. MI and bivTE with their broad peaks clearly provide no precise information about relevant drivers and coupling delays. On the other hand, ITY features large values only at few selected lags. In Supplementary Fig. S1 we show that these results are robust for further method parameters and storm indices.
Figure 4
Figure 4
Graph based on significant ITY values at the 95% level in Fig. 3. Edges correspond to directional lagged links, and the labels indicate their lags. If more than one lag is significant, they are listed in the order of their strength. The edge color and width indicate the value at the lag with the largest ITY. The node color depicts the strength of the lag-1 auto-dependency for AL and SYM-H. Note that the weak ITY value in BZ → SYM-H is likely due to BZ occurring with two neighboring lags in the parents of SYM-H, which reduces the information transfer of either of them. In Supplementary Fig. S2 we show the robustness of these results using a different CMI estimation parameter and another substorm index.

References

    1. Pulkkinen TI, et al. Solar wind - magnetosphere coupling: A review of recent results. J. Atmos. and Solar Terr. Phys. 2007;69:256–264. doi: 10.1016/j.jastp.2006.05.029. - DOI
    1. Sharma A. S., Baker D. N., Grande M., Kamide Y., Lakhina G. S., McPherron R. M., Reeves G. D., Rostoker G., Vondrak R., Zelenyiio L. Disturbances in Geospace: The Storm-Substorm Relationship. Washington, D. C.: American Geophysical Union; 2003. The Storm-substorm relationship: Current understanding and outlook; pp. 1–14.
    1. Akasofu S, Cain JC, Chapman S. The Magnetic Field of a Model Radiation Belt, Numerically Computed. Journal of Geophysical Research. 1961;66:4013–4026. doi: 10.1029/JZ066i012p04013. - DOI
    1. Gonzalez WD, Joselyn JA, Kamide Y. What is a geomagnetic storm? Journal of Geophysical Research: Space Physics. 1994;99:5771–5792. doi: 10.1029/93JA02867. - DOI
    1. Kamide Y, et al. Current understanding of magnetic storms: Storm-substorm relationships. Journal of Geophysical Research: Space Physics. 1998;103:17705–17728. doi: 10.1029/98JA01426. - DOI