. 2018 Nov 19:10.1038/nbt.4303.
doi: 10.1038/nbt.4303. Online ahead of print.

T cell receptor fingerprinting enables in-depth characterization of the interactions governing recognition of peptide-MHC complexes

Affiliations

T cell receptor fingerprinting enables in-depth characterization of the interactions governing recognition of peptide-MHC complexes

Amalie K Bentzen et al. Nat Biotechnol. .

Abstract

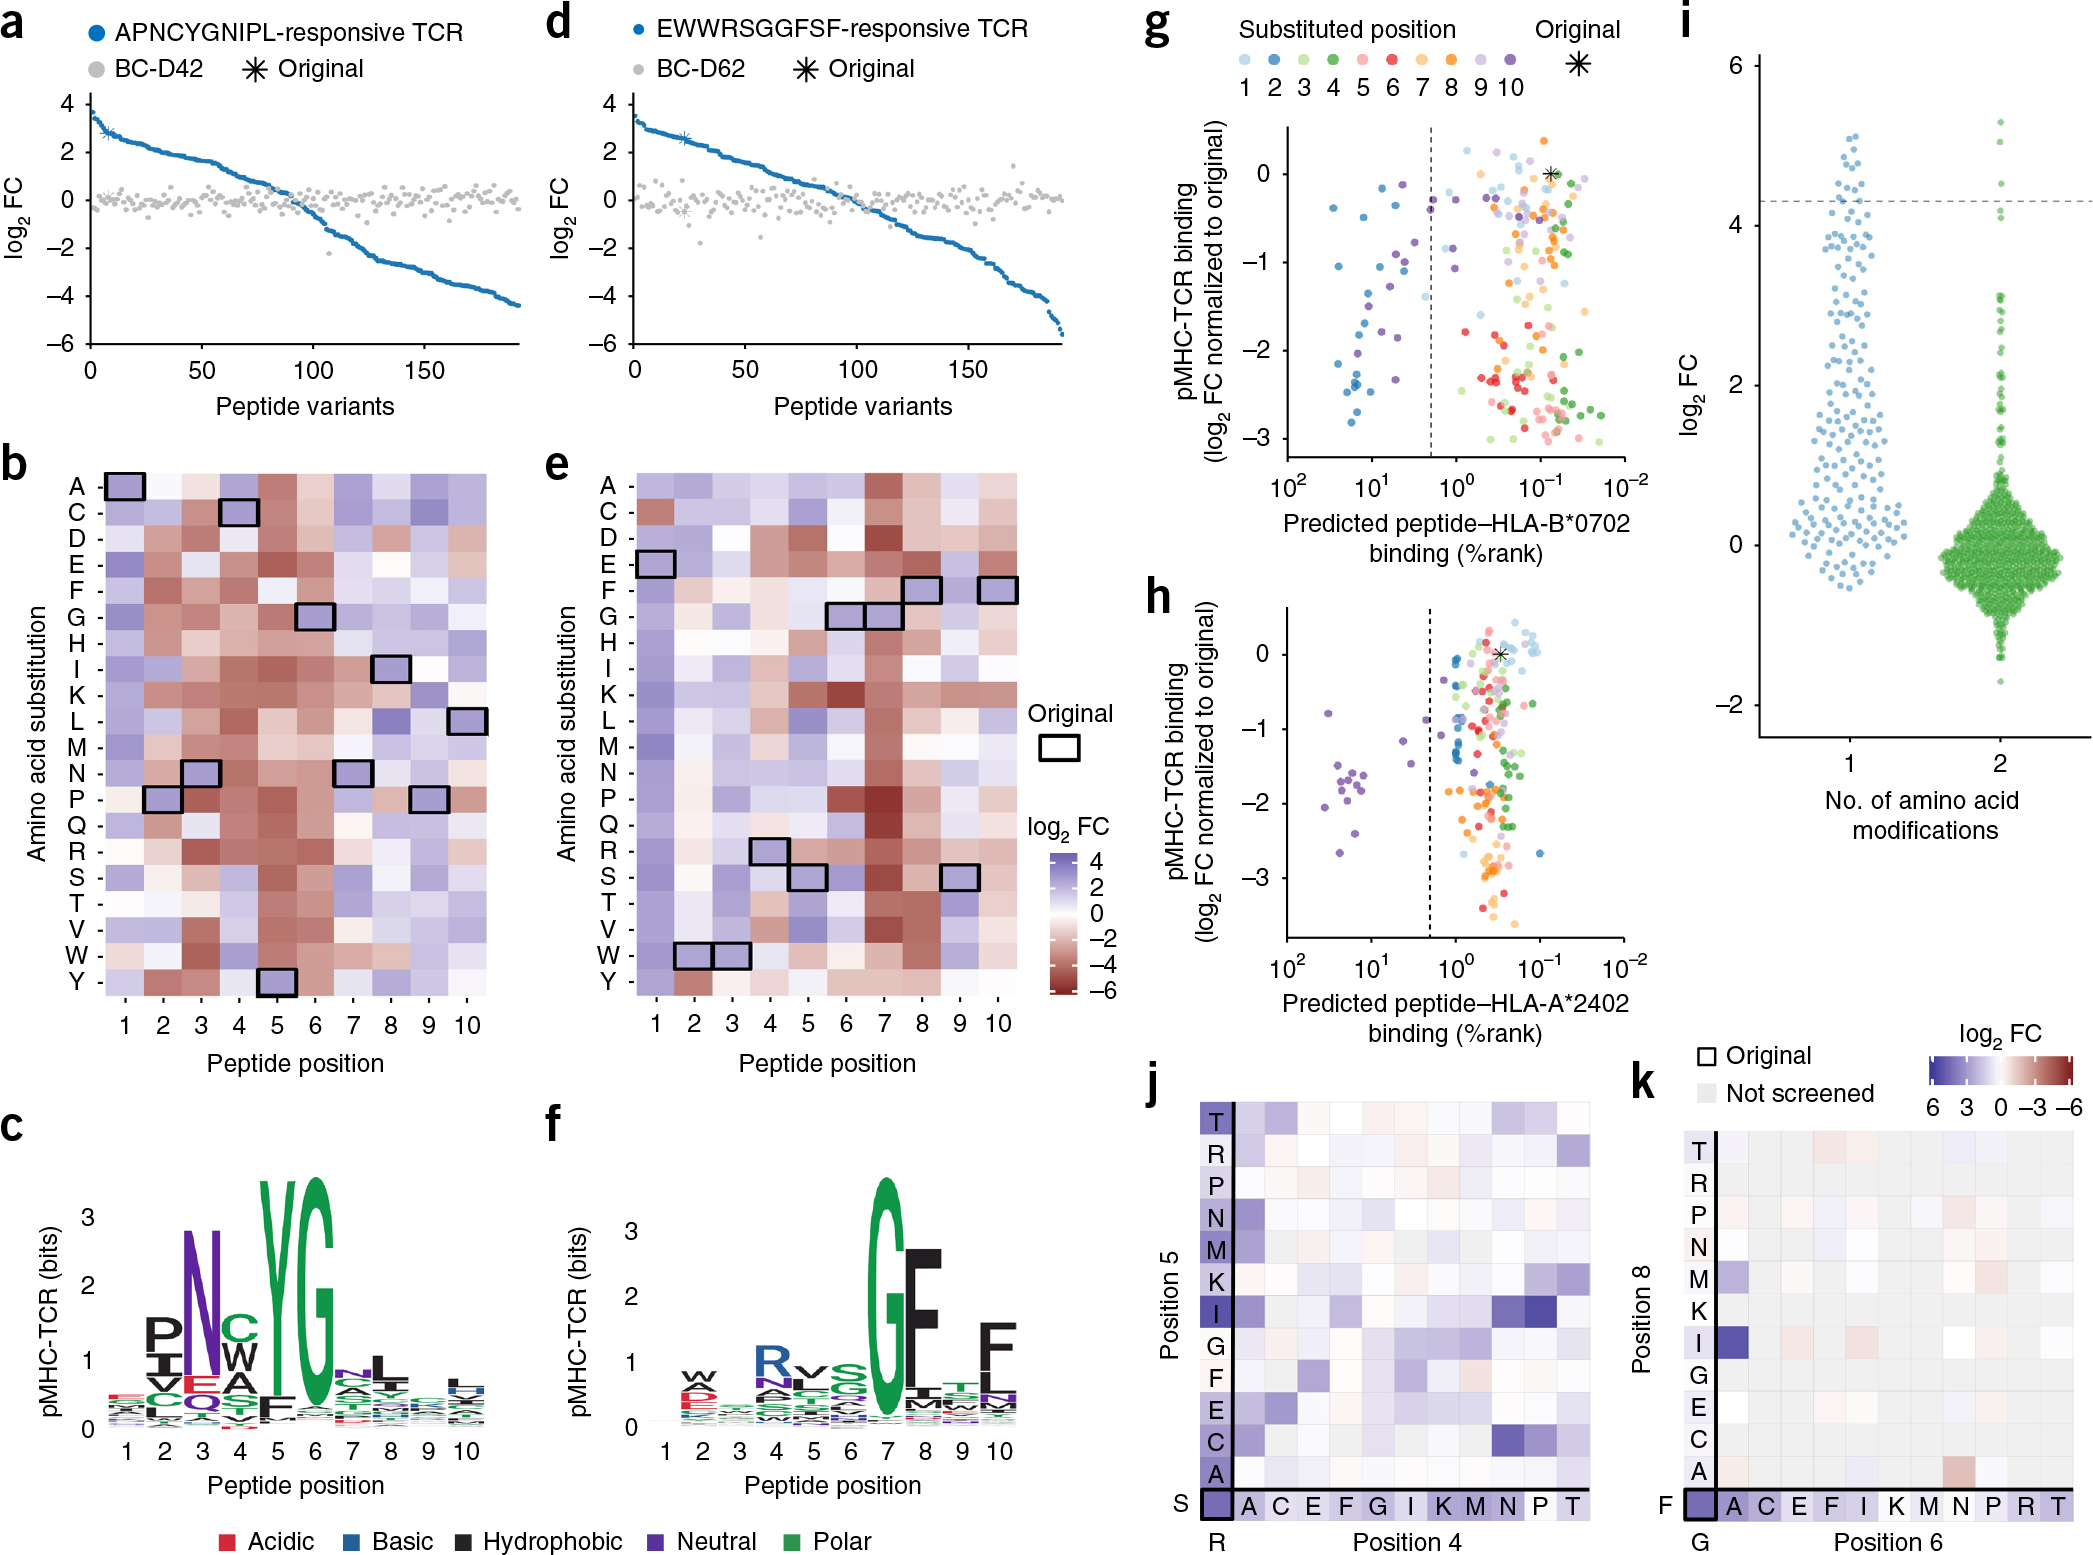
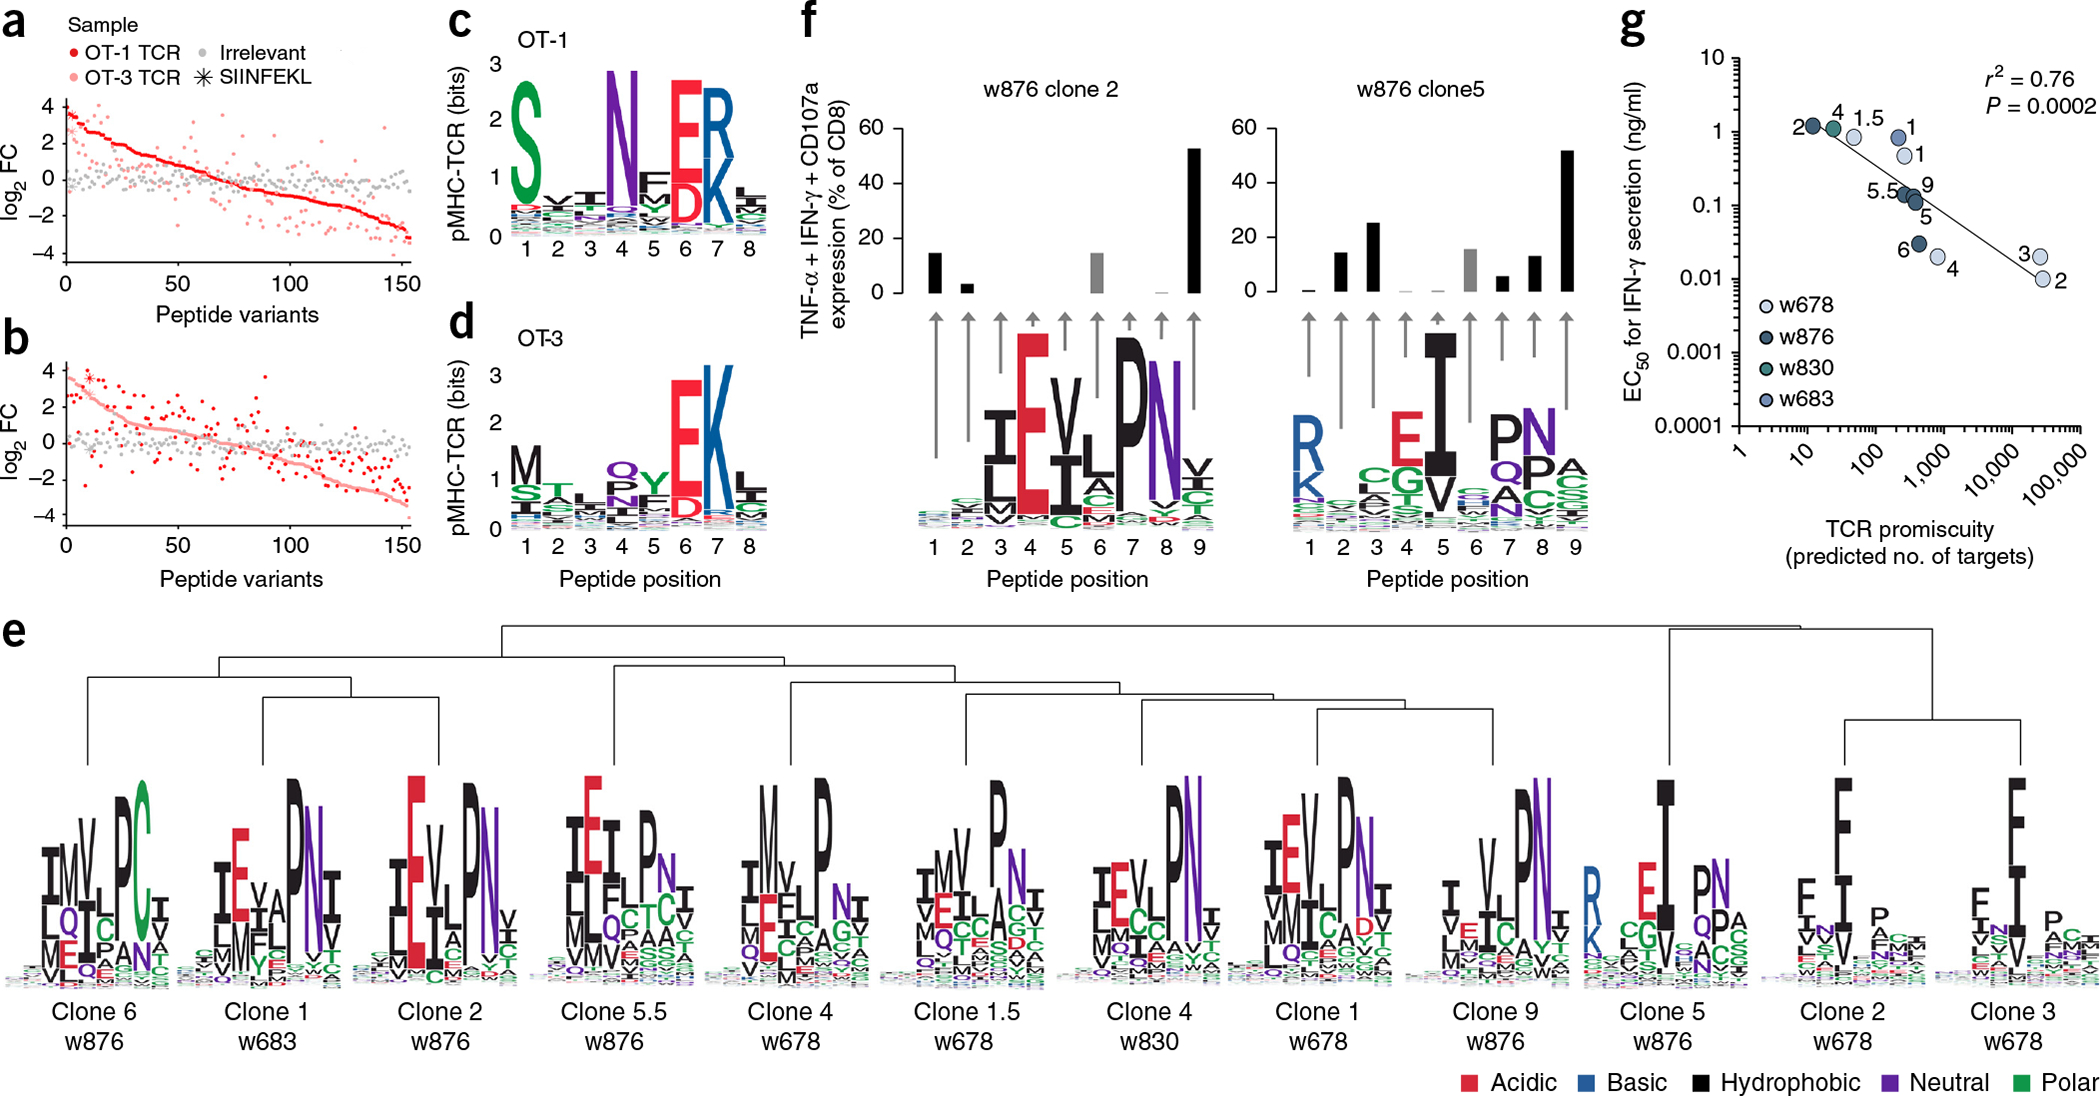
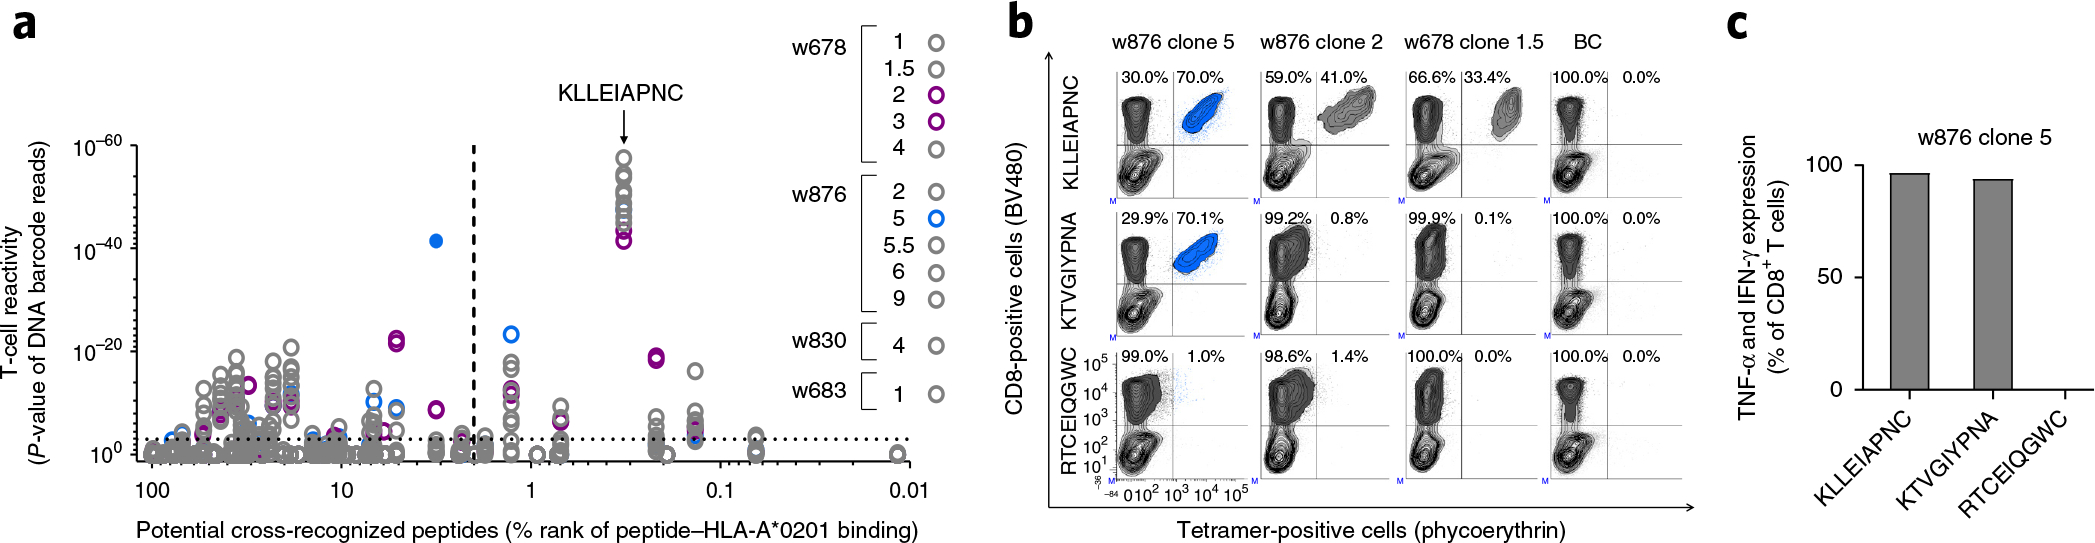
The promiscuous nature of T-cell receptors (TCRs) allows T cells to recognize a large variety of pathogens, but makes it challenging to understand and control T-cell recognition. Existing technologies provide limited information about the key requirements for T-cell recognition and the ability of TCRs to cross-recognize structurally related elements. Here we present a 'one-pot' strategy for determining the interactions that govern TCR recognition of peptide-major histocompatibility complex (pMHC). We measured the relative affinities of TCRs to libraries of barcoded peptide-MHC variants and applied this knowledge to understand the recognition motif, here termed the TCR fingerprint. The TCR fingerprints of 16 different TCRs were identified and used to predict and validate cross-recognized peptides from the human proteome. The identified fingerprints differed among TCRs recognizing the same epitope, demonstrating the value of this strategy for understanding T-cell interactions and assessing potential cross-recognition before selection of TCRs for clinical development.


Conflict of interest statement

COMPETING INTERESTS

A.K.B. and S.R.H. are co-inventors on a patent covering the use of DNA barcode-labeled MHC multimers (WO2015185067 and WO2015188839). N.J.M., C.D.C., D.M.K. and P.N. are co-inventors on a patent application filed by their employer, University of Washington, concerning the HLA-A*0201-restricted TCR sequences.

Figures

Figure 1
Figure 1
The fingerprints of two different TCRs that recognize MCC-derived peptides restricted to HLA-B*0702 or HLA-A*2402. (ac) Results obtained from the DNA barcode-based analysis of T cells transduced with a TCR recognizing the HLA-B*0702 -restricted peptide APNCYGNIPL. The analysis was performed with all possible variations of peptides created by single-position amino acid substitutions. (a) The hierarchy of pMHC interactions expressed as log2FC of read counts relative to a triplicate baseline sample (see Supplementary Note 1). A healthy donor PBMC sample (BC-D42) was screened with the same MHC multimer panel in parallel. For both samples, the plotted order of log2FCs of each pMHC-associated DNA barcode is determined by the hierarchy obtained from screening the HLA-B*0702APN-responsive TCR. (b) Heat map of amino acid preferences of the HLA-B*0702APN-responsive TCR based on data from a. Each row represents a given amino acid and each column a position in the peptide sequence. The amino acids of the original peptide target are marked in black boxes. (c) Recognition pattern of the HLA-B*0702APN-interacting TCR, here visualized as a sequence logo based on the data from a and b. (df) Results obtained from the DNA barcode-based analysis of T cells transduced with a TCR recognizing the HLA-A*2402-restricted peptide EWWRSGGFSF. The analysis was performed with all possible variations of peptides created by single-position amino acid substitutions. Visualization of data corresponds to ac. b and e are colored according to the same key. (g,h) Scatter plot of the predicted peptide binding, percentage rank (%rank, x axis) of all naturally occurring amino acid substitutions of APNCYGNIPL to HLA-B*0702 (g) or EWWRSGGFSF to HLA-A*2402 (h), in relation to the experimentally obtained TCR–pMHC interaction (y axis). The color indicates the position of the amino acid substitution. %rank < 2 (dotted line) marks the recommended cutoff of peptides that are considered binders to MHC. (ik) Results from a parallel MHC multimer analysis of the TCR recognizing the HLA-A*2402 restricted peptide EWWRSGGFSF with a MHC multimer library composed of peptides with single amino acid substitutions corresponding to the one used in df, as well as double amino acid substitutions covering 12 naturally occurring amino acids, where positions 4–8 are substituted two amino acids at a time (n = 967; see full list in Supplementary Data 4 and 7). (i) The obtained log2FC values, grouped according to the number of substitutions, one (n = 191) or two (n = 776), within the peptide sequence. Dotted line at 4.30 indicates the original peptide. (j,k) Heat maps showing the log2FC obtained for peptides with amino acids substituted at (j) positions 4 and 5 simultaneously or (k) positions 6 and 8 simultaneously. Each row and column represents a given amino acid substitution (see heat map of all screened substitutions in Supplementary Fig. 9). The original amino acids are marked in bold and peptides in the same row or column are substituted at only one position, indicated with the one-letter code. j and k are colored according to the same key. All data are representative of duplicate analyses.
Figure 2
Figure 2
Diverse recognition patterns of TCRs recognizing the same pMHC epitope. (a,b) The TCR-pMHC interaction hierarchy obtained from DNA barcode-based analysis of mouse OT-1 (dark red) and OT-3 (light red) T cells, both recognizing the H-2Kb-restricted peptide SIINFEKL. The analyses were performed with all possible variations of peptides created by single-position amino acid substitutions. log2FC of read counts relative to a triplicate baseline (see Supplementary Note 1) is plotted according to the hierarchy obtained from the OT-1 T cells (a) or the OT-3 T cells (b), compared to the signal obtained using T cells from wild-type C57BL/6 mice (irrelevant), all screened with the same MHC multimer panel. (c,d) The different TCR fingerprints obtained from the screening of (c) OT-1 and (d) OT-3 derived T cells. The OT-1 and OT-3 T cells were screened once. See Supplementary Figure 10 for the read counts of the corresponding data and Supplementary Figure 11 for single fluorescence-based MHC multimer stainings of a range of SIINFEKL variants. (e) TCR fingerprints of 12 MCC clones all originally identified for their recognition of the HLA-A*0201-restricted peptide KLLEIAPNC. The fingerprints are clustered according to the similarity of their recognition pattern. Data are representative of duplicate analyses. (f) Bar plots showing cytokine secretion after stimulating the clonal T cells with peptides containing alanine substitutions at the indicated positions compared to the obtained TCR fingerprints (from e) of clone 2 and clone 5, w876. The gray bars indicate the original peptide, which has an alanine at position 6. Cytokine secretion was determined once (individual frequencies are shown in Supplementary Fig. 12). TNF, tumor necrosis factor; IFN, interferon. (g) Correlation between the number of targets estimated for each TCR, based on data from e (x axis), and the obtained half-maximal effective concentration (EC50) values of each clone (y axis). Each dot represents one T-cell clone. Dots of the same color indicate clones derived from one patient. R2 is based on Pearson’s r on the log-transformed values (n = 12 individual T cell clones).
Figure 3
Figure 3
Cross-reactivity of HLA-A*A0201KLL-responsive TCRs. (a) Screening for T-cell recognition of 75 peptides that are potentially cross-recognized by one or more of the 12 clonal T cells that have the HLA-A*A0201-restricted KLLEIAPNC peptide as original target. For each clone the top ten potential cross-reactive peptides were synthetized and used to screen for TCR cross-recognition using DNA barcode-labeled MHC multimers. Total library size was 75 peptides (Supplementary Data 12). The P-values resulting from the DNA barcode-based screen of all 75 pMHC multimers and all 12 clones are plotted (y axis) according to percentage rank score (%rank, x axis). Dotted line at y = 3 represent the selected threshold of false-discovery rate < 0.1%. Dotted line at x = 2 marks the recommended cutoff of peptides that are considered binders to MHC. The closed symbol indicates a response that was also confirmed by staining with fluorescently labeled MHC tetramers. The T-cell clones were screened twice. See Online Methods for statistical processing. (b) Contour plots from the fluorescently based tetramer screening of three clones that all recognize the original HLA-A*0201-restricted KLLEIAPNC peptide. Tetramers are generated from either the original peptide target (KLLEIAPNC), a peptide (KTVGIYPNA) that was cross-recognized by the TCR of clone 5, w876, in a, or a peptide (RTCEIQGWC) that was not recognized by any of the clones in a. The clones were spiked into a healthy donor PBMC sample (BC) in equal amounts. The percentage of total CD8+ T cells is indicated within the contour plots. (c) The frequency of cytokine-producing cells of CD8+ T cells after stimulating clone 5, w876, with HLA-A*0201-expressing cells pulsed with the indicated nonamer peptide. TNF, tumor necrosis factor; IFN, interferon. Tetramer staining and cytokine secretion were determined once.

References

    1. Sewell AK Why must T cells be cross-reactive? Nat. Rev. Immunol. 12, 669–677 (2012). - PMC - PubMed
    1. Obenaus M et al. Identification of human T-cell receptors with optimal affinity to cancer antigens using antigen-negative humanized mice. Nat. Biotechnol. 33, 402–407 (2015). - PubMed
    1. Cameron BJ et al. Identification of a Titin-derived HLA-A1-presented peptide as a cross-reactive target for engineered MAGE A3-directed T cells. Sci. Transl. Med. 5, 197ra103 (2013). - PMC - PubMed
    1. Davis MM & Bjorkman PJ T-cell antigen receptor genes and T-cell recognition. Nature 334, 395–402 (1988). - PubMed
    1. Mason D A very high level of crossreactivity is an essential feature of the T-cell receptor. Immunol. Today 19, 395–404 (1998). - PubMed