. 2018 Nov 16;7(11):214.
doi: 10.3390/cells7110214.

UBE2E1 Is Preferentially Expressed in the Cytoplasm of Slow-Twitch Fibers and Protects Skeletal Muscles from Exacerbated Atrophy upon Dexamethasone Treatment

Affiliations

UBE2E1 Is Preferentially Expressed in the Cytoplasm of Slow-Twitch Fibers and Protects Skeletal Muscles from Exacerbated Atrophy upon Dexamethasone Treatment

Polge Cécile et al. Cells. .

Erratum in

Abstract

Skeletal muscle mass is reduced during many diseases or physiological situations (disuse, aging), which results in decreased strength and increased mortality. Muscle mass is mainly controlled by the ubiquitin-proteasome system (UPS), involving hundreds of ubiquitinating enzymes (E2s and E3s) that target their dedicated substrates for subsequent degradation. We recently demonstrated that MuRF1, an E3 ubiquitin ligase known to bind to sarcomeric proteins (telethonin, α-actin, myosins) during catabolic situations, interacts with 5 different E2 enzymes and that these E2-MuRF1 couples are able to target telethonin, a small sarcomeric protein, for degradation. Amongst the E2s interacting with MuRF1, E2E1 was peculiar as the presence of the substrate was necessary for optimal MuRF1-E2E1 interaction. In this work, we focused on the putative role of E2E1 during skeletal muscle atrophy. We found that E2E1 expression was restricted to type I and type IIA muscle fibers and was not detectable in type IIB fibers. This strongly suggests that E2E1 targets are fiber-specific and may be strongly linked to the contractile and metabolic properties of the skeletal muscle. However, E2E1 knockdown was not sufficient for preserving the protein content in C2C12 myotubes subjected to a catabolic state (dexamethasone treatment), suggesting that E2E1 is not involved in the development of muscle atrophy. By contrast, E2E1 knockdown aggravated the atrophying process in both catabolic C2C12 myotubes and the Tibialis anterior muscle of mice, suggesting that E2E1 has a protective effect on muscle mass.

Keywords: E2 ubiquitin-conjugating enzymes; E3 ubiquitin ligases; MuRF1; UBE2E1; actin; atrophy; myosin heavy chain; skeletal muscle; ubiquitin-proteasome system.


Conflict of interest statement

The authors declare no conflict of interest.

Figures
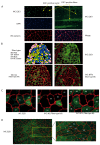
Figure 1
Figure 1
The E2E1 cytoplasmic expression is correlated to the metabolic and contractile properties of fibers. Serial cross-sections of the T. anterior muscle were processed as described in the Methods section. (A) Left panels exhibit E2E1 (Top panel), nuclei (DAPI, middle panel) and fiber boundaries (laminin-α1, bottom panel); merged images are shown in the left lower panel. Right upper panel, longitudinal section of T. anterior muscle allowed the detection E2E1 in some fibers; (B) Specific identification of fiber types and E2E1 in serial cross-sections showed that E2E1 was predominantly present in type IIA fibers although a faint labeling was also present in type IIX fibers. Results are summarized in false colors in the top left panel; (C) Enlargement of a portion of panel B confirms that E2E1 is predominantly expressed in type IIA fibers; (D) Human muscle serial cross-sections were used for detecting E2E1 and fiber types. Only E2E1 is shown but the processing was the same as for panel B and C. Only a limited number of fibers are labeled in the enlarged portion of the section (right panel) for more clarity. E2E1 is highly expressed in type I fibers indicating an expression dependent on the metabolic and contractile properties of the cells.
Figure 2
Figure 2
α-actin is targeted for degradation by the MuRF1-E2E1 couple in heterologous cells. Following transfection, α-actin (Act) was expressed in HEK293T cells either alone or with MuRF1 and E2 enzymes; Act-MuRF1, co-transfection of α-actin and MuRF1; Act-MuRF1-D2, co-transfection of α-actin, MuRF1 and E2D2; Act-MuRF1-E1, co-transfection of α-actin, MuRF1, and E2E1. Cells were lyzed and immunoblotting (IB) against α-actin and densitometric analyses were performed as previously described (14). n = 6 per group. * Statistically different when compared to Act-MuRF1 group, p < 0.05.
Figure 3
Figure 3
Myosin heavy chain (MHCIIa) is not targeted for degradation by the MuRF1-E2E1 couple in heterologous cells. MHCIIa-flag (MHC) was transfected in HEK293T cells either alone or co-transfected with MuRF1 and different E2 enzymes. Cells were lyzed and immunoblotting (IB) against the flag peptide and densitometric analysis were performed as previously described [16] except that PCNA was used as a loading control. (A) We first verified that MHC was expressed in HEK293T cells and that the signal was specific of MHCIIa transfection. In addition, MuRF1 was able to drive part of the MHCIIa protein for degradation in combination with endogenous E2 enzymes; (B) E2E1 was not able to promote MHCIIa for degradation in presence of MuRF1. MHC-MuRF1, co-transfection of MHCIIa and MuRF1; MHC-MuRF1-D2, co-transfection of MHCIIa, MuRF1, and E2D2; MHC-MuRF1-E1, co-transfection of MHCIIa, MuRF1 and E2E1. Values are means ± SE for n = 6 per group. * Statistically different from controls; † Statistically different from the MHC group, p < 0.05.
Figure 4
Figure 4
E2E1 knockdown did not significantly modify the overall protein content in catabolic C2C12 myotubes. C2C12 myoblasts were cultured in 24-well plates and differentiated into myotubes for 5 days (d5) as previously described [14]. Using a NEPA21 electroporator, myotubes were transfected at d5 with the shRNAs targeting the indicated E2 and E3 enzymes. C2C12 myotubes were also treated or not with dexamethasone (Dex, 1 µM) at d5. Myotubes were lyzed after 48 h Dex and shRNA treatments and the soluble and myofibrillar fractions were carefully determined as previously described [16]. For more accuracy, we pooled the cell lysates from 4 wells and repeated it 6 times (n = 6, but with 24 wells). (A) Total proteins; (B) Myofibrillar-enriched fraction; (C) Soluble fraction. Values are means ± SE for n = 6 per group. *, Statistically different from the -Dex group, p < 0.01.
Figure 5
Figure 5
The E2E1 knockdown lowered the myofibrillar α-actin and MHC levels in catabolic C2C12 myotubes. C2C12 myotubes were cultured in 24-well plates, treated with Dex and electroporated as explained in the Figure 4 legend. Total lysate was fractionated in myofibrillar-enriched and soluble proteins as previously described [16]. Soluble (A,B) and myofibrillar (B,D) proteins were assayed for α-actin (A,C) and MHC (B,D) levels by immunoblotting. PCNA was used as a loading control. Values are means ± SE for n = 6 per group. E2E1 knockdown tended to depress α-actin (p = 0.05) and MHCIIa (p = 0.13) levels in the myofibrillar fraction. (E) The levels of Pro-caspase 3 and cleaved caspase 3 (i.e., the active form) were addressed in the soluble fraction (20 µg per lane). As a positive control of the antibodies used, we loaded apoptotic MEF cells lysate (a gift from Dr. J. Averous) (CT(+)). A strong induction of apoptosis (witnessed by caspase 3 cleavage) was detected in these cells. In contrast, we did not detect any activation of caspase 3 in E2E1-knocked down C2C12 myotubes.
Figure 6
Figure 6
The Dex-treatment induced muscle atrophy in C57BL/6 mice. Animals were treated or not treated with Dex at 1 or 5 mg/kg/d for 5 to 14 days. The length of Dex-treatment was adapted to the dose for avoiding excessive weight loss of animals. (A) IHC was performed using anti-laminin-α1 (left and middle panels) and the fiber cross-sectional area was determined using the Visilog-6.9 software (right panel). The lowest dose of Dex was efficient for inducing muscle atrophy and depressing the fiber diameter by −22 to −24%; (B,C) The expression levels of the E3 ligases MuRF1; (C) and MAFbx (D) were addressed by qRT-PCR in mice subjected to Dex-treatment (1 mg/kg/d). More than a 2-fold increase was observed for both E3 ligases; (D,E) Same as (B,C) but with 5 mg/kg/d of Dex. A 3 to 5-fold increase of both MuRF1 and MAFbx mRNA levels was observed. Values are means ± SE for n = 4–5 per group. *, Significantly different from control (CT) group, p < 0.05.
Figure 7
Figure 7
The E2E1 knockdown induced a decrease of cross-sectional area (CSA). Mice were transfected either with a scramble siRNA (scr-siRNA, left leg) targeting no known coding sequence or with a mixture of 4 siRNAs (siE2E1, right leg) directed against E2E1. Each plasmid also encoded for emGFP, which allowed for identifying transfected and non-transfected cells within each muscle. Cross-sections were also labeled with anti-laminin-α1 for determining CSA (see Methods section and Figure 6 legend for details). Two different zones and a minimum of 100 fibers were used for each muscle. (A) GFP positive fibers were visually smaller in siE2E1-treated fibers; a typical result is shown; (B) CSA analysis from n = 6 mice and a total of 1449 fibers were analyzed using a 1-way ANOVA and confirmed using a 3-way ANOVA. A 31% decrease of CSA was observed upon E2E1 knockdown (siE2E1) in GFP-positive fibers (i.e., transfected fibers, siE2E1 group) when compared to GFP-negative fibers (i.e., non-transfected fibers, NT group). There was no difference when muscles were transfected with the scramble siRNA. *, Statistically different from the NT group, p < 0.001); (C) Fibers distribution was analyzed within each muscle by grouping CSAs by 200 µm2 steps. A global shift towards lower CSAs was observed in the E2E1 knocked down fibers when compared to their corresponding controls (NT).

References

    1. Fearon K., Arends J., Baracos V. Understanding the mechanisms and treatment options in cancer cachexia. Nature reviews. Clin. Oncol. 2013;10:90–99. - PubMed
    1. Von Haehling S., Anker M.S., Anker S.D. Prevalence and clinical impact of cachexia in chronic illness in Europe, USA, and Japan: Facts and numbers update 2016. J. Cachexia Sarcopenia Muscle. 2016;7:507–509. doi: 10.1002/jcsm.12167. - DOI - PMC - PubMed
    1. Sandri M. Protein breakdown in muscle wasting: Role of autophagy-lysosome and ubiquitin-proteasome. Int. J. Biochem. Cell Biol. 2013;45:2121–2129. doi: 10.1016/j.biocel.2013.04.023. - DOI - PMC - PubMed
    1. Wang Y., Pessin J.E. Mechanisms for fiber-type specificity of skeletal muscle atrophy. Curr. Opin. Clin. Nutr. Metab. Care. 2013;16:243–250. doi: 10.1097/MCO.0b013e328360272d. - DOI - PMC - PubMed
    1. Talbot J., Maves L. Skeletal muscle fiber type: Using insights from muscle developmental biology to dissect targets for susceptibility and resistance to muscle disease. Wiley interdisciplinary reviews. Dev. Biol. 2016;5:518–534. - PMC - PubMed