Review
. 2018 Nov 18;19(11):3633.
doi: 10.3390/ijms19113633.

Protein Structural Dynamics of Wild-Type and Mutant Homodimeric Hemoglobin Studied by Time-Resolved X-Ray Solution Scattering

Affiliations
Review

Protein Structural Dynamics of Wild-Type and Mutant Homodimeric Hemoglobin Studied by Time-Resolved X-Ray Solution Scattering

Cheolhee Yang et al. Int J Mol Sci. .

Abstract

The quaternary transition between the relaxed (R) and tense (T) states of heme-binding proteins is a textbook example for the allosteric structural transition. Homodimeric hemoglobin (HbI) from Scapharca inaequivalvis is a useful model system for investigating the allosteric behavior because of the relatively simple quaternary structure. To understand the cooperative transition of HbI, wild-type and mutants of HbI have been studied by using time-resolved X-ray solution scattering (TRXSS), which is sensitive to the conformational changes. Herein, we review the structural dynamics of HbI investigated by TRXSS and compare the results of TRXSS with those of other techniques.

Keywords: allostery; homodimeric hemoglobin; molecular cooperativity; protein dynamics; time-resolved X-ray solution scattering.


Conflict of interest statement

The authors declare no conflict of interest.

Figures

Figure 1
Figure 1
(a) The magnified view of the subunit interface of the crystal structure of WT HbI(CO)2 (PDB ID: 3sdh) and (b) that of deoxy WT HbI (PDB ID: 4sdh). Protein structures are shown in cartoon representations (green). Eleven and seventeen interfacial water molecules for HbI(CO)2 and deoxy HbI, respectively, are shown with gray spheres. Two CO ligands are shown with connected red and green spheres. Heme, Thr72, and Phe97 are represented in orange, cyan, and magenta sticks, respectively. In the deoxy HbI, two interfacial water molecules interact with the hydroxyl group of Thr72 (red) via hydrogen bonds (yellow dotted lines).
Figure 2
Figure 2
The schematic illustration of kinetic analysis and structure refinement. Time-resolved difference scattering curves of HbI were analyzed by SVD and PCA methods to obtain the information on the structural dynamics of HbI, including the time-dependent population changes and the species-associated difference scattering curves for the optimal kinetic model. The structural information of HbI was further analyzed by comparing the result of the structure refinement using a Monte-Carlo simulation. By moving rigid bodies randomly, initial structures were made from the template structure, which is the crystal structure related with the intermediate. The initial structures were optimized into the interim structures based on a Monte-Carlo simulation by minimizing the discrepancies (the χ2 value) between the curves of the theoretical structures and the species-associated difference scattering curve of the intermediate. The best structures, which have χ2 values less than the arbitrary criteria, were selected as the candidate structures corresponding to the intermediate.
Figure 3
Figure 3
The structure refinement performed for the I3 intermediate of WT HbI (see Section 2.3) is shown as an example. Starting from 360 random initial structures generated by Monte Carlo simulations, we minimized the χ2 value, which is the degree of discrepancy between the experimental curve and the theoretical curve calculated from one of the starting structures, by exploring the structural space via Monte Carlo simulations guided by molecular dynamics (MD) force fields and simulated annealing. (a) The root mean square deviation (RMSD) for the initial structures (black dots) and the refined structures (red and blue dots) with respect to an arbitrary reference structure, which is the crystal structure of WT deoxy HbI (PDB ID: 4sdh) in this case, are plotted as functions of the χ2 values between the experimental curve and the theoretical curves. The best-refined structures (blue dots) are considered as the candidate structures. (b,c) Displacement plots for (b) 50 arbitrary structures chosen from among the 360 initial structures and (c) the 76 candidate structures. The displacement was calculated with respect to the crystal structure of WT HbI(CO)2 (PDB ID: 3sdh). Helices are indicated at the top of the plots. (d,e) Comparison of the experimental species-associated scattering curve with the theoretical scattering curves of (d) the 50 arbitrary structures and (e) the 76 candidate structures.
Figure 4
Figure 4
(a) The population changes of the three intermediates (I1, I2, and I3) and HbI(CO)2 for WT (black lines), F97Y (red lines), and T72V (blue lines) HbI obtained by kinetic analyses. The circles indicate the optimized populations obtained by fitting the experimental difference scattering curves with the species-associated difference scattering curves of the three intermediates shown in Figure 4b. (b) Species-associated difference scattering curves for the three intermediates of WT (black), F97Y (red), and T72V (blue) HbI. (c) A Kinetic model for HbI. The red (with “CO”) and white shapes represent ligated and photolyzed monomer subunits, respectively. The subunits of each intermediate are represented with different shapes, indicating the change in the tertiary structure during structural transitions. Two red octagons indicate a fully ligated form of I1, which is formed by the geminate recombination of CO with I2 and has an indistinguishable conformation compared to the photolyzed forms of I1. The two subunits of I3 rotating with respect to each other are represented to indicate the change in quaternary structure in the transition from I2 to I3. Time constants and bimolecular rate constants for WT, F97Y, and T72V HbI are shown in black, red, and blue, respectively. Percentage ratios for the geminate recombination of I2 to I1 are indicated in parenthesis.
Figure 5
Figure 5
(a) The illustration of structural parameters inspected in candidate structures of various intermediates. E and F helices of the subunit A are represented in yellow and blue, respectively, and two hemes are shown in orange sticks. The rotation axis of the subunit rotation is shown with the black line. (b) The occurrence distribution of the E–F distances calculated for I3WT (black), I3F97Y (red), and I3T72V (blue). (c) Heme–heme distances in the candidate structures of the intermediates plotted as a function of subunit rotation angle. The dots in green, orange, black, red, and blue corresponds to candidate structures of I1, I2, I3WT, I3F97Y, and I3T72V, respectively. The black, red, and blue arrows represent the I2 to I3 transition of WT, F97Y, and T72V HbI, respectively. Upon the I2 to I3 structural transition, WT HbI undergoes both subunit rotation and heme–heme distance contraction whereas T72V and F97Y HbI undergo only subunit rotation. For comparison, dots corresponding to crystal structures of deoxy forms of WT, F97Y, and T72V HbI (PDB IDs: 4sdh, 2aup, and 6hbi, respectively) compared with those of CO-bound forms (PDB IDs: 3sdh, 2auo, and 7hbi, respectively) are indicated in the magenta, cyan, and gray colors, respectively.
Figure 6
Figure 6
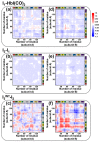
The averaged difference distance maps of the three intermediates of WT HbI. The difference distances between the intermediate and the reference structure were calculated. (ac) The difference distance maps between subunit A of the intermediate and that of the reference structure. (df) The difference distance maps between subunit A of the intermediate and subunit B of the reference. The color scale was set to be the same for all maps for comparison and is shown on the right-top of the figure. Helices are labeled in the top and right of each panel.

Similar articles

Cited by

References

    1. Perutz M.F. Stereochemistry of cooperative effects in haemoglobin. Nature. 1970;228:726–739. doi: 10.1038/228726a0. - DOI - PubMed
    1. Baldwin J., Chothia C. Haemoglobin: The structural changes related to ligand binding and its allosteric mechanism. J. Mol. Biol. 1979;129:175–220. doi: 10.1016/0022-2836(79)90277-8. - DOI - PubMed
    1. Shaanan B. Structure of human oxyhaemoglobin at 2.1 a resolution. J. Mol. Biol. 1983;171:31–59. doi: 10.1016/S0022-2836(83)80313-1. - DOI - PubMed
    1. Fermi G., Perutz M.F., Shaanan B., Fourme R. The crystal structure of human deoxyhaemoglobin at 1.74 a resolution. J. Mol. Biol. 1984;175:159–174. doi: 10.1016/0022-2836(84)90472-8. - DOI - PubMed
    1. Perutz M.F. Mechanisms of cooperativity and allosteric regulation in proteins. Q. Rev. Biophys. 1989;22:139–237. doi: 10.1017/S0033583500003826. - DOI - PubMed

LinkOut - more resources