Randomized Controlled Trial
. 2018 Nov 19;19(1):328.
doi: 10.1186/s12882-018-1128-6.

Renal outcomes of STOP-IgAN trial patients in relation to baseline histology (MEST-C scores)

Affiliations
Randomized Controlled Trial

Renal outcomes of STOP-IgAN trial patients in relation to baseline histology (MEST-C scores)

Judith Isabel Schimpf et al. BMC Nephrol. .

Abstract

Background: The Oxford classification of IgA nephropathy (IgAN) defines histologic criteria (MEST-C) that provide prognostic information based on the kidney biopsy. There are few data on the predictive impact of this classification in randomized clinical trial settings.

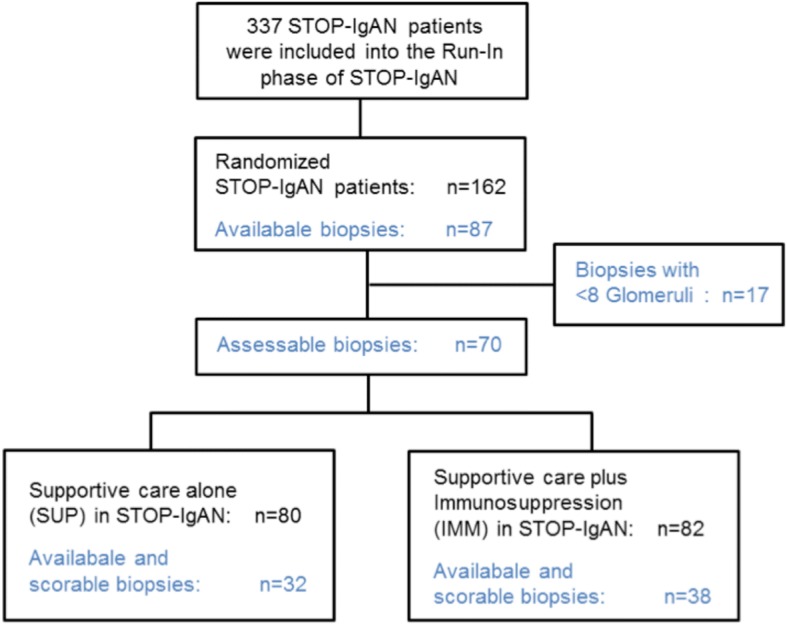
Methods: We performed an exploratory analysis of MEST-C scores in 70 available renal biopsies from 162 randomized STOP-IgAN trial participants and correlated the results with clinical outcomes. Analyses were performed by researchers blinded to the clinical outcome of the patients. Biopsies had been obtained 6.5 to 95 (median 9.4) months prior to randomization.

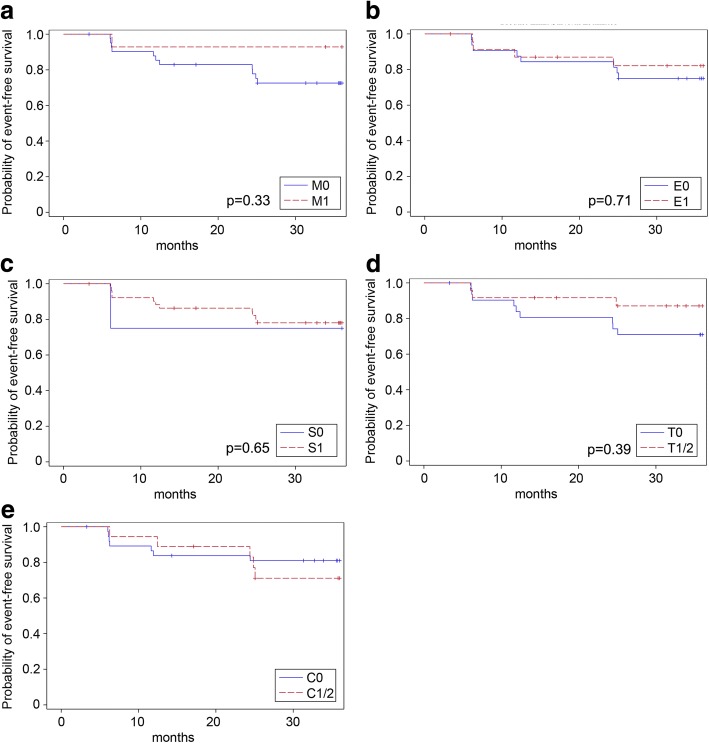
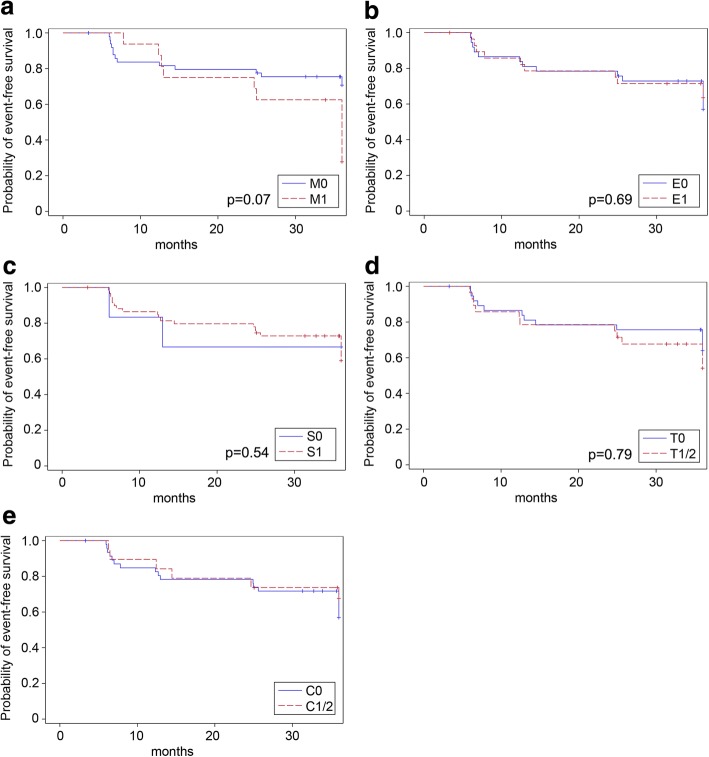
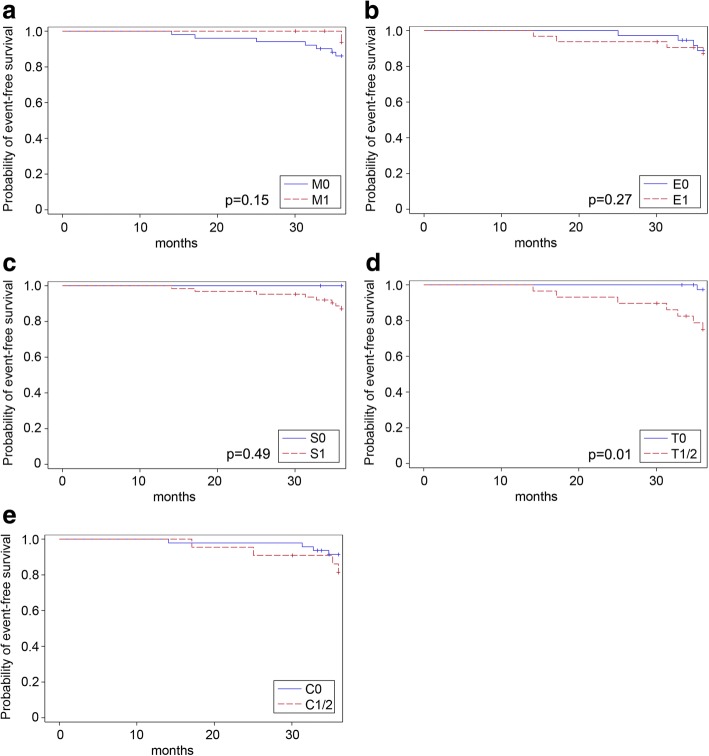
Results: Mesangial hypercellularity (M1) associated with higher annual eGFR-loss during the 3-year trial (M1: - 5.06 Β± 5.17 ml/min/1.73 m2, M0: - 0.79 Β± 4.50 ml/min/1.73 m2, p = 0.002). An M0-score additionally showed a weak association with full clinical remission, whereas the percentage of patients losing β‰₯15 ml/min/1.73 m2 over the 3-year trial phase was higher among those scored as M1. Among patients with additional immunosuppression, ESRD occurred more frequently in patients when tubulointerstitial fibrosis (T1/2) was present (T1/2 = 33%, T0 = 0%, p = 0.008). In patients receiving supportive care only, ESRD frequencies were similar (T1/2 = 18%, T0 = 7%, p = 0.603). At randomization, eGFR was significantly lower when tubulointerstitial fibrosis was present (T1/2: 45.2 Β± 15.7 ml/min/1.73 m2, T0: 74.6 Β± 28.2 ml/min/1.73 m2, p < 0.0001). Endocapillary hypercellularity (E), and glomerular segmental sclerosis (S) were not associated with any clinical outcome parameter. In the analyzed cohort, patients with glomerular crescents (C1/2 scores) in their biopsies were more likely to develop ESRD during the 3-year trial phase, but this trend was only significant in patients under supportive care.

Conclusions: This secondary analysis of STOP-IgAN biopsies indicates that M1, T1/2 and C1/2 scores associate with worse renal outcomes.

Keywords: IgA nephropathy; IgAN; MEST-C; Oxford classification; STOP-IgAN.


Conflict of interest statement

Ethics approval and consent to participate

The original study protocol of STOP-IgAN was amended in 2009 and allowed to retrieve all available original renal biopsies from randomized trial participants. Written informed consent for re-assessment of available kidney biopsies was obtained from all patients included in this secondary substudy. The STOP-IgAN trial as well as the current substudy were approved by the Ethics Committee at the RWTH Aachen University Hospital (reference number 159/07).

Consent for publication

Not applicable.

Competing interests

J. Floege has received consultant honoraria from Omeros, USA and Pharmalink, Sweden, and investigator fees from Anthera Pharmaceuticals Inc., USA. The other authors declare no competing financial interests.

Publisher’s Note

Springer Nature remains neutral with regard to jurisdictional claims in published maps and institutional affiliations.

Figures

Fig. 1
Fig. 1
Flowchart of analyzed patients. A total of 337 patients with biopsy-proven IgAN entered the run-in phase of the STOP-IgAN trial during which all patients received supportive care. After 6Β months, 162 patients were randomized to either continue on supportive care (n = 80) or received additional immunosuppression (n = 82). Upon amendment of the initial trial protocol in 2009, we aimed to retrieve the original kidney biopsies from the randomized patients for the current secondary analysis. Eventually, 70 biopsies were collected and could be scored using the MEST-C criteria
Fig. 2
Fig. 2
Quantitative morphometry of the T-score in kidney biopsies. In contrast to semiquantitative analyses of tubular atrophy and interstitial fibrosis (T-score) in previous validation studies of the Oxford MEST-C classification, we assessed the T-score of by quantitative morphometry of the tubulointerstitial area using a virtual microscope tool (MIRAX Viewer). The pathologic lesions in the cortical area were encircled and then put in relation to the entire cortical area
Fig. 3
Fig. 3
Kaplan-Meier curves for the event β€œfull clinical remission” based on the M-score (a), E-score (b), S- score(c), T-score (d) and C-score (e). Full clinical remission was defined as urinary protein-creatinine ratio < 0.2Β g/g and an eGFR decrease of < 5Β ml/min/1.73m2. Univariate Cox regression yielded the following p-values: M-score: p = 0.41; E-score: p = 0.46; S-score: p = 0.38; T-score: p = 0.39. Multivariate Cox regression adjusting for GFR and proteinuria at baseline and the treatment arm yielded the following p-values (also given in the figure): M-score: p = 0.33; E-score: p = 0.71; S-score: p = 0.65; T-score: p = 0.39). For the C-score, the proportional hazard assumption was not met
Fig. 4
Fig. 4
Kaplan-Meier curves for the event β€œeGFR-loss β‰₯15 ml/min/1.73 m2” based on the M-score (a), E-score (b), S-score (c), T-score (d) and C-score (e). Univariate Cox regression yielded the following p-values: M-score: p = 0.08; E-score: p = 0.41; S-score: p = 0.91; T-score: p = 0.15. Multivariate Cox regression adjusting for GFR and proteinuria at baseline and the treatment arm yielded the following p-values (also given in the figure): M-score: p = 0.07; E-score: p = 0.69; S-score: p = 0.54; T-score: p = 0.79). For the C-score, the proportional hazard assumption was not met
Fig. 5
Fig. 5
Kaplan-Meier curves for the event β€œESRD development” based on the M-score (a), E-score (b), S-Sscore (c), T-score (d) and C-score (e). Univariate Cox regression yielded the following p-values: M-score: p = 0.32; E-score: p = 0.96; S-score: p = 0.90; T-score: p = 0.02. Multivariate Cox regression adjusting for GFR and proteinuria at baseline and the treatment arm yielded the following p-values (also given in the figure): M-score: p = 0.15; E-score: p = 0.27; S-score: p = 0.49; T-score: p = 0.01). For the C-score, the proportional hazard assumption was not met

References

    1. Barratt J, Feehally J. IgA nephropathy. J Am Soc Nephrol. 2005;16:2088–2097. doi: 10.1681/ASN.2005020134. - DOI - PubMed
    1. Wyatt RJ, Julian BA. IgA nephropathy. N Engl J Med. 2013;368:2402–2414. doi: 10.1056/NEJMra1206793. - DOI - PubMed
    1. Cattran DC, Coppo R, Cook HT, Feehally J, Roberts IS, Troyanov S, et al. The Oxford classification of IgA nephropathy: rationale, clinicopathological correlations, and classification. Kidney Int. 2009;76:534–545. doi: 10.1038/ki.2009.243. - DOI - PubMed
    1. Roberts IS, Cook HT, Troyanov S, Alpers CE, Amore A, Barratt J, et al. The Oxford classification of IgA nephropathy: pathology definitions, correlations, and reproducibility. Kidney Int. 2009;76:546–556. doi: 10.1038/ki.2009.168. - DOI - PubMed
    1. Alamartine E, Sauron C, Laurent B, Sury A, Seffert A, Mariat C. The use of the Oxford classification of IgA nephropathy to predict renal survival. Clin J Am Soc Nephrol. 2011;6:2384–2388. doi: 10.2215/CJN.01170211. - DOI - PMC - PubMed

Publication types

LinkOut - more resources