. 2018 Nov 19;37(1):278.
doi: 10.1186/s13046-018-0933-x.

Semaphorin 5A drives melanoma progression: role of Bcl-2, miR-204 and c-Myb

Affiliations

Semaphorin 5A drives melanoma progression: role of Bcl-2, miR-204 and c-Myb

Simona D'Aguanno et al. J Exp Clin Cancer Res. .

Abstract

Background: Melanoma, the most aggressive form of skin cancer, is characterized by high rates of metastasis, drug resistance and mortality. Here we investigated the role of Semaphorin 5A (Sema5A) on the properties associated with melanoma progression and the factors involved in Sema5A regulation.

Methods: Western blotting, qRT-PCR, Chromatin immunoprecipitation (ChIP) assay, immunohistochemistry of melanoma patient specimens and xenograft tissues, in vitro Transwell assay for cell migration and invasion evaluation, in vitro capillary-like structure formation analysis.

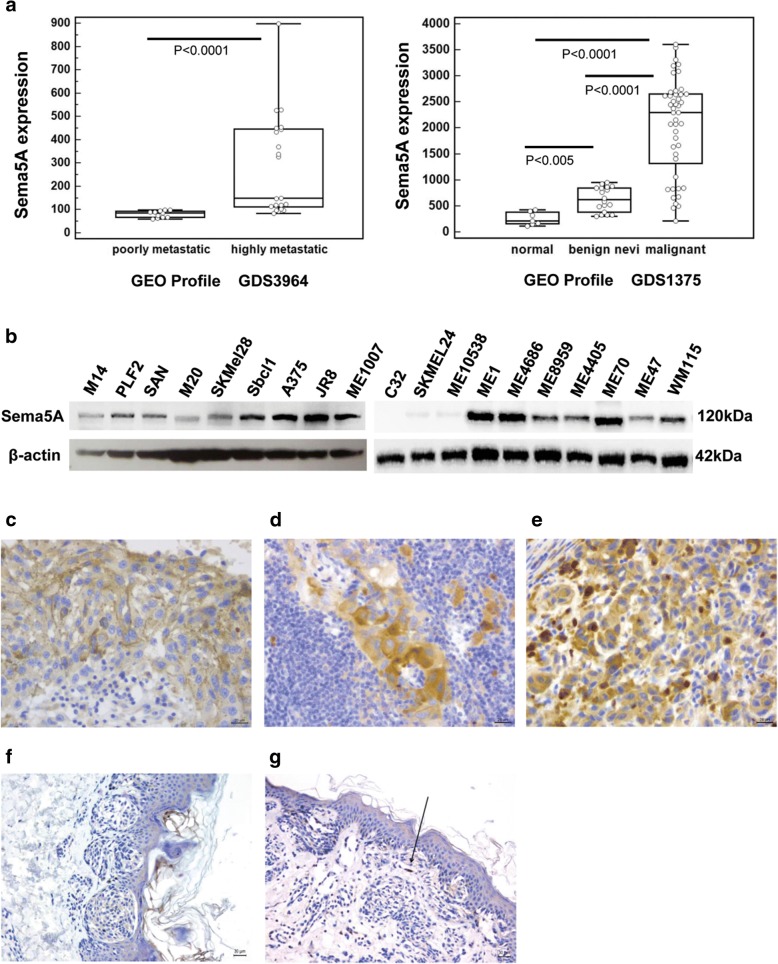
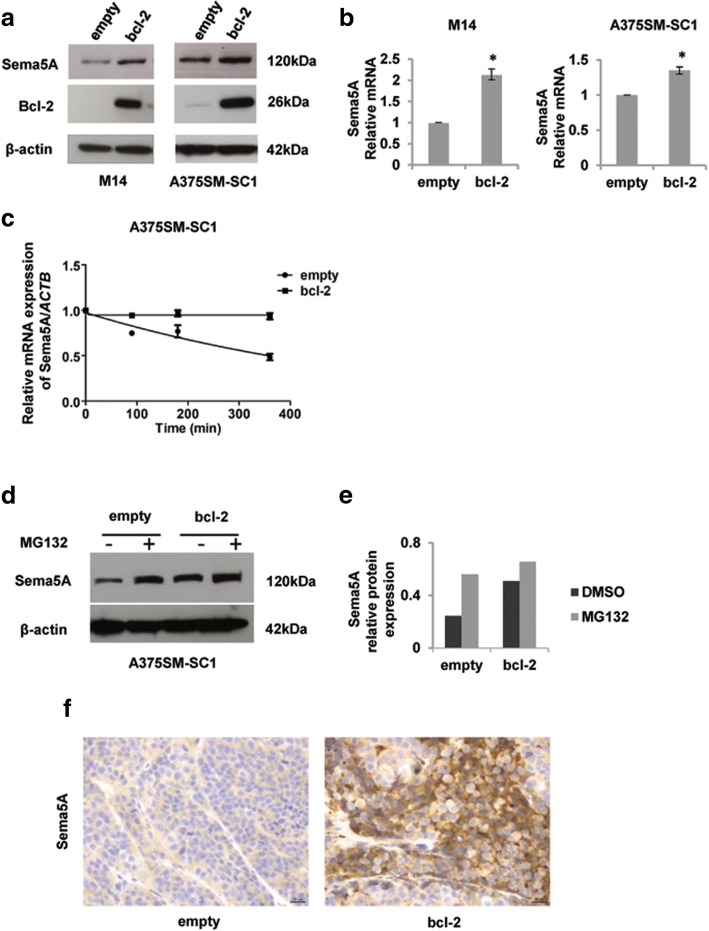
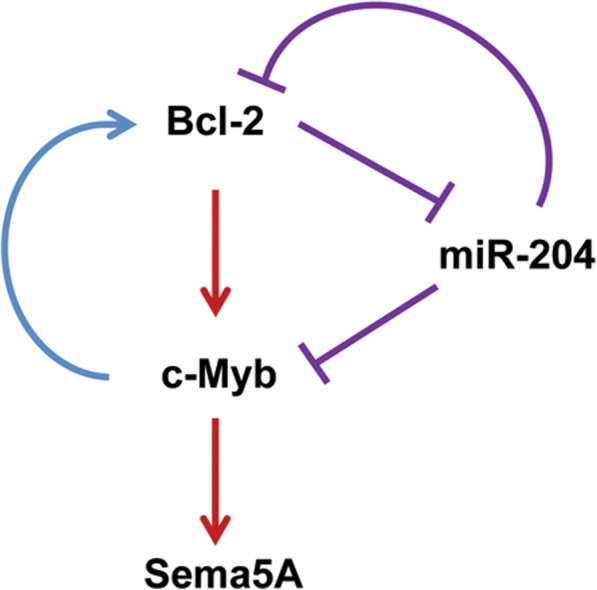
Results: A significant correlation of Sema5A mRNA expression and melanoma progression was observed by analyzing GEO profile dataset. Endogenous Sema5A protein was detected in 95% of human melanoma cell lines tested, in 70% of metastatic specimens from patients affected by melanoma, and 16% of in situ melanoma specimens showed a focal positivity. We demonstrated that Sema5A regulates in vitro cell migration and invasion and the formation of vasculogenic structures. We also found an increase of Sema5A at both mRNA and protein level after forced expression of Bcl-2. By use of transcriptional and proteasome inhibitors, we showed that Bcl-2 increases the stability of Sema5A mRNA and protein. Moreover, by ChIP we demonstrated that Sema5A expression is under the control of the transcription factor c-Myb and that c-Myb recruitment on Sema5A promoter is increased after Bcl-2 overexpression. Finally, a concomitant decrease in the expression of Sema5A, Bcl-2 and c-Myb proteins was observed in melanoma cells after miR-204 overexpression.

Conclusion: Overall our data provide evidences supporting the role of Sema5A in melanoma progression and the involvement of Bcl-2, miR-204 and c-Myb in regulating its expression.

Keywords: Bcl-2; Melanoma; Semaphorin 5A; c-Myb; miR-204.


Conflict of interest statement

Ethics approval and consent to participate

Experiments were approved by the Ethics Committee of IFO- IRCCS Regina Elena National Cancer Institute, Rome, Italy.

Consent for publication

All authors have read and approved the final manuscript and consent to publish.

Competing interests

The authors declare that they have no competing interests.

Publisher’s Note

Springer Nature remains neutral with regard to jurisdictional claims in published maps and institutional affiliations.

Figures

Fig. 1
Fig. 1
Evaluation of Sema5A expression in melanoma. a Box and whisker plots showing data from the microarray datasets GDS3964 and GDS1375 downloaded from the Gene Expression Omnibus (GEO, https://www.ncbi.nlm.nih.gov/geoprofiles) website (see Methods for details). Values of Sema5A gene expression levels are reported as counts. Statistical analysis was performed applying Mann-Whitney test. b Western blotting analysis of Sema5A protein expression in melanoma parental cell lines. Reported image is representative of two independent experiments with similar results. β-actin expression was evaluated as control of equivalent transfer and loading. c-g IHC analysis of Sema5A expression in human melanoma specimens. c-e Three representative samples showing different levels of Sema5A selected from metastatic specimens obtained from melanoma patients: c SCORE 1+ (staining that is faint/barely detectable), d SCORE 2+ (staining that is weak/moderate), e SCORE 3+ (staining that is intense/strong). Scale bar 20 μm. f, g Representative images from in situ melanoma specimens showing no immunoreactivity f or focal positivity g for Sema5A expression. Arrow indicates positive cell. Scale bar 30 μm
Fig. 2
Fig. 2
Sema5A affects in vitro melanoma cell invasion, migration and vasculogenic mimicry. a Western blotting analysis of Sema5A expression in M14 cells after 48 h transfection with pooled oligonucleotide mix against Sema5A (si-Sema5A) or scramble target (si-Ctrl) sequences. β-actin was evaluated as control of equivalent transfer and loading. Reported images are representative of three independent experiments with similar results. b In vitro cell migration and c invasion assay performed in M14 cells transfected with si-Ctrl or si-Sema5A. Values are presented as percentage of migrated/invaded cells in si-Sema5A versus control cells. d In vitro cell migration and (e) invasion assay performed in M14 cells transfected with empty vector (Ctrl) or vector expressing the Sema5A protein (ECD-Sema5A). Values are expressed as a percentage of migrated/invaded cells in ECD-Sema5A versus control cells. b-e Data were expressed as average ± standard deviation. *p-values < 0.05. f Western blotting analysis of Sema5A, total and phosphorylated AKT, total and phosphorylated p44/42 protein expression in M14 cells transfected with Ctrl and ECD-Sema5A vectors. Representative images of three independent experiments are reported. β-actin or HSP70/72 expression was evaluated as control of equivalent transfer and loading. g In vitro cell migration performed in M14 cells transfected with Ctrl or ECD-Sema5A, untreated or treated with 10 nM Trametinib. Values are expressed as a percentage of migrated cells in ECD-Sema5A versus control cells. Data are expressed as average ± standard deviation. *p-values < 0.05. h Representative images and i quantification of capillary-like structure formation in M14 melanoma clones overexpressing Sema5A protein (FL-Sema5A/1 and FL-Sema5A/6) and corresponding control clone (empty). Data were expressed as average ± standard deviation. ***p-values < 0.001. Scale bar, 300 μm
Fig. 3
Fig. 3
Bcl-2 modulates Sema5A expression in melanoma models. a Western blot analysis of Sema5A and Bcl-2 expression in M14 and A375SM-SC1 human melanoma control (empty) and Bcl-2 overexpressing (bcl-2) clones. β-actin was evaluated as control of equivalent transfer and loading. Reported images are representative of three independent experiments with similar results. b Analysis of Sema5A mRNA expression evaluated by qRT-PCR in the indicated cell lines. mRNA levels were normalized using β-actin. Values are expressed as means of ratio ± SEM where ratio was calculated considering Bcl-2-overexpressing versus control clones. Experiments were performed at least three times (three technical replicates). *p-values < 0.05. c Sema5A mRNA amount was evaluated by qRT-PCR in control (empty) and Bcl-2 overexpressing (bcl-2) clones after 0, 90, 180, and 360 min of treatment with Actinomycin D (10 μg/ml). The β-actin (ACTB) gene was used as a reference gene, and the ratio of Sema5A and ACTB in each sample was calculated. Data are shown as mean ± SD (n = 2). d Western blot analysis of Sema5A in A375SM-SC1 control (empty) and Bcl-2 overexpressing (bcl-2) clones treated or not with 10 μM MG132 (Sigma-Aldrich) for 6 h and e relative densitometric analysis performed using Image J software. Representative images of two experiments with similar results are reported. β-actin expression was evaluated to confirm equivalent transfer and loading. f Immunohistochemical analysis of Sema5A expression in M14 control (empty) and Bcl-2 overexpressing (bcl-2) xenografts. Representative images of Sema5A expression in empty (SCORE 1+) and bcl-2 overexpressing (SCORE 3+) xenografts are reported. Scale bar, 20 μm
Fig. 4
Fig. 4
c-Myb binding to Sema5A promoter. a Western blot analysis of Bcl-2 and c-Myb expression and b qRT-PCR of c-Myb expression in A375SM-SC1 human melanoma control (empty) and Bcl-2 overexpressing (bcl-2) clones. mRNA levels were normalized using β-actin. Values are expressed as means of ratio ± SEM where ratio was calculated considering Bcl-2-overexpressing versus control clones. c c-Myb and d H3acPAN recruitment on Sema5A and Cyclin B1 (CCNB1) promoters by ChIP analysis. Values of each immunoprecipitated sample are expressed as percentage relative to their respective input and by subtracting the values obtained in the negative controls (no antibody).Values are expressed as ratio ± SEM where ratio was calculated considering Bcl-2-overexpressing versus control clones. *p-values < 0.05. e Western blot analysis of Sema5A and c-Myb expression in A375 and BV173 cells transduced with lentiviral vector for inducible c-Myb silencing. a, e, β-actin or HSP70/72 expression was evaluated to confirm equivalent transfer and loading. b, c, d, Experiments were performed at least three times (three technical replicates). *p-values < 0.05
Fig. 5
Fig. 5
Sema5A is regulated by the miR-204/c-Myb axis. a Quantitative RT-PCR of miR-204 expression in M14 cells 72 h after transfection with mimic miR-204 or Pre-miRNA Precursor-Negative Control. Values are expressed as means of ratio ± SEM where ratio was calculated considering mimic miR-204 transfected cells versus control. b Western blot analysis of Sema5A, Bcl-2 and c-Myb expression after mir-204 transfection in M14 cells. c Quantitative RT-PCR of miR-204 expression in M14 human melanoma control (empty) and Bcl-2 overexpressing (bcl-2) clones. Samples were normalized using RNU19 as endogenous control. Values are expressed as means of ratio ± SEM where ratio was calculated considering Bcl-2-overexpressing versus control clones. *p-values < 0.05. d Western blot analysis of Sema5A, Bcl-2 and c-Myb expression after 48 h of miR-204 transfection in Bcl-2 overexpressing (bcl-2) clones from M14 and A375SM-SC1 cells. b, d, β-actin or HSP70/72 expression was evaluated to confirm equivalent transfer and loading. Representative images of three independent experiments are reported. a, c Experiments were performed at least three times (three technical replicates). *p-values< 0.05
Fig. 6
Fig. 6
Schematic representation of the cellular network involved in the regulation of Sema5A expression. Blue line: evidences previously reported [29, 39]; violet lines: evidences previously reported [25, 42, 43] and confirmed in this work; red lines: evidences demonstrated in this work for the first time

Similar articles

Cited by

References

    1. Worzfeld T, Offermanns S. Semaphorins and plexins as therapeutic targets. Nat Rev Drug Discov. 2014;13(8):603–621. doi: 10.1038/nrd4337. - DOI - PubMed
    1. Neufeld G, Mumblat Y, Smolkin T, Toledano S, Nir-Zvi I, Ziv K, Kessler O. The role of the semaphorins in cancer. Cell Adhes Migr. 2016;10(6):652–674. doi: 10.1080/19336918.2016.1197478. - DOI - PMC - PubMed
    1. Chakraborty G, Kumar S, Mishra R, Patil TV, Kundu GC. Semaphorin 3A suppresses tumor growth and metastasis in mice melanoma model. PLoS One. 2012;7(3):e33633. doi: 10.1371/journal.pone.0033633. - DOI - PMC - PubMed
    1. Roodink I, Kats G, van Kempen L, Grunberg M, Maass C, Verrijp K, Raats J, Leenders W. Semaphorin 3E expression correlates inversely with Plexin D1 during tumor progression. Am J Pathol. 2008;173(6):1873–1881. doi: 10.2353/ajpath.2008.080136. - DOI - PMC - PubMed
    1. Bielenberg DR, Hida Y, Shimizu A, Kaipainen A, Kreuter M, Kim CC, Klagsbrun M. Semaphorin 3F, a chemorepulsant for endothelial cells, induces a poorly vascularized, encapsulated, nonmetastatic tumor phenotype. J Clin Invest. 2004;114(9):1260–1271. doi: 10.1172/JCI21378. - DOI - PMC - PubMed

MeSH terms