. 2018 Nov 19;19(1):200.
doi: 10.1186/s13059-018-1573-3.

N6-methyldeoxyadenosine directs nucleosome positioning in Tetrahymena DNA

Affiliations

N6-methyldeoxyadenosine directs nucleosome positioning in Tetrahymena DNA

Guan-Zheng Luo et al. Genome Biol. .

Abstract

Background: N6-methyldeoxyadenosine (6mA or m6dA) was shown more than 40 years ago in simple eukaryotes. Recent studies revealed the presence of 6mA in more prevalent eukaryotes, even in vertebrates. However, functional characterizations have been limited.

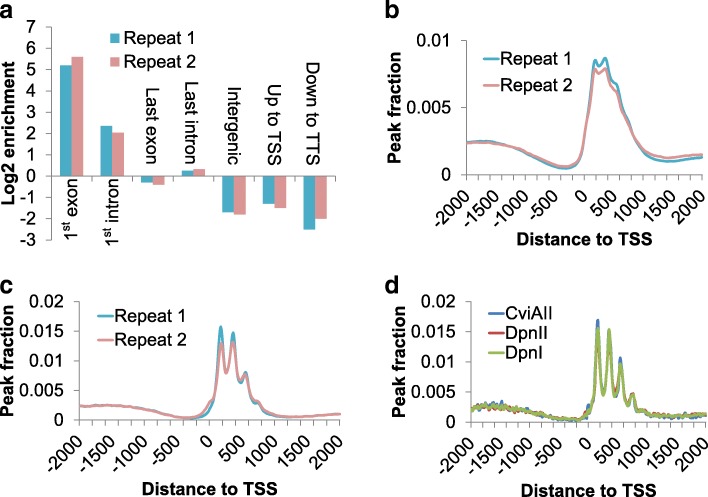
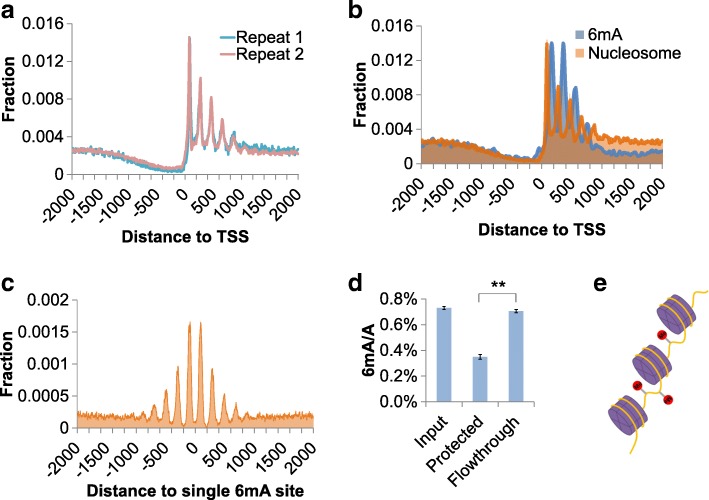
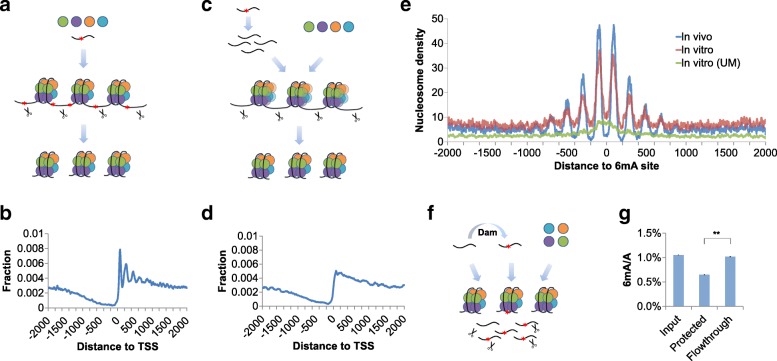
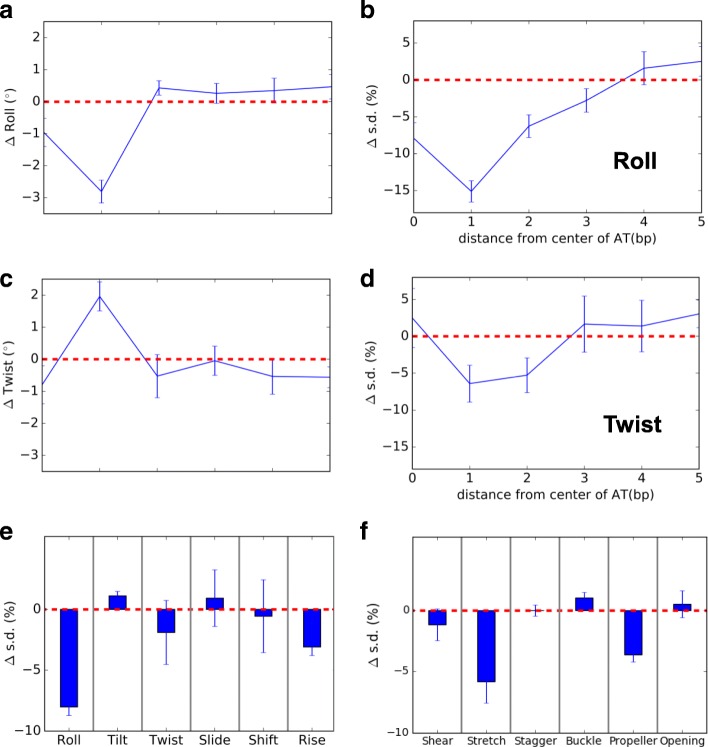
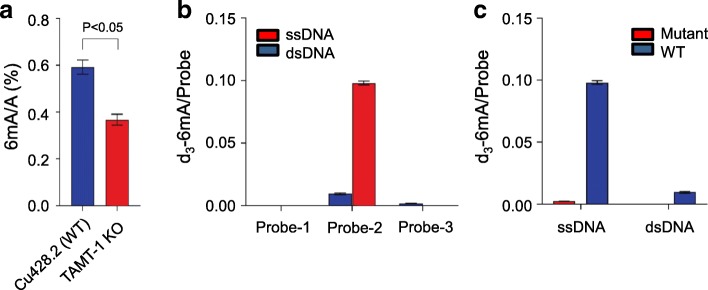
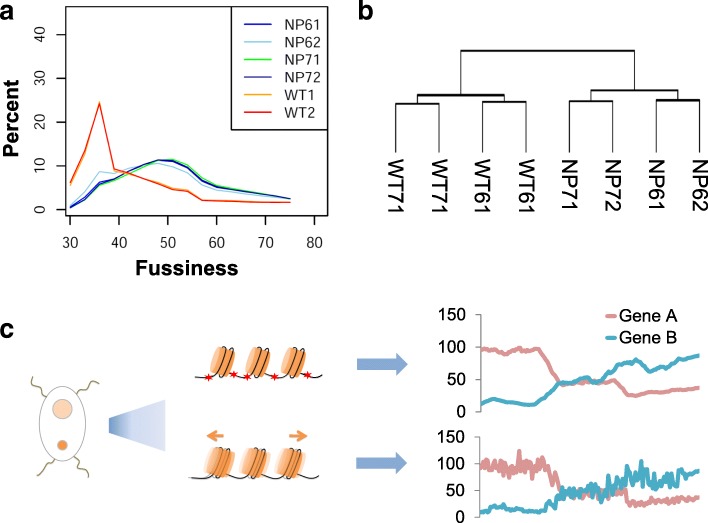
Results: We use Tetrahymena thermophila as a model organism to examine the effects of 6mA on nucleosome positioning. Independent methods reveal the enrichment of 6mA near and after transcription start sites with a periodic pattern and anti-correlation relationship with the positions of nucleosomes. The distribution pattern can be recapitulated by in vitro nucleosome assembly on native Tetrahymena genomic DNA but not on DNA without 6mA. Model DNA containing artificially installed 6mA resists nucleosome assembling compared to unmodified DNA in vitro. Computational simulation indicates that 6mA increases dsDNA rigidity, which disfavors nucleosome wrapping. Knockout of a potential 6mA methyltransferase leads to a transcriptome-wide change of gene expression.

Conclusions: These findings uncover a mechanism by which DNA 6mA assists to shape the nucleosome positioning and potentially affects gene expression.

Keywords: 6mA; DNA methylation; Methyltransferase; N 6-methyldeoxyadenosine; Nucleosome; m6dA.


Conflict of interest statement

Ethics approval and consent to participate

Not applicable.

Consent for publication

Not applicable.

Competing interests

CH is a scientific founder of Accent Therapeutics and a member of the scientific advisory board.

Publisher’s Note

Springer Nature remains neutral with regard to jurisdictional claims in published maps and institutional affiliations.

Figures

Fig. 1
Fig. 1
Identification of 6mA in the genome of Tetrahymena. a Genomic components of genome-wide 6mA distribution. The enrichment score was calculated as the proportion of 6mA peaks dividing the proportion of the attributed genomic component occupying the entire genome. b 6mA profile revealed by 6mA-IP-seq. 6mA peaks were identified by comparing reads from IP to input and aligned to the flanking 2 kbp region of TSS. Two biological replicates were performed. c 6mA profile revealed by 6mA-CLIP-exo. Two biological replicates were performed. Peaks were aligned to TSS and accumulative distribution was depicted similarly to b. d 6mA sites revealed by 6mA-RE-seq at single-base resolution. Parallel experiments were performed on the same sample by using three different methylation-sensitive restriction enzymes (DpnI, DpnII, and CviAII). The accumulative individual 6mA sites were aligned to TSS region and depicted similarly to b
Fig. 2
Fig. 2
Tetrahymena 6mA sites and nucleosome positions are anti-correlated. a Nucleosome positioning around TSS. The centers of nucleosomes are predicted and aligned to the 2 kbp region of each TSS. The counts of nucleosomes in each position are normalized to the total counts in the entire region. Two biological replicates were compared. b Anti-correlation pattern of 6mA and nucleosome at the downstream regions of TSS. c Nucleosome positioning around individual 6mA sites. The nucleosome occupancies around each 6mA site were accumulated and plotted. d Total 6mA levels of nucleosome-protected genomic DNA versus input DNA and unprotected regions. Error bars indicate mean ± s.d. of three technical replicates, each measured in duplicates. **p < 0.01 by Student’s t test. e Illustration of the anti-correlation distribution model. Purple cylinders wrapped with yellow curves represent nucleosomes and DNA. Red circles represent 6mA modifications on DNA
Fig. 3
Fig. 3
6mA directs nucleosome positioning in vitro. a Scheme of in vitro nucleosome assembly on native genomic DNA. Histone H2A, H2B, H3, and H4 are represented as different color balls. DNA is represented as dark curves. The red stars on DNA represent 6mA modification. Scissors represent endonuclease MNase which preferentially digests linker DNA. b The sequencing profile of nucleosomes assembled on native genomic DNA. Nucleosome centers were predicted and aligned to the flanking 2 kbp region of each TSS, and the accumulative occupancy was calculated and plotted around TSS. c Scheme of in vitro nucleosome assembly on unmethylated genomic DNA. Unmethylated DNA was acquired from whole genome amplification (WGA) from 5 ng genomic DNA. d The sequencing profile of nucleosomes assembled on unmethylated genomic DNA from WGA. Nucleosome centers were predicted and aligned to the flanking 2 kbp region of each TSS, and the accumulative occupancy was calculated and plotted around TSS. e Comparison of nucleosome distributions around single 6mA sites from three independent conditions: in vivo, native nucleosome profile; in vitro, nucleosome assembly on genomic DNA; and in vitro (UM), nucleosome assembly on unmethylated DNA. f Scheme of in vitro nucleosome assembly on model DNA. Unmethylated DNA was mixed with Dam-treated DNA at 1:1 ratio. g 6mA level of nucleosome-protected model DNA versus input DNA and unprotected regions. After in vitro nucleosome assembly followed by MNase digestion, UHPLC-QQQ-MS/MS was used to measure the 6mA abundance of input DNA, DNA regions resisting MNase digestion (nucleosome protected), and digested DNA (flowthrough). Error bars indicate mean ± s.d. of three technical replicates, each measured in duplicates. **p < 0.01 by Student’s t test
Fig. 4
Fig. 4
Molecular dynamics simulations of unmodified and 6mA modified DNA. The change after 6mA modification in the mean value of roll (a) and standard deviation (s.d.) (b) as a function of distance from the center of the modification site. The values are averaged over upstream and downstream directions. c, d The same as in a and b but for twist. The average changes after 6mA modification in the s.d. of the inter-base pair (e) and intra-base pair (f) structural parameters. The values are averaged over 3 bp centered at the modification site. The error bars in all panels are ± 1 standard error of the mean
Fig. 5
Fig. 5
TAMT-1 is a methyltransferase for N6-deoxyadenosine methylation in Tetrahymena. a UHPLC-MS/MS quantification of 6mA level in wide-type and TAMT-1 knockout cells. Error bars indicate mean ± s.d. of three biological replicates, each measured in duplicates. b In vitro methyltransferase activity of TAMT-1 was tested using different DNA probes (numbered 1–3) with the consensus sequence of CATG, GATC, and random AT. The methylation yields were calculated by the molar ratio of d3-m6A to digested probes. Error bars indicate mean ± s.d. of three biological replicates, each measured in duplicate. c Mutation of TAMT-1 strongly depleted the methylation activity as detected by UHPLC-MS/MS. Error bars indicate mean ± s.d. of three biological replicates, each measured in duplicate
Fig. 6
Fig. 6
Nucleosome profile and transcriptome change in 6mA defective Tetrahymena. a Fuzziness of genome-wide nucleosome profile in wild-type (WT1, WT2) and methyltransferase knockout (NP61, NP62, NP71, NP72) cells. Fuzziness is defined as the deviation of nucleosome positions within each unit and is calculated by software DANPOS [32]. Two biological replicates for KO cells were constructed. NP61 and NP62 are two technical replicates for one cell strain, and NP71 and NP72 are two technical replicates for another cell strain. The smaller score represents better well-phased nucleosomes. b Clustering analysis of transcriptome for WT (WT61/WT62 and WT71/WT72 are two wild-type strains; each strain contains two technical replicates) and KO (NP61/NP62 and NP71/NP72 are two KO strains; each strain contains two technical replicates) cells. WT and KO cells are distinctly separated with a large difference. c Scheme for the model that 6mA stabilizes gene expression. In WT, 6mA is positioned to constrain nucleosome positioning which regulates gene expression. In KO, the level of 6mA significantly reduced. Nucleosomes lacking of 6mA constraints tend to be fuzzier which leads to larger transcriptional fluctuation

References

    1. Smith ZD, Meissner A. DNA methylation: roles in mammalian development. Nat Rev Genet. 2013;14(3):204–220. doi: 10.1038/nrg3354. - DOI - PubMed
    1. Gorovsky MA, Hattman S, Pleger GL. (6N)methyl adenine in the nuclear DNA of a eucaryote, Tetrahymena pyriformis. J Cell Biol. 1973;56(3):697–701. doi: 10.1083/jcb.56.3.697. - DOI - PMC - PubMed
    1. Hattman S, et al. Comparative study of DNA methylation in three unicellular eucaryotes. J Bacteriol. 1978;135(3):1156–1157. - PMC - PubMed
    1. Wion D, Casadesus J. N6-methyl-adenine: an epigenetic signal for DNA-protein interactions. Nat Rev Microbiol. 2006;4(3):183–192. doi: 10.1038/nrmicro1350. - DOI - PMC - PubMed
    1. Luo GZ, et al. DNA N(6)-methyladenine: a new epigenetic mark in eukaryotes? Nat Rev Mol Cell Biol. 2015;16(12):705–710. doi: 10.1038/nrm4076. - DOI - PMC - PubMed

Publication types

MeSH terms