. 2018 Nov 15;175(5):1289-1306.e20.
doi: 10.1016/j.cell.2018.09.053. Epub 2018 Oct 25.

Obesity Drives STAT-1-Dependent NASH and STAT-3-Dependent HCC

Affiliations

Obesity Drives STAT-1-Dependent NASH and STAT-3-Dependent HCC

Marcus Grohmann et al. Cell. .

Abstract

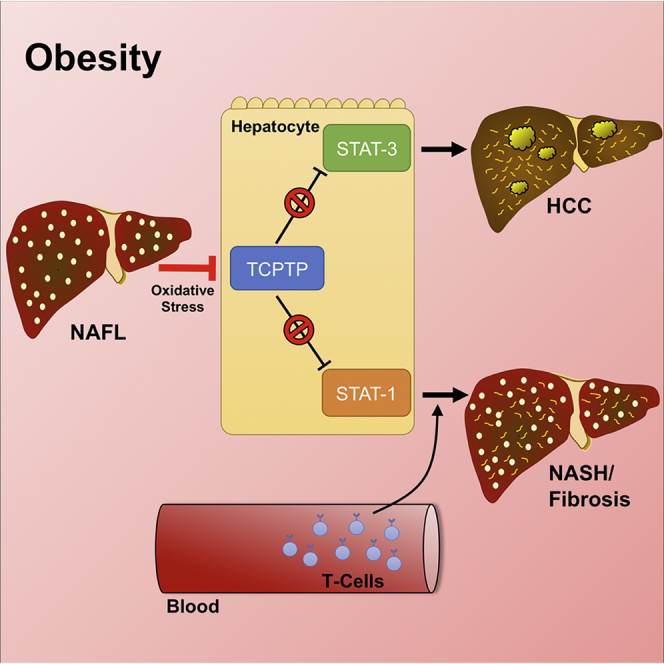
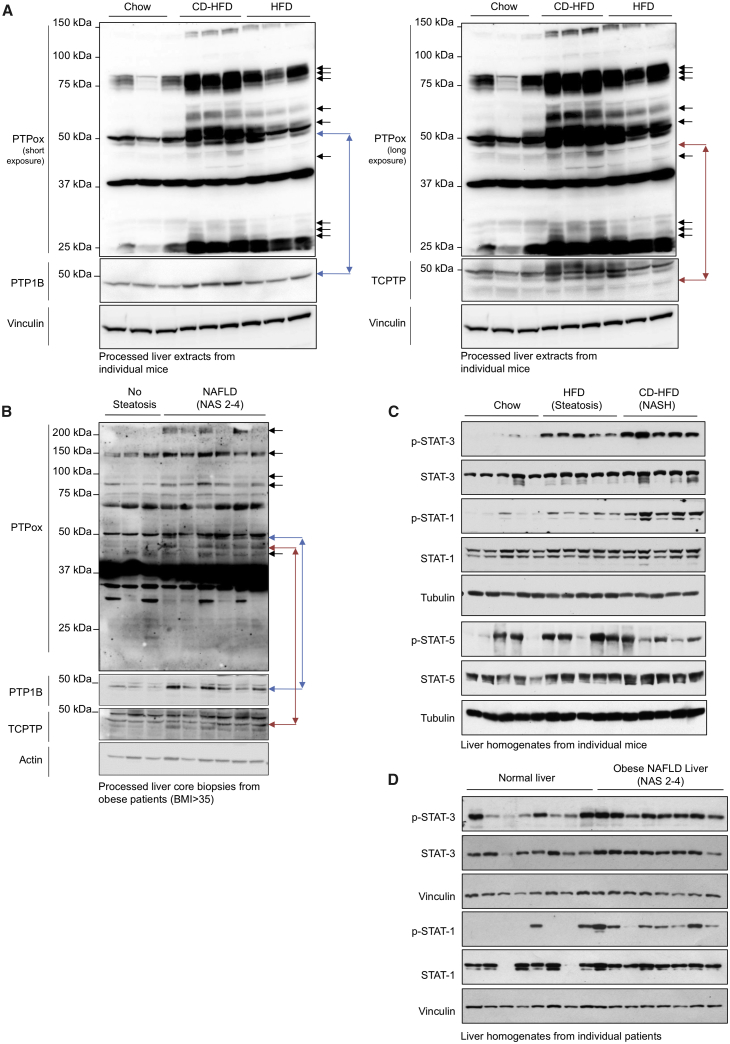
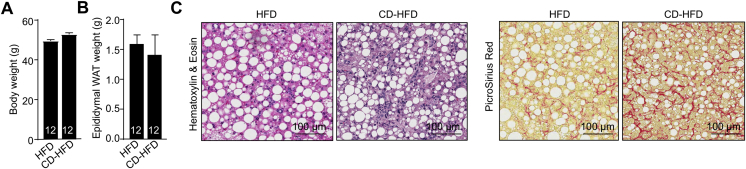
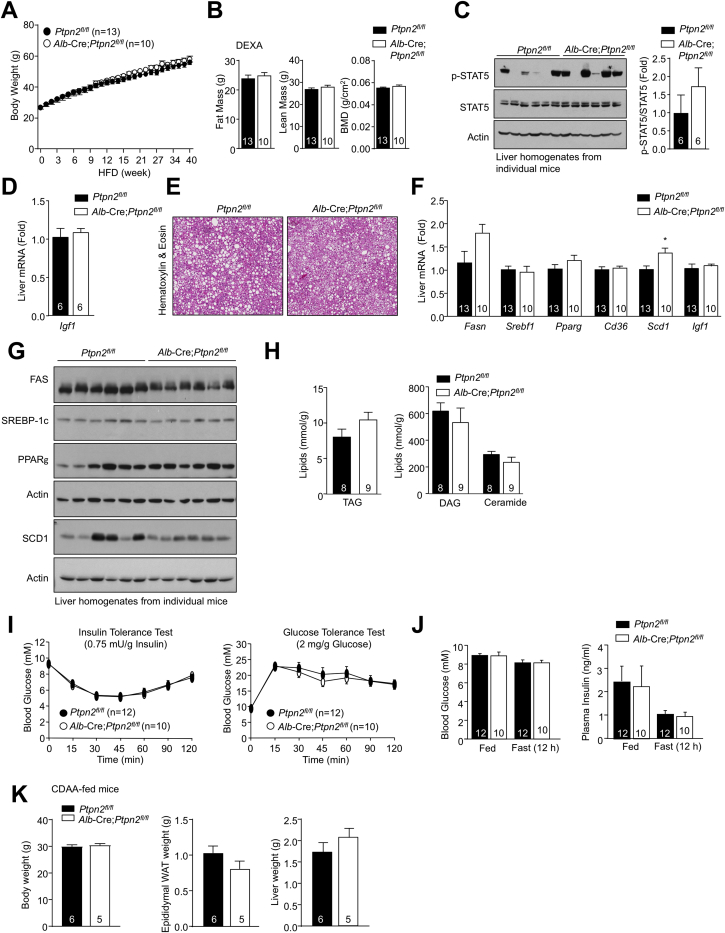
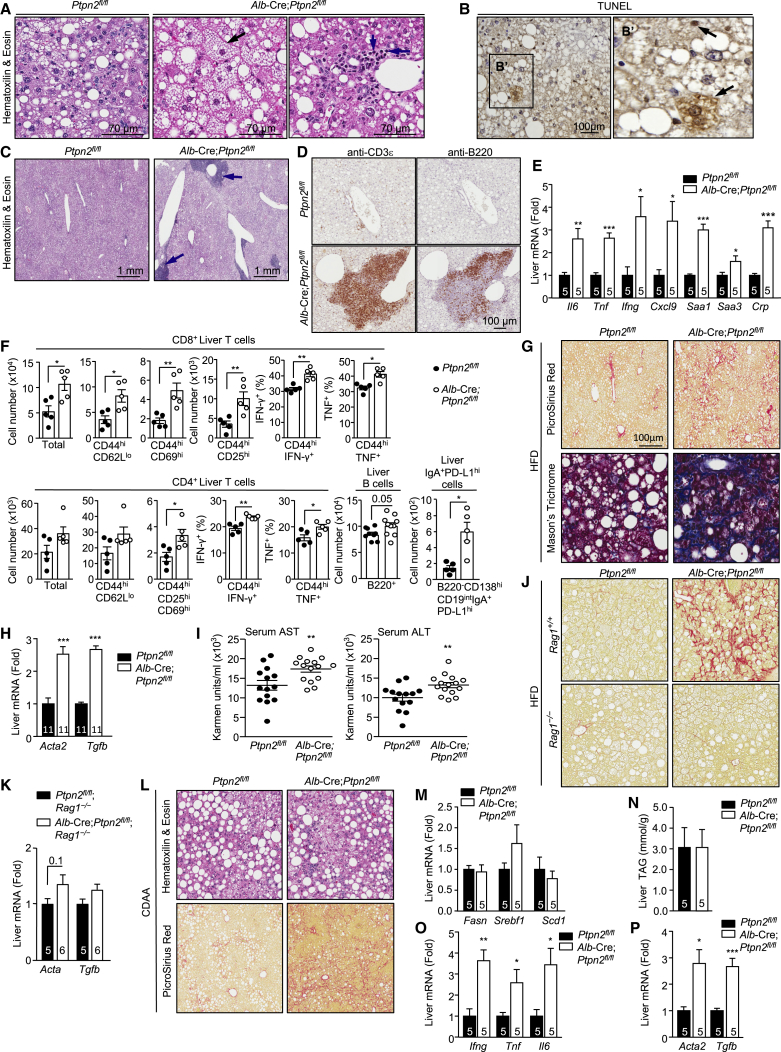
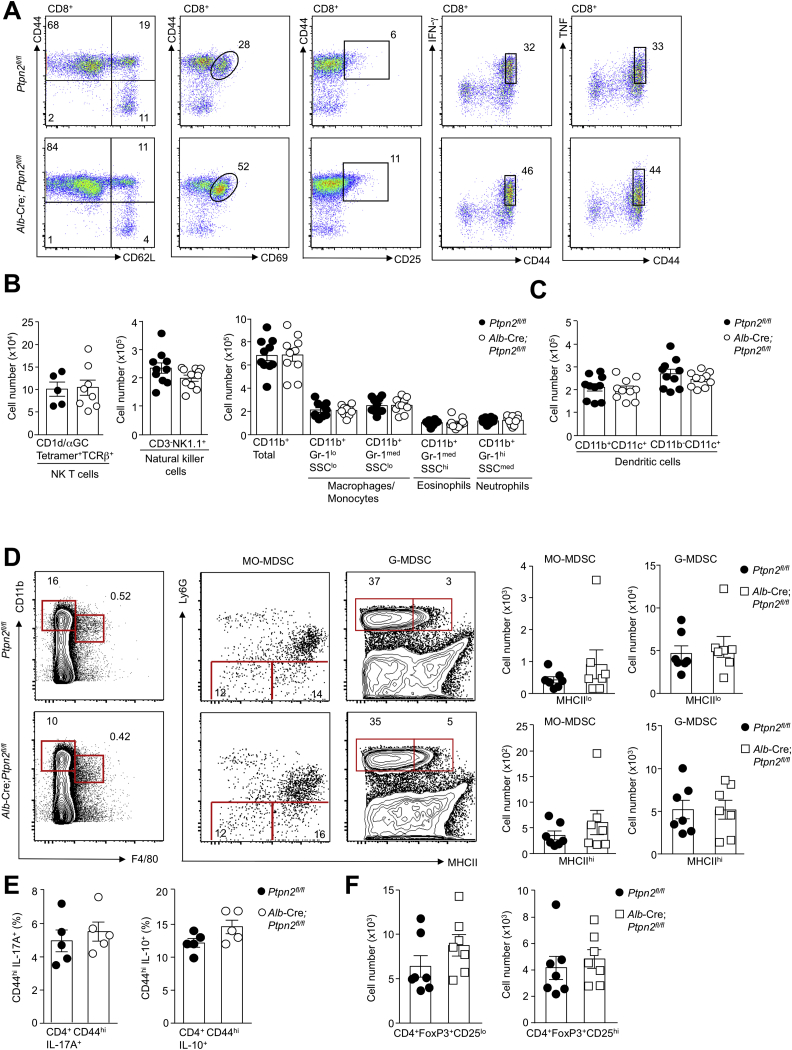
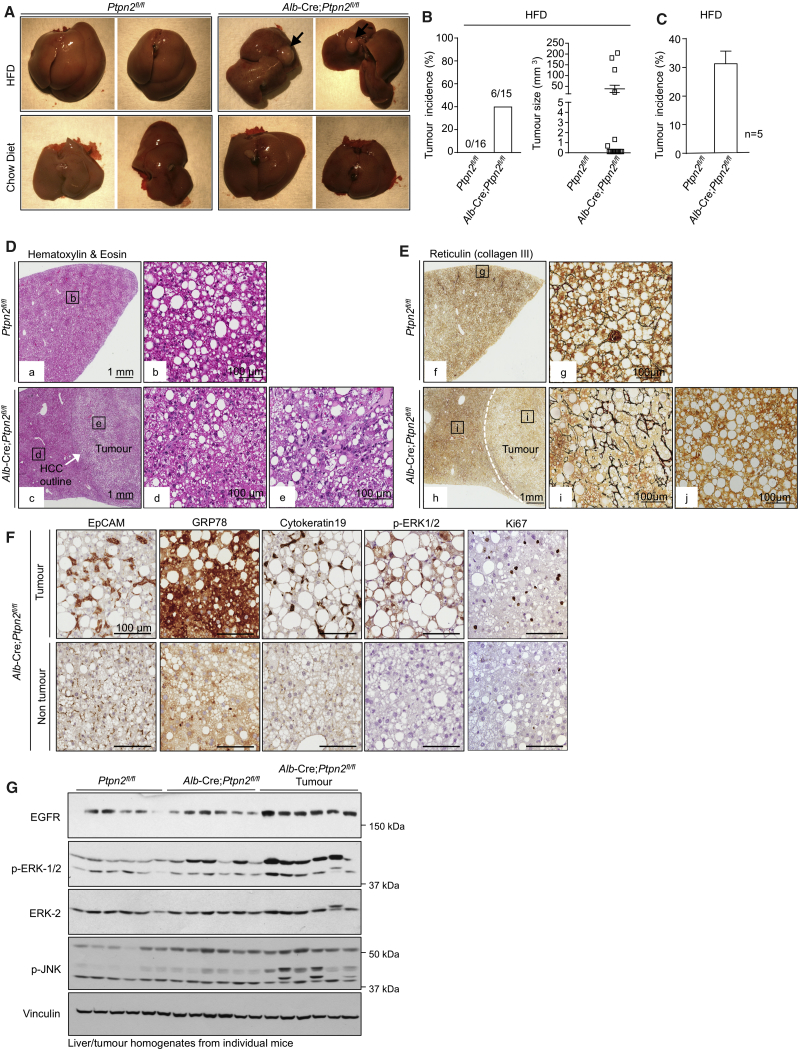
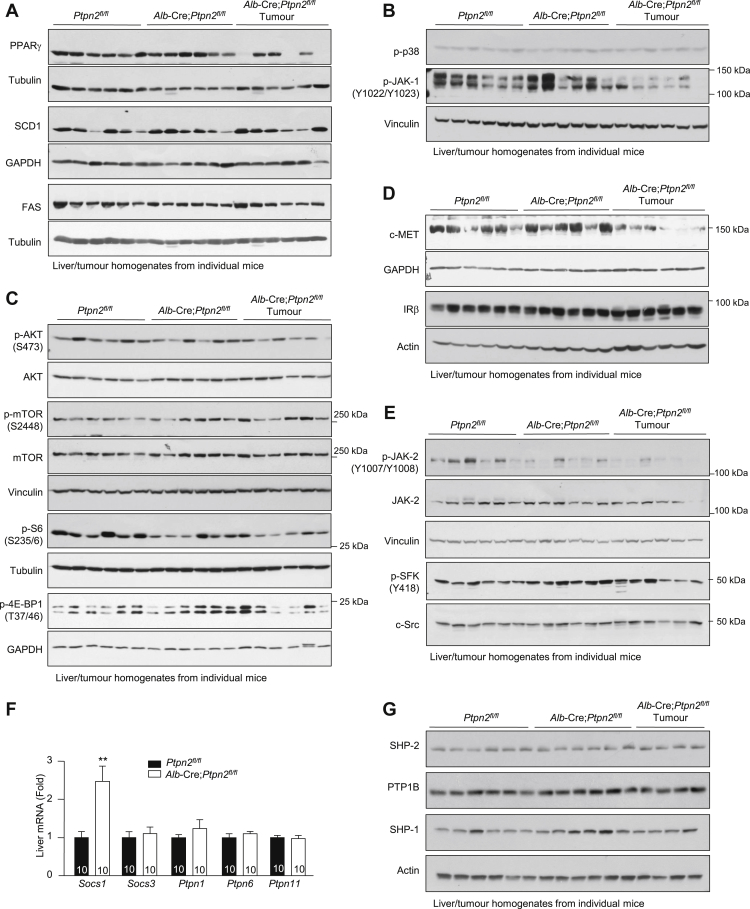
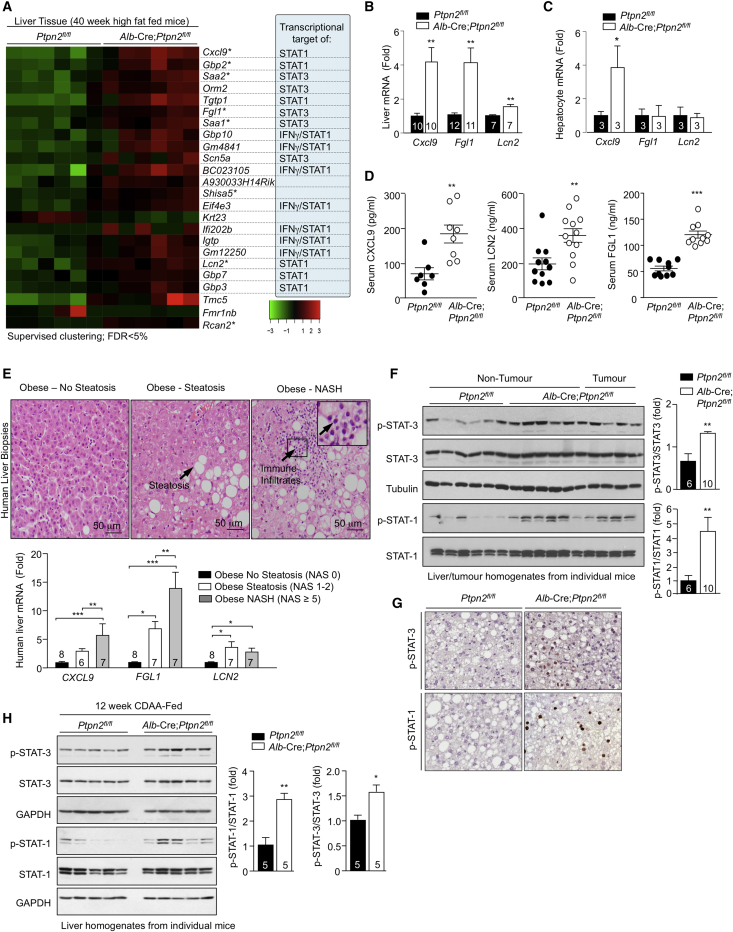
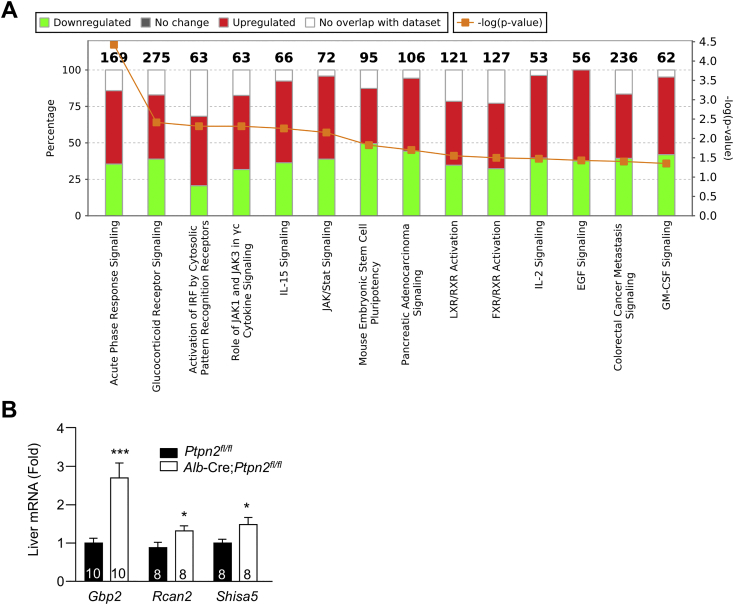
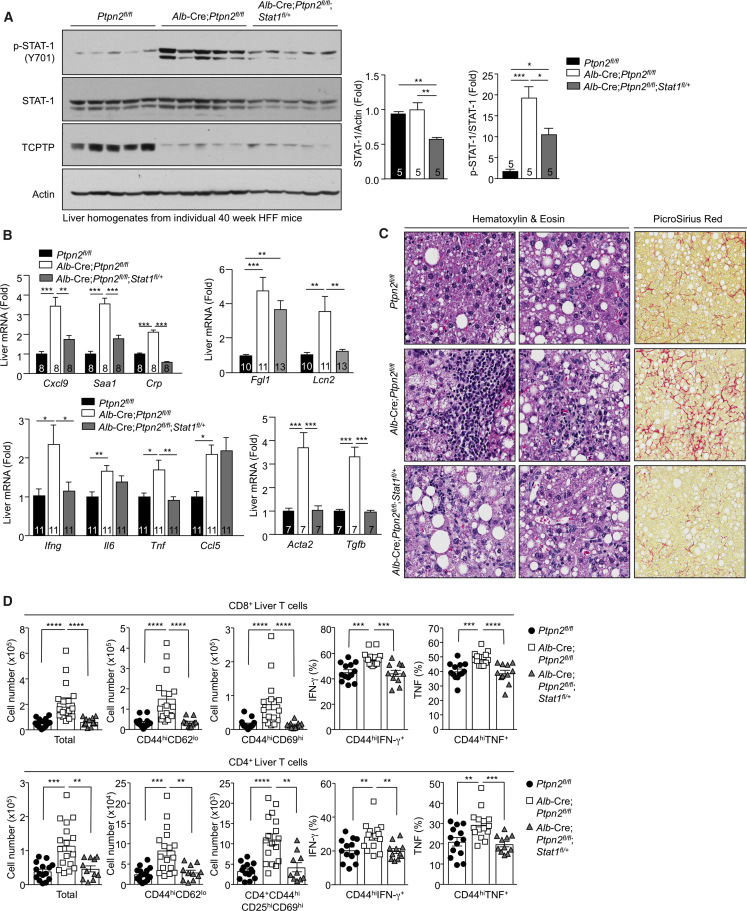
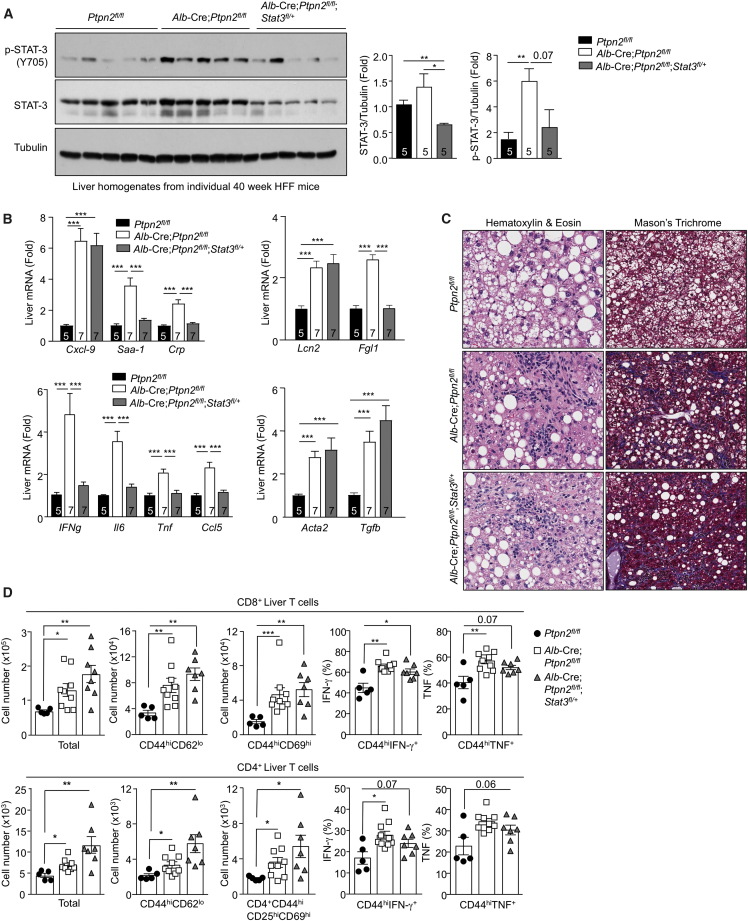
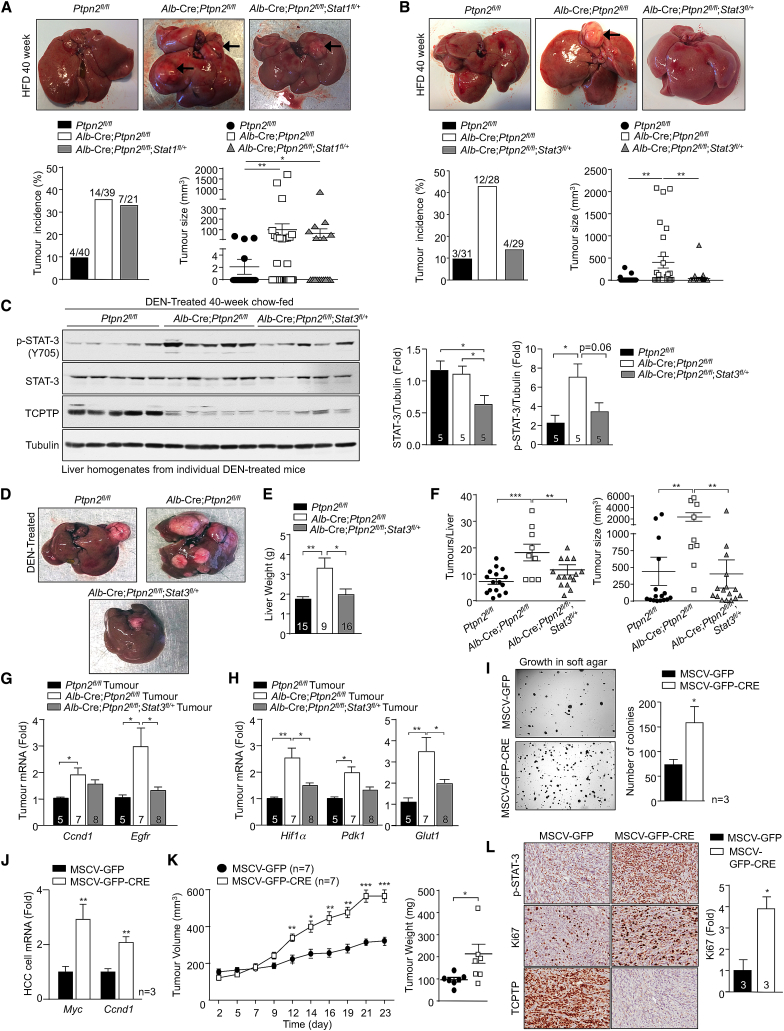
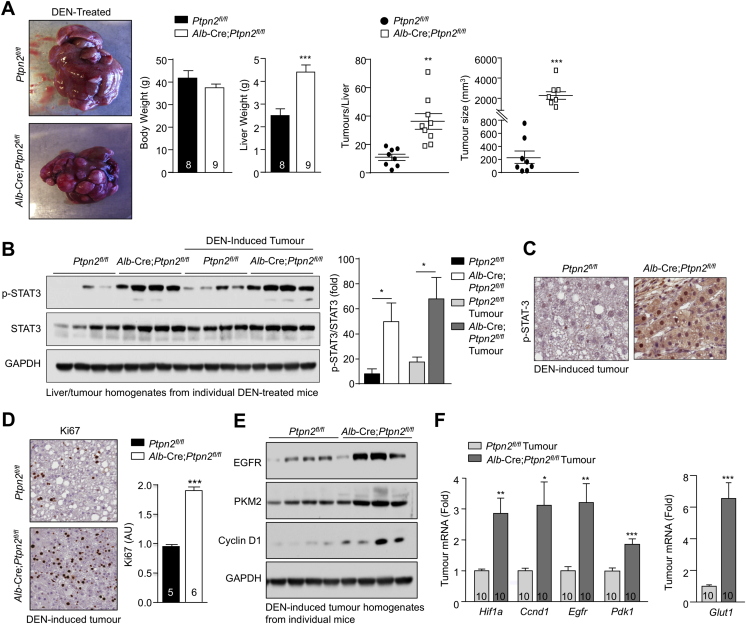
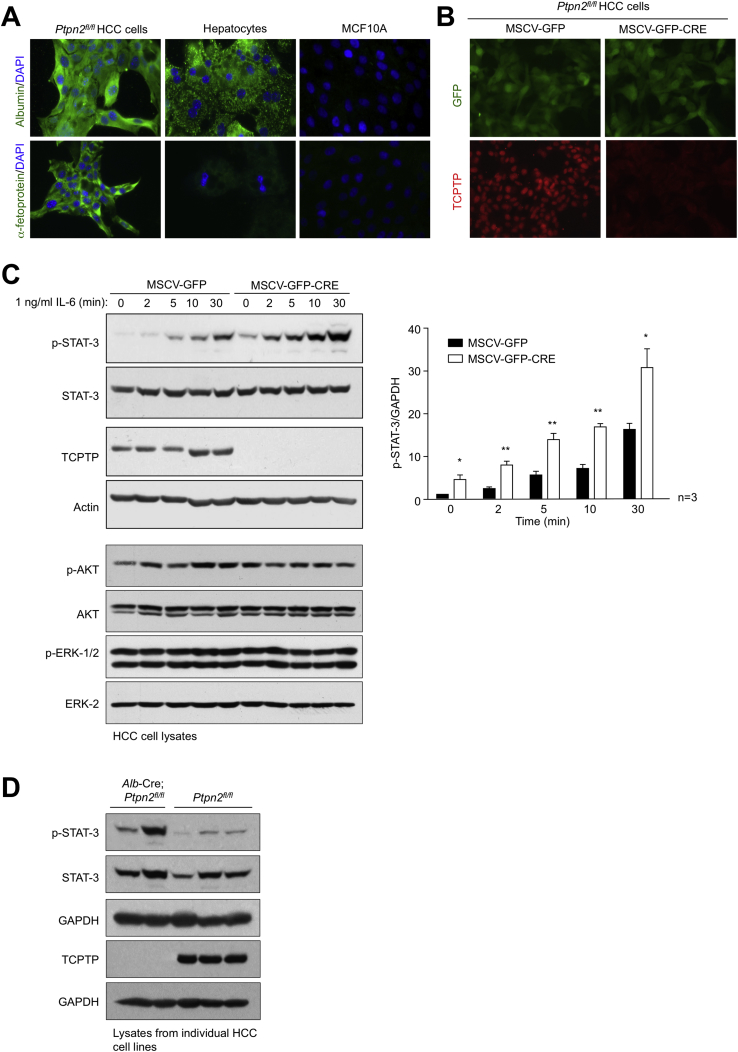
Obesity is a major driver of cancer, especially hepatocellular carcinoma (HCC). The prevailing view is that non-alcoholic steatohepatitis (NASH) and fibrosis or cirrhosis are required for HCC in obesity. Here, we report that NASH and fibrosis and HCC in obesity can be dissociated. We show that the oxidative hepatic environment in obesity inactivates the STAT-1 and STAT-3 phosphatase T cell protein tyrosine phosphatase (TCPTP) and increases STAT-1 and STAT-3 signaling. TCPTP deletion in hepatocytes promoted T cell recruitment and ensuing NASH and fibrosis as well as HCC in obese C57BL/6 mice that normally do not develop NASH and fibrosis or HCC. Attenuating the enhanced STAT-1 signaling prevented T cell recruitment and NASH and fibrosis but did not prevent HCC. By contrast, correcting STAT-3 signaling prevented HCC without affecting NASH and fibrosis. TCPTP-deletion in hepatocytes also markedly accelerated HCC in mice treated with a chemical carcinogen that promotes HCC without NASH and fibrosis. Our studies reveal how obesity-associated hepatic oxidative stress can independently contribute to the pathogenesis of NASH, fibrosis, and HCC.

Keywords: PTPN2; STAT-1; STAT-3; T cells; fibrosis; hepatocellular carcinoma; non-alcoholic steatohepatitis; nonalcoholic fatty liver disease; obesity; oxidative stress; protein tyrosine phosphatase.


Figures

None
Graphical abstract
Figure 1
Figure 1
Increased Hepatic PTP Oxidation and Elevated STAT Signaling in NAFL and/or NASH (A) 8-week-old male C57BL/6 mice were fed a chow diet, an HFD, or a CD-HFD for 20 weeks. Livers from individual mice were processed for immunoblot analysis for total PTP oxidation. (B) Liver core biopsies from individual obese humans with no steatosis (NAS = 0) or with NAFLD (NAS 2–4) were processed for immunoblot analysis for total PTP oxidation. (C) Murine liver extracts immunoblotted for STAT-1 Y701 (p-STAT-1), STAT-3 Y705 (p-STAT-3), or STAT-5 Y694 (p-STAT-5) phosphorylation. (D) Human livers biopsies processed for immunoblotting. Results are representative of at least three independent experiments. See also Figure S1.
Figure S1
Figure S1
Mice Fed a CD-HFD Do Not Become More Obese Than Mice Fed an HFD but Develop NASH, Related to Figure 1 (A–C) Ten-week-old C57BL/6 male mice were fed a HFD or a CD-HFD for 20 weeks and (A) body weights and (B) epididymal white adipose tissue (WAT) weights were assessed. (C) Livers were extracted and processed for histology monitoring for steatosis and lymphocytic infiltrates (Hematoxylin and Eosin) and fibrosis (Picrosirius red).
Figure S2
Figure S2
Unaltered Steatosis and Glucose Metabolism In High-Fat-Fed Alb-Cre;Ptpn2fl/fl Mice, Related to Figure 2 (A–D) Ten-twelve-week-old male liver-specific TCPTP-deficient mice (Alb-Cre;Ptpn2fl/fl) and Ptpn2fl/fl littermate controls were fed a HFD for up to 40 weeks. (A) Incremental body weights and (B) body composition at 40 weeks high fat feeding, as assessed by Dual-energy X-ray absorptiometry (DEXA). Livers were extracted from mice fed a HFD for 20 weeks and processed for (C) immunoblot analysis and (D) quantitative (ΔΔCt) real-time PCR to monitor for p-STAT-5 and Igf1 expression respectively. (E–G) Livers extracted from mice fed a HFD for 40 weeks and processed for (E) histology (Hematoxylin and Eosin), (F) real-time PCR to monitor for fatty acid synthase (FAS; encoded by Fasn), sterol regulatory element-binding protein (SREBP-1c; encoded by Srebf1), stearoyl-CoA desaturase 1 (SCD-1; encoded by Scd1), fatty acid transporter CD36 (Cd36) or peroxisome proliferator-activated receptor γ (PPARγ; encoded by Pparg) and (G) immunoblotting to monitor for steatosis and the expression lipid synthesis genes. (H–K) Ten-week-old male liver-specific TCPTP-deficient mice (Alb-Cre;Ptpn2fl/fl) and Ptpn2fl/fl littermate controls were fed a HFD for 20 weeks. (H) Livers were extracted and processed for analysis of triacylglyceride (TAG), diacylglyceride (DAG) and ceramide content. (I) Mice were fasted for 4-6 h and subjected to insulin (0.75 mU/g) and glucose (2 mg/g) tolerance tests. (J) Fed and fasted (12 h) blood glucose and plasma insulin levels were measured. (K) Ten-twelve week-old male Alb-Cre;Ptpn2fl/fl and Ptpn2fl/fl littermate controls were fed a CDAA diet for 12 weeks and body weights and epididymal white adipose tissue (WAT) and liver weights determined. Representative and quantified results (means ± SEM) are shown for the indicated number of mice with significance determined using a Student’s t test.
Figure 2
Figure 2
Hepatic TCPTP Deficiency Promotes NASH (A–I) 10- to 12-week-old male Alb-Cre;Ptpn2fl/fl and Ptpn2fl/fl mice were fed an HFD for 40 weeks. Livers were processed for histology monitoring for (A) ballooning hepatocytes (black arrow) and lymphocytic infiltrates or (C) ectopic lymphoid-like structures (blue arrows). Alternatively, livers were processed for immunohistochemistry monitoring for (B) apoptotic and/or necrotic hepatocytes by TUNEL staining, or (D) for the presence of CD3ε+ T cells or B220+ B cells. (E) Inflammatory cytokine, chemokine, and acute phase reactant genes assessed by real-time qPCR. (F) Liver CD4+ and CD8+ T cells, including activated (CD69hi, CD25hi, IFNγ+, TNF+) effector memory (CD44hiCD62Llo) T cells, B cells, and immunosuppressive IgA+PD1hi cells assessed by flow cytometry. Liver fibrosis and liver damage assessed by (G) histology, (H) the expression of fibrotic genes, and (I) the presence of hepatic AST and ALT in serum. (J and K) Alb-Cre;Ptpn2fl/fl;Rag1–/– and Ptpn2fl/fl;Rag1–/– littermate controls were fed an HFD for 40 weeks. Livers were analyzed for (J) fibrosis or (K) Acta2 and Tgfb1 expression. (L–P) Alb-Cre;Ptpn2fl/fl and Ptpn2fl/fl mice were fed a CDAA diet for 12 weeks. Livers were processed for (L) histology, to monitor for steatosis, immune infiltrates, and fibrosis, or for (M, O, and P) real-time PCR to monitor for the expression of (M) lipid synthesis, (O) inflammatory, and (P) fibrotic genes, or (N) analyzed for TAG content. Representative and quantified results (means ± SEM) results are shown for the indicated number of mice. See also Figures S2 and S3.
Figure S3
Figure S3
Unaltered Myeloid Cell and CD4+ IL-10-Expressing Immunosuppressive and Regulatory T Cell Recruitment in High-Fat-Fed Alb-Cre;Ptpn2fl/fl Mice, Related to Figure 2 (A) Gating strategy for liver T cells. Lymphocytes isolated from the livers of Ptpn2fl/fl and Alb-Cre;Ptpn2fl/fl mice fed a HFD for 40 weeks were stained with fluorochrome-conjugated antibodies for CD8, CD44, CD62L, CD69, CD25, intracellular IFN-γ and intracellular TNF and analyzed by flow cytometry. CD8+ T cells were gated for CD62LloCD44hi effector-memory T cells, recently activated CD69hiCD44hi memory T Cells, CD25hiCD44hi memory T cells and cytotoxic CD44hiIFN-γ+ or CD44hiTNF+ T cells. (B) Lymphocytes isolated from the livers Ptpn2fl/fl and Alb-Cre;Ptpn2fl/fl mice fed an HFD for 40 weeks were stained with α-galactosylceramide-loaded CD1d tetramers (CD1d/αGC) and α-TCRβ or NK1.1 and α-CD3 or α-CD11b and α-Gr-1 and NKT cells (CD1d/αGC)+/α-TCRβ+), NK cells (NK1.1+CD3-), CD11b+ myeloid lineage subsets including macrophages/monocytes (CD11b+Gr-1loSSClo/CD11b+Gr-1medSSClo), eosinphils (CD11b+Gr-1medSSChi) and neutrophils (CD11b+Gr-1hiSSCmed) were quantified by flow cytometry. (C) Lymphocytes isolated from the livers of Ptpn2fl/fl and Alb-Cre;Ptpn2fl/fl mice fed a HFD for 40 weeks were stained with fluorochrome-conjugated antibodies for CD11b and CD11c and CD11c+ dendritic cell subsets determined by flow cytometry. (D) Lymphocytes isolated from the livers of Ptpn2fl/fl and Alb-Cre;Ptpn2fl/fl mice fed a HFD for 40 weeks were stained with fluorochrome-conjugated antibodies for CD11b, F4/80, Ly6G and MHC-II and MCH-IIlo and MCH-IIhi monocytic myeloid-derived suppressor (MO-MDSC; CD11bhi/F4/80hiLy6Glo) and granulocytic myeloid-derived suppressor (G-MDSC; CD11bhi/F4/80Ly6Ghi) were quantified by flow cytometry. (E) Lymphocytes isolated from the livers of Ptpn2fl/fl and Alb-Cre;Ptpn2fl/fl mice fed a HFD for 40 weeks were stained with fluorochrome-conjugated antibodies for CD4, CD44 and intracellular IL-17A or IL-10 and the relative proportion of T helper 17 (Th17) cells CD4+CD44hiIL-17A+ and immunosuppresive IL-10 expressing CD4+ T cells (CD4+CD44hiIL-10+) CD4+CD44hiIL-10+ T cells was determined by flow cytometry. (F) Lymphocytes isolated from the livers of Ptpn2fl/fl and Alb-Cre;Ptpn2fl/fl mice fed a HFD for 40 weeks were stained with fluorochrome-conjugated antibodies for CD4, CD25, and intracellular FoxP3 and CD4+CD25+FoxP3+ or CD4+CD25FoxP3+ regulatory T cells were quantified by flow cytometry. Representative results (means ± SEM) and (A) representative cytometry profiles from at least two independent experiments are shown.
Figure 3
Figure 3
Hepatic TCPTP Deficiency Promotes HCC (A–C) Mice were fed an HFD or a chow diet for 40 weeks. Livers were extracted and analyzed for (A) nodular tumors (black arrows). (B) Tumor incidence and sizes. (C) Tumor incidence in 5 independent cohorts. (D–G) Livers and tumors analyzed by (D and E) histology, (F) immunohistochemistry, or (G) immunoblotting. Representative and quantified results (means ± SEM) results are shown for the indicated number of mice (B) or cohorts (C). See also Figure S4.
Figure S4
Figure S4
The Development of NASH and HCC in High-Fat-Fed Alb-Cre;Ptpn2fl/fl Mice Is Not Accompanied by Increased PTK and PI3K/AKT/mTOR Signaling, Related to Figure 3 (A–G) Ten-twelve week-old male Alb-Cre;Ptpn2fl/fl and Ptpn2fl/fl littermate controls were fed a HFD for 40 weeks and liver tissue and tumors extracted from individual mice for (A)–(E), (G) immunoblot analysis with the indicated antibodies [including those for c-MET, IR β subunit (IRβ), Ser-473 phosphorylated AKT (p-AKT), Thr-180/Tyr-182 phosphorylated p38 (p-p38), Ser-2448 phosphorylated mammalian target of rapamycin (p-mTOR), Thr-37/46 phosphorylated eukaryotic translation initiation factor 4E-binding protein 1 (p-4E-BP1), Ser-235/6 phosphorylated ribosomal protein S6 (p-S6), Tyr-1022/Tyr-1023 phosphorylated JAK-1 (p-JAK-1), Tyr-1007/Tyr-1008 phosphorylated JAK-2 (p-JAK-2), Tyr-418 phosphorylated SFKs (p-SFK)], or (F) real time PCR. Representative and quantified results (means ± SEM) are shown for the indicated number of mice with significance determined using a Student’s t test.
Figure 4
Figure 4
A STAT-1 and STAT-3 Molecular Phenotype in Obesity-Associated NASH/HCC (A–D) Mice were fed an HFD for 40 weeks. (A) Liver tissue was processed for RNA-seq and a heatmap representing the normalized gene expression values (log2 fold-change from mean) generated. Genes differentially expressed between genotypes, ordered by smallest to largest p value (top to bottom). Genes tested by real-time PCR in independent samples are indicated with an asterisk. Known and putative STAT-1 and STAT-3 transcriptional targets are highlighted. (B) Liver gene expression in an independent cohort assessed by real-time PCR. (C) Gene expression in hepatocytes isolated from chow-fed mice. (D) Serum levels of CXCL9, LCN2, and FGL-1. (E) Human liver core biopsies from obese male or female patients (BMI 40–74 kg/m2) were processed for histology and those with non-steatotic livers (NAS 0), simple steatosis, and no fibrosis (NAS 1–2) or overt NASH with fibrosis (NAS ≥ 5) were identified. Representative histology micrographs. Biopsies were processed for real-time PCR. (F and G) Mice were fed an HFD for 40 weeks. Liver and tumor tissues were extracted for (F) immunoblotting or (G) immunohistochemistry. (H) Mice were fed a CDAA diet for 12 wks. Livers were extracted and processed for immunoblotting. Representative and quantified results (means ± SEM) results are shown for the indicated number of mice or human liver biopsies. See also Figure S5 and Table S1.
Figure S5
Figure S5
RNA-Seq Defines a STAT-1 and STAT-3 Molecular Phenotype in High-Fat-Fed Alb-Cre;Ptpn2fl/fl Mice, Related to Figure 4 (A) Ten-twelve week-old male Alb-Cre;Ptpn2fl/fl and Ptpn2fl/fl littermate controls were fed a HFD for 40 weeks. Liver tissues from six Ptpn2fl/fl and six Alb-Cre;Ptpn2fl/fl mice were processed for transcriptome analysis by RNaseq. Stacked bar-chart depicting the overlap between the top 119 differentially expressed hepatic genes in Alb-Cre;Ptpn2fl/fl mice by RNA-seq (log fold-change > 0.2 and p value < 0.01) and annotated Canonical Pathways in the Ingenuity Knowledge Base. Numbers (top) indicate the total number of genes included in the pathway. Red, green and clear bars indicate overlap with upregulated genes, overlap with downregulated genes, and genes not in the regulated set, respectively (left-hand axis). p values for the extent of overlap of gene sets (orange line; scaled to negative log10, see right-hand axis) were calculated using a right-tailed Fisher’s exact test. (B) An independent cohort of ten week-old male Ptpn2fl/fl and Alb-Cre;Ptpn2fl/fl mice were fed a HFD for 40 weeks and liver tissues processed for quantitative real time PCR. Quantified results (means ± SEM) are shown for the indicated number of mice with significance determined using a Student’s t test.
Figure 5
Figure 5
STAT-1 Is Required for Inflammation, T Cell Recruitment, and Fibrosis (A–C) Ptpn2fl/fl, Alb-Cre;Ptpn2fl/fl, and Alb-Cre;Ptpn2fl/fl;Stat-1fl/+ mice were fed an HFD for 40 weeks. Liver tissue was processed for (A) immunoblotting, (B) real-time PCR, and (C) histology monitoring for immune cell infiltrates and fibrosis (Picro Sirius Red). (D) The recruitment of liver T cells, including activated effector-memory T cells, was assessed by flow cytometry. Representative and quantified results (means ± SEM) results are shown for the indicated number of mice.
Figure 6
Figure 6
STAT-3 Is Required for Inflammation, but Not for T Cell Recruitment or Fibrosis (A–C) Ptpn2fl/fl, Alb-Cre;Ptpn2fl/fl, and Alb-Cre;Ptpn2fl/fl;Stat-3fl/+ mice were fed an HFD for 40 weeks. Liver tissue was processed for (A) immunoblotting, (B) real-time PCR, and (C) histology monitoring for immune cell infiltrates and fibrosis (Mason’s Trichrome stain). (D) The recruitment of liver T cells, including activated effector-memory T cells, was assessed by flow cytometry. Representative and quantified results (means ± SEM) are shown for the indicated number of mice.
Figure 7
Figure 7
Tumor Development Occurs Independently of NASH (A and B) Ptpn2fl/fl, Alb-Cre;Ptpn2fl/fl, and either (A) Alb-Cre;Ptpn2fl/fl;Stat-1fl/+ or (B) Alb-Cre;Ptpn2fl/fl;Stat-3fl/+ mice were fed an HFD for 40 weeks. Livers were analyzed for nodular tumors and tumor incidence and sizes recorded. (C–F) DEN-treated mice were fed a chow diet and processed at 40 weeks of age. (C) Liver tissue extracted for immunoblotting. (D–F) Livers were analyzed for nodular tumors (D) and livers weighed (E) and tumor incidence and sizes (F) determined. (G and H) Tumor tissue was processed for real-time PCR to monitor proliferation (G) and glycolytic metabolism genes (H). (I–L) HCC cells were isolated and transduced with GFP or GFP and Cre-encoding retroviruses to generate isogenic cell lines with and without TCPTP. (I) Soft-agar growth. (J) Gene expression. (K and L) Tumor cells were xenografted into the flanks of BALB/c nu/nu mice. (K) Tumor volumes and weights and (L) immunohistochemistry. Representative and quantified results (means ± SEM) are shown for the indicated number of mice or experimental repeats. See also Figures S6 and S7.
Figure S6
Figure S6
TCPTP Deletion in Hepatocytes Promotes DEN-Induced HCC, Related to Figure 7 14 day-old male Ptpn2fl/fl and Alb-Cre;Ptpn2fl/fl neonates were injected with DEN (25 mg/kg) and weaned mice fed a standard chow diet. (A) At 40 weeks of age body weights were recorded and livers extracted, weighed and analyzed for nodular tumors. Tumor incidence and sizes are shown for the indicated number of mice. (B) Liver and tumor homogenates were processed for immunoblotting monitoring for STAT-3 signaling. (C and D) Tumors were processed for immunohistochemistry monitoring for p-STAT-3 and Ki67. (E and F) Tumor homogenates were processed for immunoblotting and real time PCR monitoring for the expression of cellular proliferation and glycolytic metabolism genes. Representative and quantified results (means ± SEM) are shown for the indicated number of mice with significance determined using a Student’s t test or a one-way ANOVA.
Figure S7
Figure S7
TCPTP Deletion in HCC Cells Promotes STAT3 Signaling, Related to Figure 7 (A–C) Tumors from DEN-treated Ptpn2fl/fl mice were dissociated and HCC cell lines established. (A) Ptpn2fl/fl HCC cells, primary hepatocytes from chow-fed C57BL/6 mice and MCF10A immortalized mammary epithelial cells were processed for immunofluorescence microscopy monitoring for the presence of the hepatocyte marker albumin, or the liver cancer marker α-fetoprotein. Ptpn2fl/fl HCC cells were transduced with retroviruses encoding GFP alone (MSCV-GFP) or GFP and Cre recombinase (MSCV-GFP-CRE) and sorted twice for GFP and either processed for (B) immunofluorescence microscopy monitoring for GFP and TCPTP, or (C) serum starved and stimulated with IL-6 (1 ng/ml) and then processed for immunoblotting monitoring for STAT-3 signaling. Quantified results (means ± SEM) are shown for the indicated number of experiments with significance determined using a Student’s t test. (D) Tumors from DEN-treated Ptpn2fl/fl or Alb-Cre;Ptpn2fl/fl were dissociated and HCC cell lines established. HCC cells were serum starved and processed for immunoblotting.

Comment in

References

    1. Alexander J., Torbenson M., Wu T.T., Yeh M.M. Non-alcoholic fatty liver disease contributes to hepatocarcinogenesis in non-cirrhotic liver: a clinical and pathological study. J. Gastroenterol. Hepatol. 2013;28:848–854. - PubMed
    1. Alonzi T., Maritano D., Gorgoni B., Rizzuto G., Libert C., Poli V. Essential role of STAT3 in the control of the acute-phase response as revealed by inducible gene inactivation [correction of activation] in the liver. Mol. Cell. Biol. 2001;21:1621–1632. - PMC - PubMed
    1. Anderson E.J., Lustig M.E., Boyle K.E., Woodlief T.L., Kane D.A., Lin C.T., Price J.W., 3rd, Kang L., Rabinovitch P.S., Szeto H.H. Mitochondrial H2O2 emission and cellular redox state link excess fat intake to insulin resistance in both rodents and humans. J. Clin. Invest. 2009;119:573–581. - PMC - PubMed
    1. Auguet T., Terra X., Quintero Y., Martínez S., Manresa N., Porras J.A., Aguilar C., Orellana-Gavaldà J.M., Hernández M., Sabench F. Liver lipocalin 2 expression in severely obese women with non alcoholic fatty liver disease. Exp. Clin. Endocrinol. Diabetes. 2013;121:119–124. - PubMed
    1. Baffy G., Brunt E.M., Caldwell S.H. Hepatocellular carcinoma in non-alcoholic fatty liver disease: an emerging menace. J. Hepatol. 2012;56:1384–1391. - PubMed

Publication types

MeSH terms

Substances