. 2019 Jan 24;87(2):e00793-18.
doi: 10.1128/IAI.00793-18. Print 2019 Feb.

Zebrafish Granulocyte Colony-Stimulating Factor Receptor Maintains Neutrophil Number and Function throughout the Life Span

Affiliations

Zebrafish Granulocyte Colony-Stimulating Factor Receptor Maintains Neutrophil Number and Function throughout the Life Span

Faiza Basheer et al. Infect Immun. .

Abstract

Granulocyte colony-stimulating factor receptor (G-CSFR), encoded by the CSF3R gene, represents a major regulator of neutrophil production and function in mammals, with inactivating extracellular mutations identified in a cohort of neutropenia patients unresponsive to G-CSF treatment. This study sought to elucidate the role of the zebrafish G-CSFR by generating mutants harboring these inactivating extracellular mutations using genome editing. Zebrafish csf3r mutants possessed significantly decreased numbers of neutrophils from embryonic to adult stages, which were also functionally compromised, did not respond to G-CSF, and displayed enhanced susceptibility to bacterial infection. The study has identified an important role for the zebrafish G-CSFR in maintaining the number and functionality of neutrophils throughout the life span and created a bona fide zebrafish model of nonresponsive neutropenia.

Keywords: blood diseases; cytokine receptors; developmental hematopoiesis; neutropenia; zebrafish.


Figures

FIG 1
FIG 1
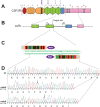
Generation of csf3r mutants based on neutropenia-associated alleles. (A) G-CSFR and its perturbation in neutropenia. The schematic representation of the G-CSFR shows the N-terminal leader sequence (open triangle), followed by the extracellular region comprising the immunoglobulin domain (red), four conserved cysteines (thin lines), and a W-S-X-W-S motif (thick line) within the cytokine receptor homology domain (orange); three fibronectin type III-like domains (green); and a transmembrane domain (blue); as well as boxes 1 to 3 (numbered gray rectangles) within the cytoplasmic region (pink), which includes four tyrosine (Y) residues. The exon boundaries of the zebrafish G-CSFR are shown by dashed vertical lines, and the relative positions of human G-CSFR extracellular truncations associated with SCN or CIN are indicated above the diagram by arrows. (B and C) Genome targeting of zebrafish csf3r. (B) Schematic representation of the intron/exon structure of part of the csf3r gene. Exons are represented as numbered boxes colored as in panel A, with the introns represented by solid lines and spanning primers indicated by arrows. (C) Targeting of exon 13 with a TALEN pair. The relevant nucleotide sequence is shown, with its targeting by left and right TALENs indicated and the TaqI restriction site italicized and underlined. (D) csf3r mutant alleles generated. Shown are sequences of homozygous wild-type (wt) and mutant (mdu5 and mdu6) csf3r alleles, with the respective translations shown below. The csf3rmdu5 allele represents a 13-bp deletion and the csf3rmdu6 allele an 11-bp deletion, both of which cause a frameshift resulting in a small number of residues translated from an alternative reading frame, followed by a stop codon that truncates at the C terminus of the third fibronectin type III-like domain.
FIG 2
FIG 2
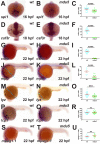
Effect of G-CSFR truncation on primitive myeloid cells. Homozygous wild-type (wt) and csf3rmdu5/mdu5 (mdu5) embryos were subjected to WISH with spi1 at 16 h postfertilization (hpf) (A and B); csf3r at 18 hpf (D and E) and 22 hpf (G and H); and mpo (J and K), lyz (M and N), lcp1 (P and Q), and mpeg1.1 (S and T) at 22 hpf. Individual embryos were assessed for the number of spi1+ (C), csf3r+ (F and I), mpo+ (L), lyz+ (O), lcp1+ (R), and mpeg1.1+ (U) cells, with the means and standard errors of the mean (SEM) shown in red and statistically significant differences indicated (****, P < 0.0001; ***, P < 0.001; ns, not significant). The dashed lines demarcate the extents of migration of mpo+ and lyz+ cell populations.
FIG 3
FIG 3
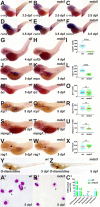
Effect of G-CSFR truncation on definitive hematopoiesis. Homozygous wild-type (wt), csf3rmdu5/mdu5 (mdu5), and csf3rmdu6/mdu6 (mdu6) embryos were subjected to WISH with c-myb (A to C) and runx1 (D to F) at 3.5 dpf; csf3r at 4 dpf (G and H); and mpo (J and K), lyz (M and N), lcp1 (P and Q), mpeg1.1 (S and T), and rag1 (V and W) or whole-embryo staining with O-dianisidine (X and Y) at 5 dpf or were subjected to blood analysis at 5 dpf (A′ and B′). e, erythrocyte; n, neutrophil. Individual embryos wetre assessed for the numbers of csf3r+ (I), mpo+ (L), lyz+ (O), lcp1+ (R), and mpeg1.1+ (U) cells. The area of staining for rag1 is expressed as a ratio to eye size averaged for individual embryos (X) or blood differential counts (C′), with means and SEM shown in red and statistically significant differences indicated (****, P < 0.0001; ***, P < 0.001; ns, not significant).
FIG 4
FIG 4
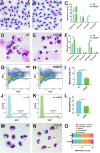
Effect of G-CSFR truncation on adult myeloid cells. (A to F and M to O). Histological analysis of adult blood and kidney cells. Imaging (A and B, D and E, and M and N) and quantitation of indicated cell populations (C, F, and O) of Giemsa-stained blood (A to C), kidney (D to F), and sorted kidney myeloid (M to O) cells from wild-type (wt) and csf3rmdu5/mdu5 (mdu5) adult fish, with hypersegmented neutrophils indicated by arrows. e, erythrocyte; eo, eosinophil; l, lymphocyte; n, neutrophil; p, precursor. Means and SEM are shown, and statistically significant differences are indicated (***, P < 0.001; **, P < 0.01). (G to L) FACS analysis of myeloid cells. Shown are analyses of kidney myeloid (G and H) and GFP+ neutrophil (J and K) populations of wild-type (wt) and csf3rmdu5/mdu5 (mdu5) adult fish and their respective quantitations (I and L), with means and SEM shown and statistically significant differences indicated (****, P < 0.0001; **, P < 0.01).
FIG 5
FIG 5
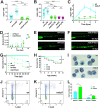
Functional consequences of G-CSFR truncation. (A) Response to exogenous G-CSF. Wild-type (wt) and csf3rmdu5/mdu5 (mdu5) embryos at the 1- to 8-cell stage were either left uninjected or injected with csf3a mRNA (+csf3a) and analyzed at 48 h with mpo, with the numbers of mpo+ cells in individual embryos shown. Means and SEM are shown in red, and statistically significant differences are indicated. (B) Response to LPS injection. Wild-type (wt), csf3rmdu5/mdu5 (mdu5), and csf3rmdu6/mdu6 (mdu6) embryos at 48 hpf were either left uninjected or injected with LPS (+LPS) and analyzed 8 h later with mpo as described for panel A. (C) Response to wounding. Quantitation of myeloid cell recruitment at the indicated hours postwounding (hpw) in wild-type (wt) and csf3rmdu5/mdu5 (mdu5) embryos, showing means and SEM using mpo and analyzed as described for panel A. (D to G) Response to bacterial infection. Wild-type (wt) and csf3rmdu5/mdu5 (mdu5) embryos at 72 hpf were injected with PBS or fluorescent E. coli (+bact). The bacterial load was enumerated by plate counting (D), with means and SEM shown in red; visualized by fluorescence microscopy (E and F) at the indicated hours postinfection (hpi); and displayed as a Kaplan-Meier plot (G) (wt versus mdu5, ***, P < 0.001; uninfected versus infected, ####, P < 0.0001). (H) Relative juvenile survival. Wild-type (wt), csf3rmdu5/mdu5 (mdu5), and csf3rmdu6/mdu6 (mdu6) juveniles were placed in tanks on the standard recirculating aquarium system, and survival was monitored and displayed as a Kaplan-Meier plot. (I to L) Analysis of adult kidney myeloid cells. Shown are staining of sorted myeloid cells for myeloperoxidase (I) and analysis of myeloid cells for apoptosis using annexin V/7-AAD staining (J and K), with quantitation of early (AnnV+/7-AAD) and late (AnnV+/7-AAD+) cells (L). ****, P < 0.0001; ***, P < 0.001; **, P < 0.01; *, P < 0.05; ns, not significant.

Similar articles

Cited by

References

    1. Liongue C, Wright C, Russell AP, Ward AC. 2009. Granulocyte colony-stimulating factor receptor: stimulating granulopoiesis and much more. Int J Biochem Cell Biol 41:2372–2375. doi:10.1016/j.biocel.2009.08.011. - DOI - PubMed
    1. Germeshausen M, Ballmaier M, Welte K. 2007. Incidence of CSF3R mutations in severe congenital neutropenia and relevance for leukemogenesis: results of a long-term survey. Blood 109:93–99. doi:10.1182/blood-2006-02-004275. - DOI - PubMed
    1. Berliner N. 2008. Lessons from congenital neutropenia: 50 years of progress in understanding myelopoiesis. Blood 111:5427–5432. doi:10.1182/blood-2007-10-077396. - DOI - PubMed
    1. Ward AC, Dale DC. 2009. Genetic and molecular approaches to the diagnosis of severe congenital neutropenia. Curr Opin Hematol 16:9–13. doi:10.1097/MOH.0b013e32831952de. - DOI - PMC - PubMed
    1. Dale DC, Bolyard AA, Schwinzer BG, Pracht G, Bonilla MA, Boxer LA, Freedman MH, Donadieu J, Kannourakis G, Alter BP, Cham BP, Winkelstein J, Kinsey SE, Zeidler C, Welte K. 2006. The severe congenital neutropenia international registry: 10-year follow-up report. Support Cancer Ther 3:220–231. doi:10.3816/SCT.2006.n.020. - DOI - PubMed

Publication types

MeSH terms

Substances

LinkOut - more resources