. 2018 Nov 19;374(1763):20170389.
doi: 10.1098/rstb.2017.0389.

Historical collections as a tool for assessing the global pollination crisis

Affiliations

Historical collections as a tool for assessing the global pollination crisis

I Bartomeus et al. Philos Trans R Soc Lond B Biol Sci. .

Abstract

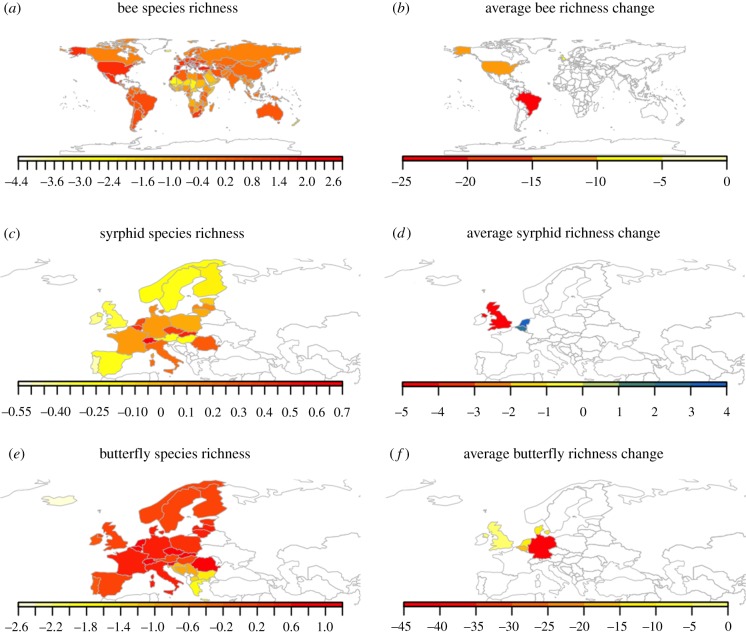
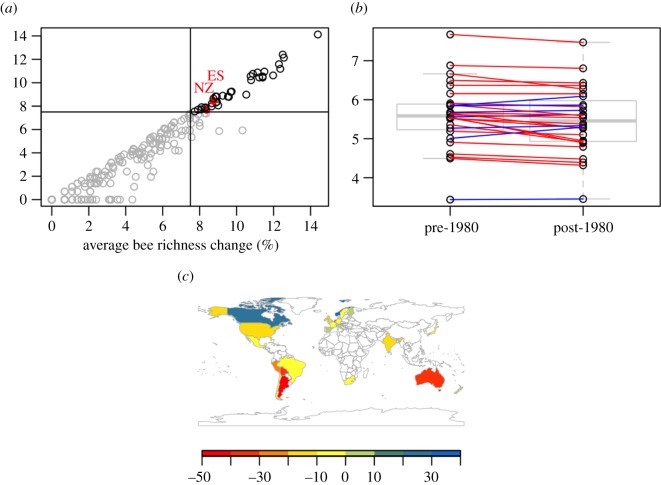
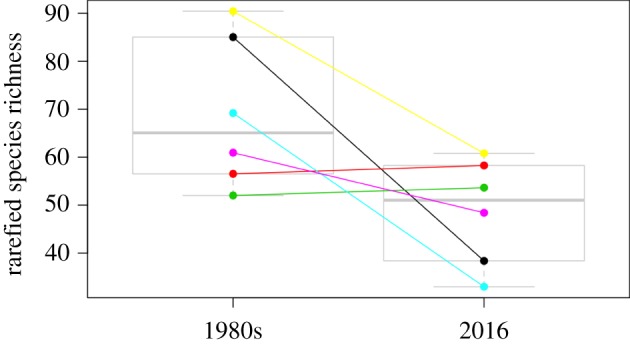
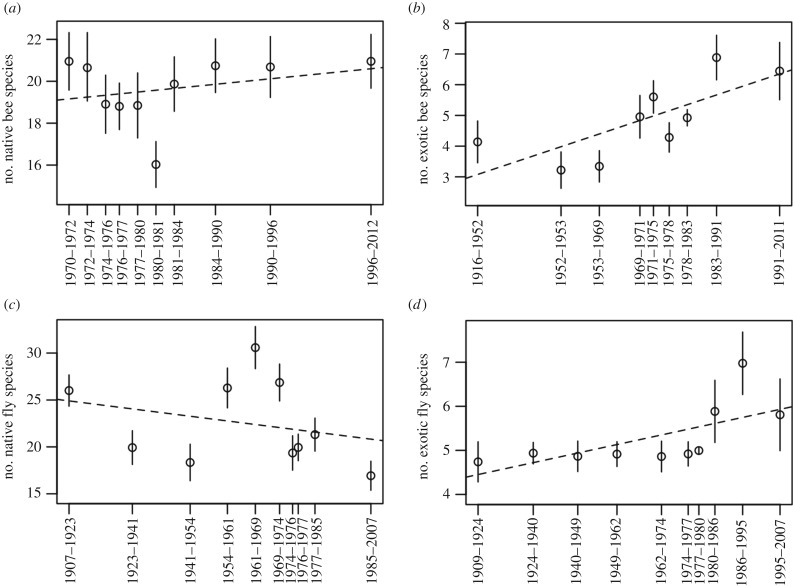
There is increasing concern about the decline of pollinators worldwide. However, despite reports that pollinator declines are widespread, data are scarce and often geographically and taxonomically biased. These biases limit robust inference about any potential pollinator crisis. Non-structured and opportunistic historical specimen collection data provide the only source of historical information which can serve as a baseline for identifying pollinator declines. Specimens historically collected and preserved in museums not only provide information on where and when species were collected, but also contain other ecological information such as species interactions and morphological traits. Here, we provide a synthesis of how researchers have used historical data to identify long-term changes in biodiversity, species abundances, morphology and pollination services. Despite recent advances, we show that information on the status and trends of most pollinators is absent. We highlight opportunities and limitations to progress the assessment of pollinator declines globally. Finally, we demonstrate different approaches to analysing museum collection data using two contrasting case studies from distinct geographical regions (New Zealand and Spain) for which long-term pollinator declines have never been assessed. There is immense potential for museum specimens to play a central role in assessing the extent of the global pollination crisis.This article is part of the theme issue 'Biological collections for understanding biodiversity in the Anthropocene'.

Keywords: bees; biodiversity; butterflies; global change; museums; syrphid flies.


Conflict of interest statement

We have no competing interests.

Figures

Figure 1.
Figure 1.
Global map showing bee (a), syrphid (c) and butterfly (e) species richness per area (data from http://www.discoverlife.org, IUCN and http://www.syrphidae.com/). All richness levels are calculated as the residuals of the log–log regression between bee species richness per country and country size. This correction accounts for the species–area relationship. Warmer colours indicate higher bee diversity. Note that some African countries may have incomplete listed faunas and that Alaska is included with US values. Countries with available historical changes in (b) bee, (d) syrphid and (f) butterfly richness within the last 100 years. Warmer colours indicate steeper average declines. Countries without data are coloured in white. (Online version in colour.)
Figure 2.
Figure 2.
Exploration of available data for bee records showing (a) the number of bee occurrences before 1980 and after 1980 in GBIF for each country. The upper right quadrat (records in black) contains well-covered countries with New Zealand (NZ) and Spain (ES) marked in red. For those countries, we show a tentative comparison of the rarefied number of species in both time periods and show that for most countries, the number of species recorded is slightly lower (red lines) in recent time periods (b). A more careful analysis of these data would help complete the map of global declines (c). In the map, we plot that % change as species recorded in GBIF for the available countries to show the geographical coverage. Note that these data are likely to contain strong undetected biases, as we explore below. (Online version in colour.)
Figure 3.
Figure 3.
Comparison of historical collections (1980s) and modern re-surveys (2016) of the rarefied richness of bees at six Spanish localities. (Online version in colour.)
Figure 4.
Figure 4.
Changes in rarefied species richness for different pollinator groups in New Zealand over time. All trends were non-significant (α = 0.05).
Figure 5.
Figure 5.
Model estimated changes (±1 s.e.) in the relative occurrence frequency of different New Zealand bee and fly species in museum collections over time. (Online version in colour.)

References

    1. Ollerton J, Winfree R, Tarrant S. 2011. How many flowering plants are pollinated by animals? Oikos 120, 321–326. (10.1111/j.1600-0706.2010.18644.x) - DOI
    1. Klein AM, Vaissiere BE, Cane JH, Steffan-Dewenter I, Cunningham SA, Kremen C, Tscharntke T. 2007. Importance of pollinators in changing landscapes for world crops. Proc. R. Soc. B 274, 303–313. (10.1098/rspb.2006.3721) - DOI - PMC - PubMed
    1. Buchmann SL, Nabhan GP.. 1996. The forgotten pollinators. Washington, DC: Island Press.
    1. National Research Council. 2007. Status of Pollinators in North America. Washington, DC: The National Academies Press.
    1. Goulson D, Nicholls E, Botías C, Rotheray EL. 2015. Bee declines driven by combined stress from parasites, pesticides, and lack of flowers. Science 347, 1255957 (10.1126/science.1255957) - DOI - PubMed

Publication types