. 2019 Jan 28;201(4):e00642-18.
doi: 10.1128/JB.00642-18. Print 2019 Feb 15.

A LysM Domain Intervenes in Sequential Protein-Protein and Protein-Peptidoglycan Interactions Important for Spore Coat Assembly in Bacillus subtilis

Affiliations

A LysM Domain Intervenes in Sequential Protein-Protein and Protein-Peptidoglycan Interactions Important for Spore Coat Assembly in Bacillus subtilis

Fatima C Pereira et al. J Bacteriol. .

Abstract

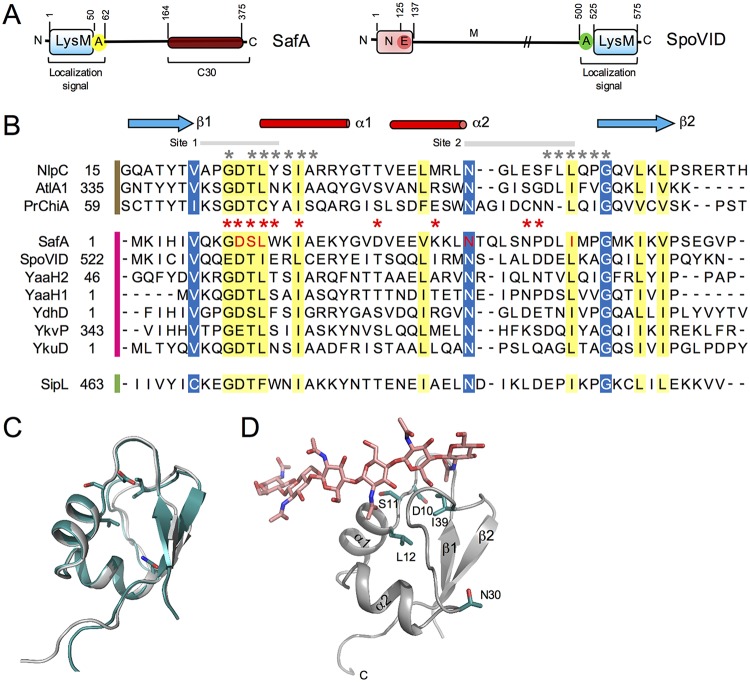
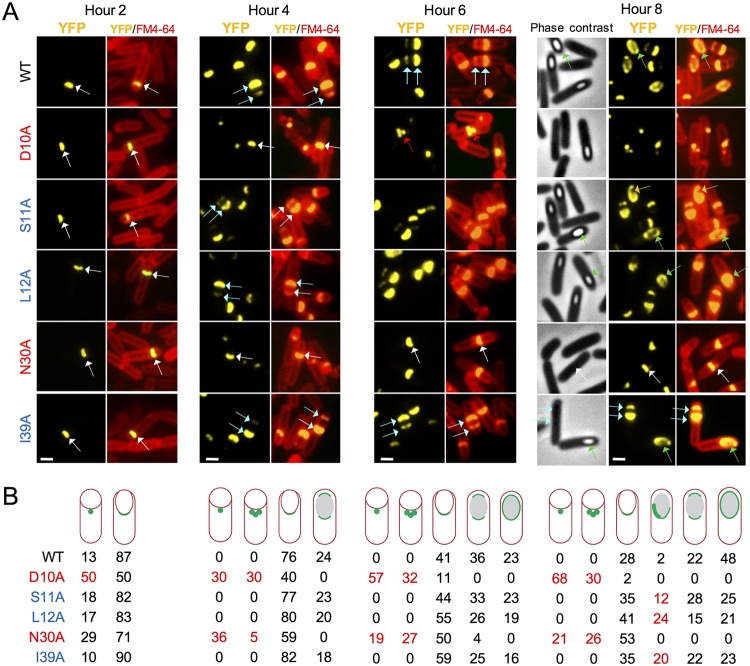
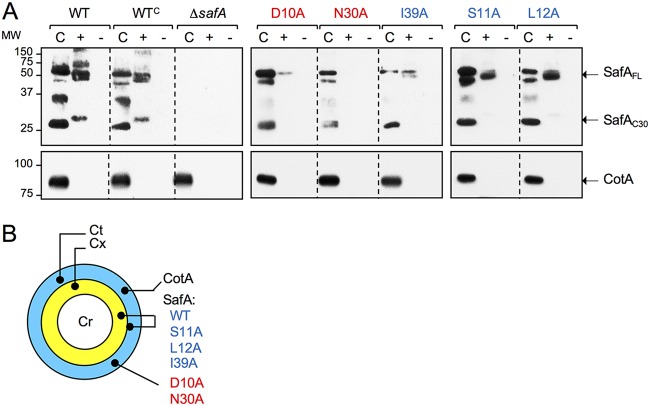
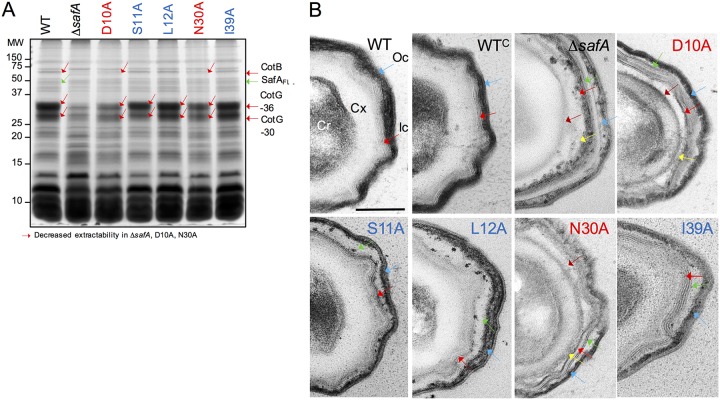
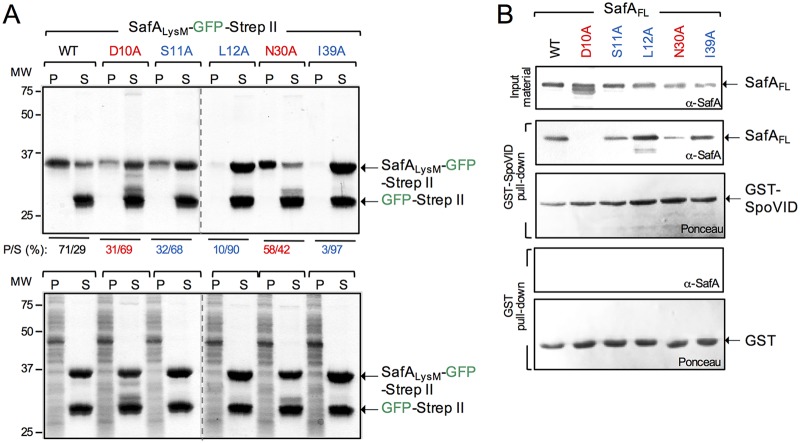
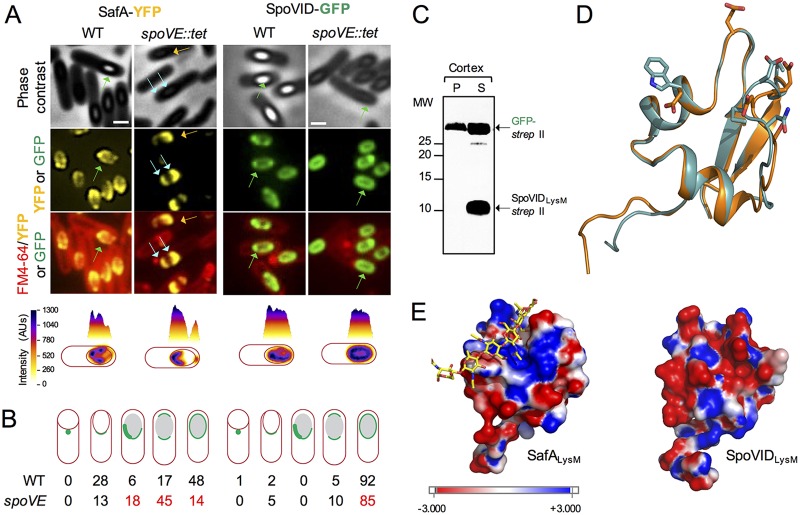
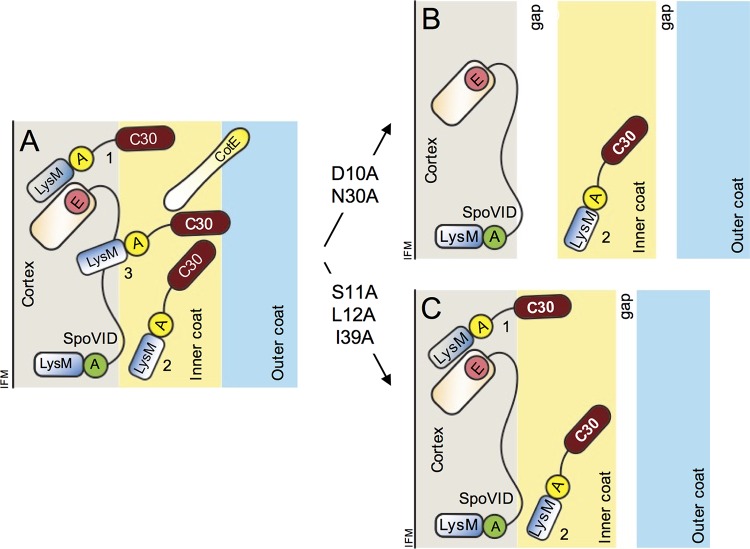
At a late stage in spore development in Bacillus subtilis, the mother cell directs synthesis of a layer of peptidoglycan known as the cortex between the two forespore membranes, as well as the assembly of a protective protein coat at the surface of the forespore outer membrane. SafA, the key determinant of inner coat assembly, is first recruited to the surface of the developing spore and then encases the spore under the control of the morphogenetic protein SpoVID. SafA has a LysM peptidoglycan-binding domain, SafALysM, and localizes to the cortex-coat interface in mature spores. SafALysM is followed by a region, A, required for an interaction with SpoVID and encasement. We now show that residues D10 and N30 in SafALysM, while involved in the interaction with peptidoglycan, are also required for the interaction with SpoVID and encasement. We further show that single alanine substitutions on residues S11, L12, and I39 of SafALysM that strongly impair binding to purified cortex peptidoglycan affect a later stage in the localization of SafA that is also dependent on the activity of SpoVE, a transglycosylase required for cortex formation. The assembly of SafA thus involves sequential protein-protein and protein-peptidoglycan interactions, mediated by the LysM domain, which are required first for encasement then for the final localization of the protein in mature spores.IMPORTANCEBacillus subtilis spores are encased in a multiprotein coat that surrounds an underlying peptidoglycan layer, the cortex. How the connection between the two layers is enforced is not well established. Here, we elucidate the role of the peptidoglycan-binding LysM domain, present in two proteins, SafA and SpoVID, that govern the localization of additional proteins to the coat. We found that SafALysM is a protein-protein interaction module during the early stages of coat assembly and a cortex-binding module at late stages in morphogenesis, with the cortex-binding function promoting a tight connection between the cortex and the coat. In contrast, SpoVIDLysM functions only as a protein-protein interaction domain that targets SpoVID to the spore surface at the onset of coat assembly.

Keywords: LysM domain; SpoVID; peptidoglycan-binding protein; spore coat; spore cortex; sporulation.


Figures

FIG 1
FIG 1
(A) Diagram of the SafA and SpoVID proteins. SafA (left) has a LysM domain at its N terminus, followed by region A, which together form a localization signal. The SafAC30 region of the full-length protein corresponds to the part that is produced from the safA mRNA by internal translation starting at Met codon 161 or 164. SpoVID (right) is formed by an N domain, followed by the E region (for encasement), a middle domain (M), and a localization signal, formed by region A and a LysM domain. (B) Clustal W alignment of the LysM domain of SafA with the LysM domains of the indicated selected proteins. The LysM sequences are grouped according to the organism of origin and the availability of crystal structures, as follows: B. subtilis, pink bar; C. difficile, green bar; sequences with available structure, brown bar. Residues shaded in yellow represent conserved residues, while residues shaded in blue represent conserved surface-exposed residues. The five residues of SafALysM that were replaced by alanine in this study are shown in red. (C) Superimposition of the homology model generated for SafALysM with that of the template, the N-terminal LysM domain from the putative NlpC/P60 d,l-endopeptidase from T. thermophilus bound to N-acetyl-chitohexaose (PDB ID 4UZ3). SafA, gray; template, blue. (D) Homology model of SafA bound to chitohexose, to locate the substrate binding site. Chitohexose is shown using sticks with carbon atoms colored in pink. To place this molecule, the model structure was superimposed on the template structure containing chitohexose. (C and D) The two α-helices and the two β-strands are labeled in the model, and the positions of the conserved D10, S11, L12, N30, and I39 residues, which were replaced by Ala, are highlighted using sticks and with carbon atoms colored in green.
FIG 2
FIG 2
Localization of SafA-YFP. (A) Subcellular localization of SafA-YFP in sporulating cells. Strains were induced to sporulate by growth and resuspension. Samples were withdrawn at the indicated times, in hours, after resuspension, defined as the onset of sporulation, stained with the membrane dye FM4-64, and imaged by fluorescence microscopy (phase-contrast images are also shown for the hour 8 sample). The images show the YFP signal or the merge between the YFP and FM4-64 signals. All strains carry an in-frame deletion allele of safA and yfp fusions to the WT gene or to alleles expressing fusion proteins with the indicated single amino acid substitutions, inserted at the nonessential amyE locus. White arrows, single cap; blue arrows, double cap; green arrows, full encirclement; red arrows, multiple dots; orange arrows, asymmetric localization of SafA-YFP around the spore. Scale bar = 1 µm. (B) Scoring of the percentage of sporangia with the represented patterns of SafA-YFP localization at the indicated times after the onset of sporulation. (A and B) Substitutions causing early localization defects are highlighted in red, and those causing late localization defects are in blue. The numbers in red highlight the phenotypes.
FIG 3
FIG 3
Localization of SafA in mature spores. (A) Proteins were extracted from density gradient-purified spores of the indicated strains to produce a coat fraction (“C”). The decoated spores were then reextracted following incubation with lysozyme (“+”) or with no lysozyme treatment (“–”). The extracted proteins were resolved by SDS-PAGE and the gels subject to immunoblotting with anti-SafA antibodies or anti-CotA antibodies, as indicated. The positions SafAFL, SafAC30, and CotA are indicated by arrows. The position of molecular weight markers (in kilodaltons) is shown on the left side of the panels. The profile of extractable coat proteins is compared to that of the WT and to an in-frame safA deletion mutant (ΔsafA). The remaining strains carry ΔsafA, and the WT gene (denoted as WTC, for complementation) or alleles expressing proteins with the indicated substitutions, at amyE. (B) Schematic representation of the localization of CotA, SafAWT, and the indicated variants in mature spores. Cr, spore coat; Cx, cortex; Ct, coat. (A and B) The color code for the substitutions is defined in the legend for Fig. 2.
FIG 4
FIG 4
Substitutions in the LysM domain affect the composition and structure of spores. (A) Spores were purified by density gradient centrifugation, and the coat proteins were extracted and resolved by SDS-PAGE. The gel was stained with Coomassie brilliant blue R-250. Spores analyzed were from the WT, a ΔsafA in-frame deletion mutant, and derivatives of the ΔsafA mutant expressing alleles of safA coding for proteins with the indicated substitutions (color code as in Fig. 2) from the amyE locus. The proteins indicated with red arrows show decreased extractability from spores of the ΔsafA, D10A, and N30A mutant strains. The positions of molecular weight (MW) markers, in kilodaltons, are shown on the left side of the panel. (B) The same spores as in panel A were processed for analysis by transmission electron microscopy. Shown are representative specimens for the indicated strains. Cr, spore core; Cx, cortex; Ic, inner coat; Oc, outer coat. Red arrows, inner coat; blue arrows, outer coat; brown arrows, the space between the cortex and inner coat; green arrows, the space between the inner and outer coat; yellow arrows, partially unstructured material that accumulates at the inner edge of the inner coat. Scale bar = 0.2 µm.
FIG 5
FIG 5
Substitutions in the LysM domain impair its interaction with peptidoglycan or with SpoVID. (A) SafALysM-GFP-Strep-tag II proteins, WT, and variants with the indicated substitutions were purified along with GFP-Strep-tag II. The SafALysM proteins were mixed with GFP-Strep-tag II included to control for the tags, and with cortex peptidoglycan purified from WT spores. Following incubation, the suspensions were centrifuged and separated into a pellet (P, representing the binding fraction) and a supernatant (S, representing the nonbinding fraction). The gels were stained with Coomassie brilliant blue R-250, and the percentage of SafALysM-GFP-Strep-tag II in the P and S fractions was estimated with ImageJ (shown below the panel). The bottom is a control experiment in which the cortex PG was digested with lysozyme before the proteins were added. The arrows on the right show the position of SafALysM-GFP-Strep-tag II and GFP-Strep-tag II; the positions of molecular weight standards, in kilodaltons, are shown on the left side of the panel. (B) GST-SpoVID pulldown assay. Whole-cell extracts were prepared from E. coli strains producing the forms of SafA with the indicated single amino acid substitutions (color coded as in Fig. 2), GST, or GST-SpoVID. The extracts prepared from the strains producing the various forms of SafA were mixed with the GST-containing (two bottom panels) or GST-SpoVID-containing extracts (two middle panels). Following incubation, proteins were pulled with GST beads. Bound proteins were then eluted and resolved by SDS-PAGE, and the gel was subject to immunoblot analysis with an anti-SafAFL antibody. The membranes were stained with Ponceau red to control for the levels of GST or GST-SpoVID. The presence and levels of the various forms of SafA are shown at the top (input material). The arrows show the positions of SafA, GST, and GST-SpoVID. The positions of molecular weight standards (in kilodaltons) are shown on the left side of the panel.
FIG 6
FIG 6
Localization of SpoVID and SafA in a cortex-less mutant. (A) Localization of SafA-YFP and SpoVID-GFP in WT and spoVE sporangia. Samples were taken from cultures producing SpoVID-GFP or SafA-YFP in either the WT or a congenic spoVE::tet mutant in resuspension medium 8 h after the onset of sporulation (see also Fig. S3 for earlier time points). Cells were stained with FM4-64 and imaged by phase-contrast and fluorescence microscopy. Scale bars = 1 µm. One cell representative of the prevalent localization pattern was chosen to show the distribution of the fluorescence signal (in arbitrary units [AU]) in three-dimensional intensity graphs. Blue arrows, double cap; green arrows, full encirclement; orange arrows, asymmetric localization around the spore. (B) Quantification of SpoVID-GFP or SafA-YFP localization. The percentage of cells showing the localization pattern schematically depicted is shown for the two fusions in the WT and spoVE::tet background. The numbers in red highlight the phenotypes. (C) Binding assay of SpoVIDLysM-Strep-tag II to purified cortex peptidoglycan. SpoVIDLysM-Strep-tag II and GFP-Strep-tag II were partially purified, mixed together, and further mixed with purified cortex peptidoglycan. Following incubation, the mixtures were centrifuged to produce a pellet (P) and a supernatant (S) fraction. Following SDS-PAGE of the P and S samples, the presence of SpoVIDLysM-Strep-tag II or GFP-Strep-tag II in either fraction was assessed by immunoblotting with anti-Strep-tag II antibodies. The position of the relevant species is indicated by arrows, and the positions of molecular weight markers are indicated on the left side of the panels. (D) Comparison of the SpoVID (cyan) and SafA (orange) structures. The model for the LysM domain of SpoVID was based on the crystal structure of the NlpC/P60 d,l-endopeptidase from T. thermophilus (PDB ID 4UZ3) as for SafA (see the legend for Fig. 1). The residues that differ most between the two structures, E9 versus G9, E13 versus W13, D35 versus N35, and D36 versus P36, are highlighted using sticks. (E) Comparison of the electrostatic surface maps of SafA (left) and SpoVID (right). Chitohexose is shown on the SafALysM model, using sticks with carbon atoms colored in yellow, to locate the substrate binding site (Fig. 1).
FIG 7
FIG 7
Role of the LysM domain in spore coat formation. (A) The localization of SafA to the cortex and inner coat relies on its interaction with SpoVID. SafALysM, together with region A (yellow circle), interacts with SpoVID. This interaction, required for encasement, involves residues D10 and N30 in SafALysM and region A. SafA becomes tightly associated with the cortex (1) but also assumes a more peripheral location, close to the edge of the cortex (3). In addition, it is present in the inner coat (2). CotE is found at the inner coat-outer coat interface from where it nucleates assembly of the outer coat. (B) In the D10A and N30 mutants, populations 1 and 3 are missing or greatly reduced and both the cortex-inner coat and inner coat-outer coat interfaces are not properly formed and a gap is seen between the three layers. (C) In the S11A, L12A, or I39A mutants, population 3 is missing. The cortex-inner coat interface is properly formed, but the inner coat-outer coat interface is not. Spores are represented at a late stage in morphogenesis, after synthesis of the spore cortex. At this stage, the forespore outer membrane may no longer exist. SafAC30 is not represented for simplicity, and CotE is omitted from panels B and C also for simplicity. SafAFL, SafAC30, and CotE are thought to polymerize (not represented). The proteins are not drawn to scale. IFM, inner forespore membrane. The diagram is an update of a recent figure (25).

Similar articles

Cited by

References

    1. Driks A, Eichenberger P. 2016. The spore coat. Microbiol Spectr 4(3):TBS-0023-2016. doi:10.1128/microbiolspec.TBS-0023-2016. - DOI - PubMed
    1. Henriques AO, Moran CP Jr.. 2007. Structure, assembly, and function of the spore surface layers. Annu Rev Microbiol 61:555–588. doi:10.1146/annurev.micro.61.080706.093224. - DOI - PubMed
    1. McKenney PT, Driks A, Eichenberger P. 2013. The Bacillus subtilis endospore: assembly and functions of the multilayered coat. Nat Rev Microbiol 11:33–44. doi:10.1038/nrmicro2921. - DOI - PMC - PubMed
    1. Setlow P, Wang S, Li YQ. 2017. Germination of spores of the orders Bacillales and Clostridiales. Annu Rev Microbiol 71:459–477. doi:10.1146/annurev-micro-090816-093558. - DOI - PubMed
    1. Tan IS, Ramamurthi KS. 2014. Spore formation in Bacillus subtilis. Environ Microbiol Rep 6:212–225. doi:10.1111/1758-2229.12130. - DOI - PMC - PubMed

Publication types

MeSH terms

LinkOut - more resources