

ERVmap analysis reveals genome-wide transcription of human endogenous retroviruses
- PMID: 30455304
- PMCID: PMC6294949
- DOI: 10.1073/pnas.1814589115
ERVmap analysis reveals genome-wide transcription of human endogenous retroviruses
Abstract
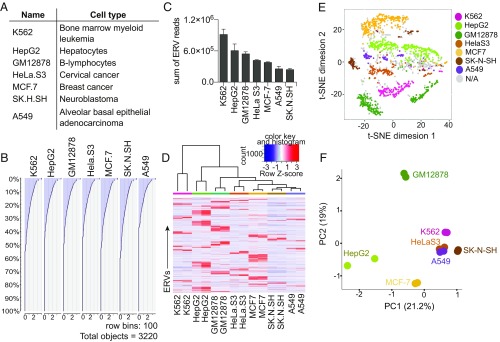
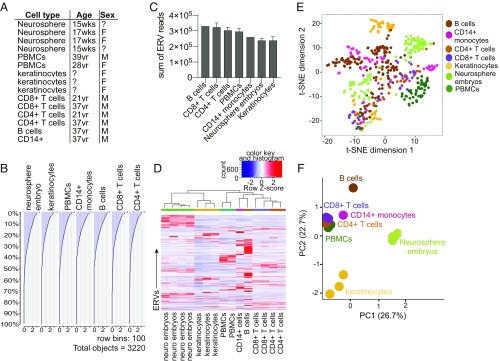
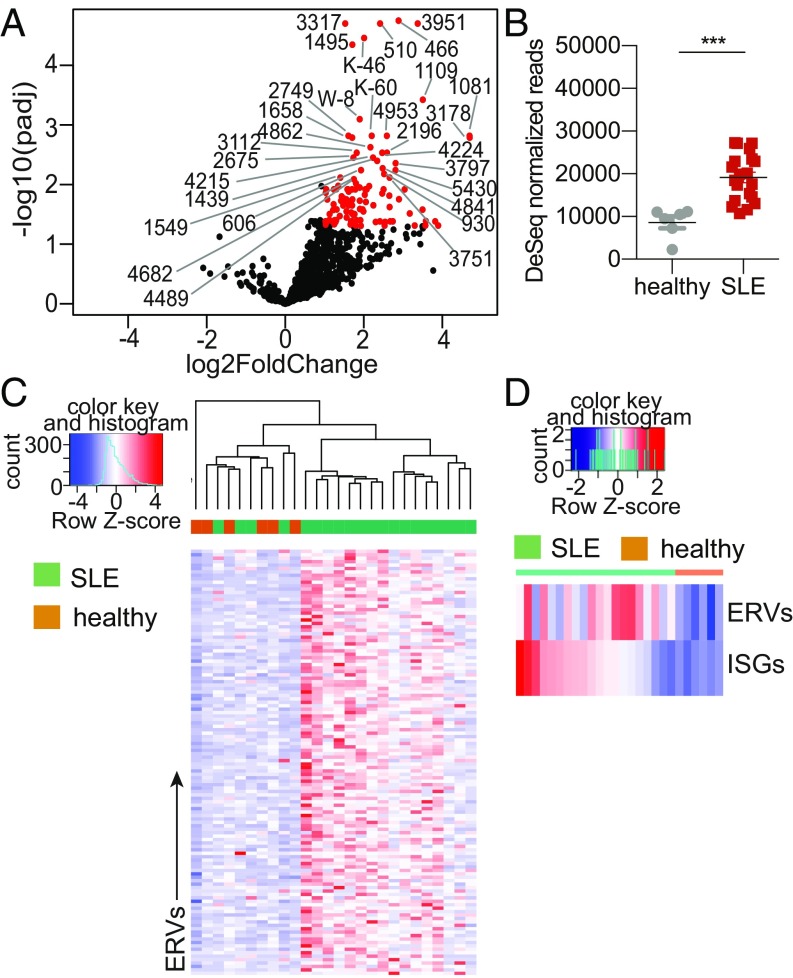
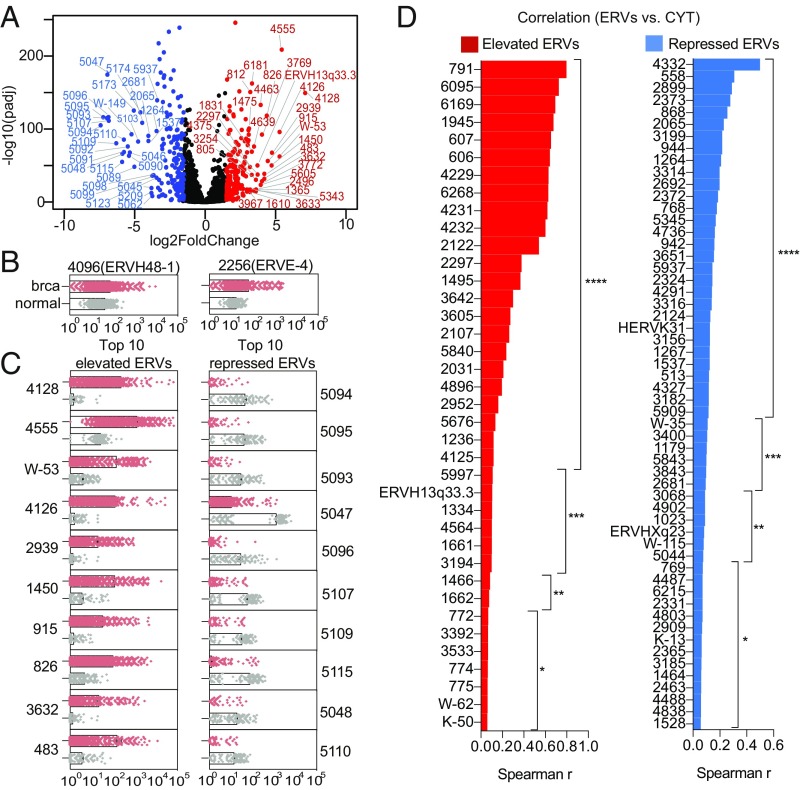
Endogenous retroviruses (ERVs) are integrated retroviral elements that make up 8% of the human genome. However, the impact of ERVs on human health and disease is not well understood. While select ERVs have been implicated in diseases, including autoimmune disease and cancer, the lack of tools to analyze genome-wide, locus-specific expression of proviral autonomous ERVs has hampered the progress in the field. Here we describe a method called ERVmap, consisting of an annotated database of 3,220 human proviral ERVs and a pipeline that allows for locus-specific genome-wide identification of proviral ERVs that are transcribed based on RNA-sequencing data, and provide examples of the utility of this tool. Using ERVmap, we revealed cell-type-specific ERV expression patterns in commonly used cell lines as well as in primary cells. We identified 124 unique ERV loci that are significantly elevated in the peripheral blood mononuclear cells of patients with systemic lupus erythematosus that represent an IFN-independent signature. Finally, we identified additional tumor-associated ERVs that correlate with cytolytic activity represented by granzyme and perforin expression in breast cancer tissue samples. The open-source code of ERVmap and the accompanied web tool are made publicly available to quantify proviral ERVs in RNA-sequencing data with ease. Use of ERVmap across a range of diseases and experimental conditions has the potential to uncover novel disease-associated antigens and effectors involved in human health that is currently missed by focusing on protein-coding sequences.
Keywords: RNA sequencing; cancer; endogenous retroviruses; lupus; retroelements.
Copyright © 2018 the Author(s). Published by PNAS.
Conflict of interest statement
The authors declare no conflict of interest.
Figures
Comment in
-
Reply to Iñiguez et al.: ERVmap is a validated approach to mapping proviral endogenous retroviruses in the human genome.Proc Natl Acad Sci U S A. 2019 Oct 22;116(43):21352-21353. doi: 10.1073/pnas.1908504116. Epub 2019 Oct 8. Proc Natl Acad Sci U S A. 2019. PMID: 31594852 Free PMC article. No abstract available.
-
Transcriptomic analysis of human endogenous retroviruses in systemic lupus erythematosus.Proc Natl Acad Sci U S A. 2019 Oct 22;116(43):21350-21351. doi: 10.1073/pnas.1907705116. Epub 2019 Oct 8. Proc Natl Acad Sci U S A. 2019. PMID: 31594853 Free PMC article. No abstract available.
Similar articles
-
Role of endogenous retroviruses in autoimmune diseases.Rheum Dis Clin North Am. 2003 Feb;29(1):123-43, vii. doi: 10.1016/s0889-857x(02)00098-4. Rheum Dis Clin North Am. 2003. PMID: 12635504 Review.
-
Endogenous retroviruses in systemic response to stress signals.Shock. 2008 Aug;30(2):105-16. doi: 10.1097/SHK.0b013e31816a363f. Shock. 2008. PMID: 18317406 Review.
-
Identification of a group of Mus dunni endogenous virus-like endogenous retroviruses from the C57BL/6J mouse genome: proviral genomes, strain distribution, expression characteristics, and genomic integration profile.Chromosome Res. 2012 Oct;20(7):859-74. doi: 10.1007/s10577-012-9322-z. Epub 2012 Nov 30. Chromosome Res. 2012. PMID: 23197326 Free PMC article.
-
Genome-Wide Characterization of Zebrafish Endogenous Retroviruses Reveals Unexpected Diversity in Genetic Organizations and Functional Potentials.Microbiol Spectr. 2021 Dec 22;9(3):e0225421. doi: 10.1128/spectrum.02254-21. Epub 2021 Dec 15. Microbiol Spectr. 2021. PMID: 34908463 Free PMC article.
-
Unexpected diversity and expression of avian endogenous retroviruses.mBio. 2012 Oct 16;3(5):e00344-12. doi: 10.1128/mBio.00344-12. mBio. 2012. PMID: 23073767 Free PMC article.
Cited by
-
CRL4-DCAF12 Ubiquitin Ligase Controls MOV10 RNA Helicase during Spermatogenesis and T Cell Activation.Int J Mol Sci. 2021 May 20;22(10):5394. doi: 10.3390/ijms22105394. Int J Mol Sci. 2021. PMID: 34065512 Free PMC article.
-
Viral Mimicry Response Is Associated With Clinical Outcome in Pleural Mesothelioma.JTO Clin Res Rep. 2022 Nov 7;3(12):100430. doi: 10.1016/j.jtocrr.2022.100430. eCollection 2022 Dec. JTO Clin Res Rep. 2022. PMID: 36467966 Free PMC article.
-
Meta-Analysis Suggests That Intron Retention Can Affect Quantification of Transposable Elements from RNA-Seq Data.Biology (Basel). 2022 May 27;11(6):826. doi: 10.3390/biology11060826. Biology (Basel). 2022. PMID: 35741347 Free PMC article.
-
Endogenous Retroviruses as Modulators of Innate Immunity.Pathogens. 2023 Jan 19;12(2):162. doi: 10.3390/pathogens12020162. Pathogens. 2023. PMID: 36839434 Free PMC article. Review.
-
Mobile genomics: tools and techniques for tackling transposons.Philos Trans R Soc Lond B Biol Sci. 2020 Mar 30;375(1795):20190345. doi: 10.1098/rstb.2019.0345. Epub 2020 Feb 10. Philos Trans R Soc Lond B Biol Sci. 2020. PMID: 32075565 Free PMC article. Review.
References
-
- Virgin HW, Wherry EJ, Ahmed R. Redefining chronic viral infection. Cell. 2009;138:30–50. - PubMed
-
- Xu F, et al. Trends in herpes simplex virus type 1 and type 2 seroprevalence in the United States. JAMA. 2006;296:964–973. - PubMed
-
- Staras SAS, et al. Seroprevalence of cytomegalovirus infection in the United States, 1988-1994. Clin Infect Dis. 2006;43:1143–1151. - PubMed
-
- Barton ES, et al. Herpesvirus latency confers symbiotic protection from bacterial infection. Nature. 2007;447:326–329. - PubMed
Publication types
MeSH terms
Grants and funding
LinkOut - more resources
Full Text Sources
Other Literature Sources
Molecular Biology Databases
