

The Shape of the Glucose Response Curve During an Oral Glucose Tolerance Test: Forerunner of Heightened Glycemic Failure Rates and Accelerated Decline in β-Cell Function in TODAY
- PMID: 30455329
- PMCID: PMC6300703
- DOI: 10.2337/dc18-1122
The Shape of the Glucose Response Curve During an Oral Glucose Tolerance Test: Forerunner of Heightened Glycemic Failure Rates and Accelerated Decline in β-Cell Function in TODAY
Abstract
Objective: Obese youth without diabetes with monophasic oral glucose tolerance test (OGTT) glucose response curves have lower insulin sensitivity and impaired β-cell function compared with those with biphasic curves. The OGTT glucose response curve has not been studied in youth-onset type 2 diabetes. Here we test the hypothesis that the OGTT glucose response curve at randomization in youth in the TODAY (Treatment Options for Type 2 Diabetes in Adolescents and Youth) study forecasts heightened glycemic failure rates and accelerated decline in β-cell function.
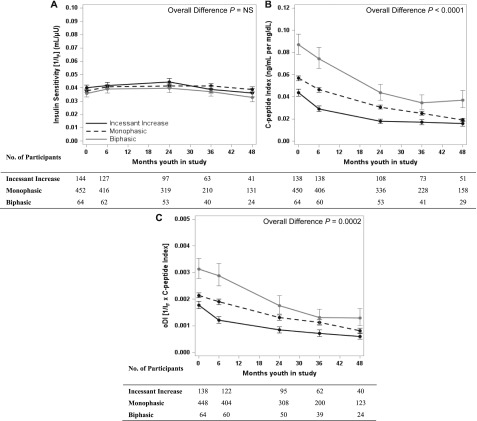
Research design and methods: OGTTs (n = 662) performed at randomization were categorized as monophasic, biphasic, or incessant increase. Demographics, insulin sensitivity (1/fasting insulin), C-peptide index (△C30/△G30), and β-cell function relative to insulin sensitivity (oral disposition index [oDI]) were compared among the three groups.
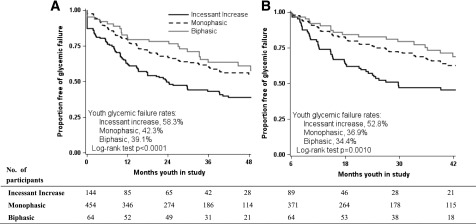
Results: At randomization, 21.7% had incessant increase, 68.6% monophasic, and 9.7% biphasic glucose response curves. The incessant increase group had similar insulin sensitivity but significantly lower C-peptide index and lower oDI, despite similar diabetes duration, compared with the other two groups. Glycemic failure rates were higher in the incessant increase group (58.3%) versus the monophasic group (42.3%) versus the biphasic group (39.1%) (P < 0.0001). The 6-month decline in C-peptide index (32.8% vs. 18.1% vs. 13.2%) and oDI (32.2% vs. 11.6% vs. 9.1%) was greatest in incessant increase versus monophasic and biphasic with no difference in insulin sensitivity.
Conclusions: In the TODAY study cohort, an incessant increase in the OGTT glucose response curve at randomization reflects reduced β-cell function and foretells increased glycemic failure rates with accelerated deterioration in β-cell function independent of diabetes duration and treatment assignment compared with monophasic and biphasic curves. The shape of the OGTT glucose response curve could be a metabolic biomarker prognosticating the response to therapy in youth with type 2 diabetes.
Trial registration: ClinicalTrials.gov NCT00081328.
© 2018 by the American Diabetes Association.
Figures
References
-
- Tschritter O, Fritsche A, Shirkavand F, Machicao F, Häring H, Stumvoll M. Assessing the shape of the glucose curve during an oral glucose tolerance test. Diabetes Care 2003;26:1026–1033 - PubMed
-
- Manco M, Nolfe G, Pataky Z, et al. Shape of the OGTT glucose curve and risk of impaired glucose metabolism in the EGIR-RISC cohort. Metabolism 2017;70:42–50 - PubMed
-
- Abdul-Ghani MA, Lyssenko V, Tuomi T, Defronzo RA, Groop L. The shape of plasma glucose concentration curve during OGTT predicts future risk of type 2 diabetes. Diabetes Metab Res Rev 2010;26:280–286 - PubMed
-
- Nolfe G, Spreghini MR, Sforza RW, Morino G, Manco M. Beyond the morphology of the glucose curve following an oral glucose tolerance test in obese youth. Eur J Endocrinol 2012;166:107–114 - PubMed
Publication types
MeSH terms
Substances
Associated data
Grants and funding
- U01 DK061254/DK/NIDDK NIH HHS/United States
- UL1 RR024153/RR/NCRR NIH HHS/United States
- UL1 RR025780/RR/NCRR NIH HHS/United States
- M01 RR000069/RR/NCRR NIH HHS/United States
- M01 RR000036/RR/NCRR NIH HHS/United States
- U01 DK061242/DK/NIDDK NIH HHS/United States
- UL1 RR024992/RR/NCRR NIH HHS/United States
- U01 DK061212/DK/NIDDK NIH HHS/United States
- M01 RR001066/RR/NCRR NIH HHS/United States
- M01 RR014467/RR/NCRR NIH HHS/United States
- U01 DK061230/DK/NIDDK NIH HHS/United States
- P30 DK045735/DK/NIDDK NIH HHS/United States
- UL1 RR025758/RR/NCRR NIH HHS/United States
- M01 RR000084/RR/NCRR NIH HHS/United States
- T32 DK007052/DK/NIDDK NIH HHS/United States
- UL1 TR002345/TR/NCATS NIH HHS/United States
- U01 DK061239/DK/NIDDK NIH HHS/United States
- UL1 RR024134/RR/NCRR NIH HHS/United States
