. 2019 Jan 11;294(2):608-622.
doi: 10.1074/jbc.RA118.004638. Epub 2018 Nov 19.

Glucosamine improves survival in a mouse model of sepsis and attenuates sepsis-induced lung injury and inflammation

Affiliations

Glucosamine improves survival in a mouse model of sepsis and attenuates sepsis-induced lung injury and inflammation

Ji-Sun Hwang et al. J Biol Chem. .

Abstract

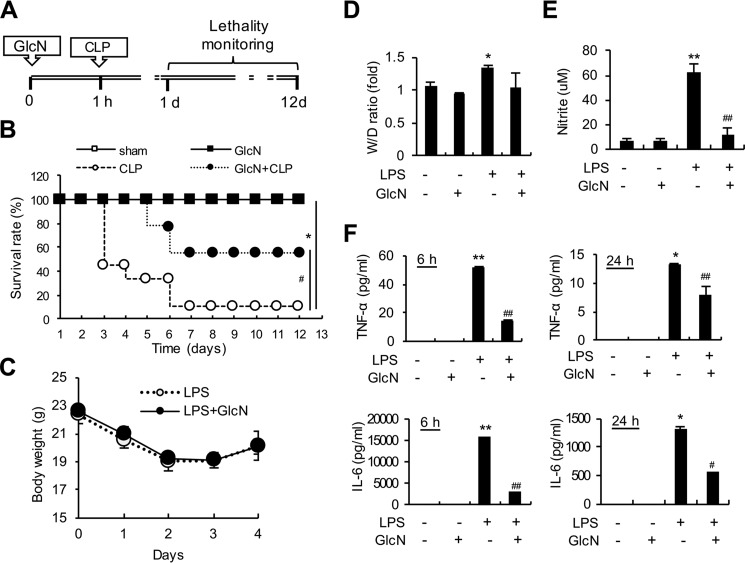
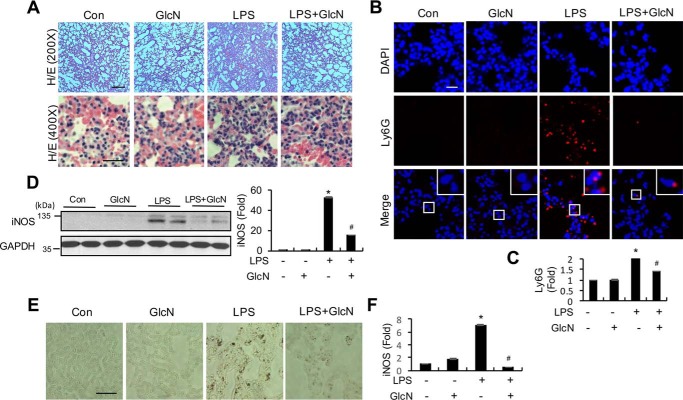
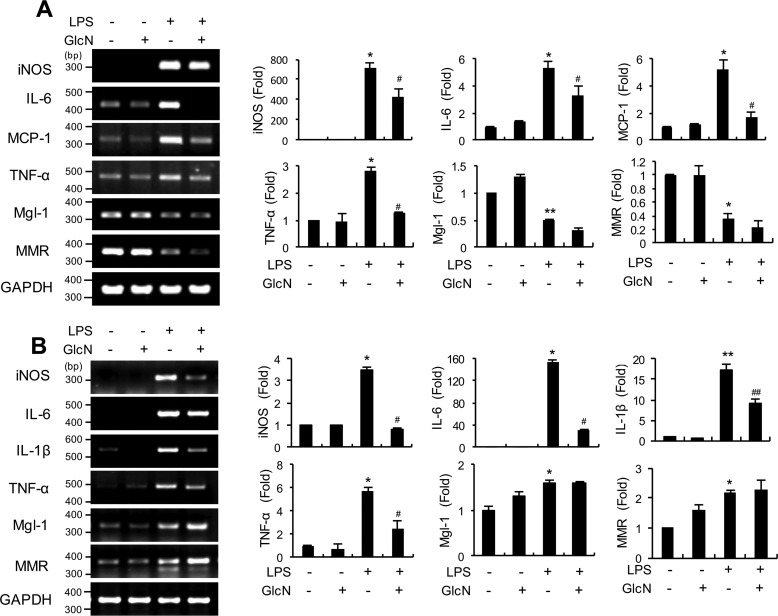
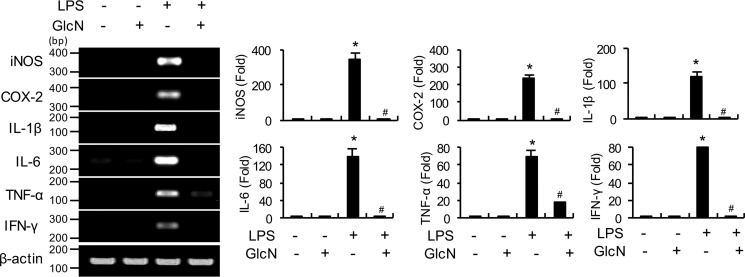
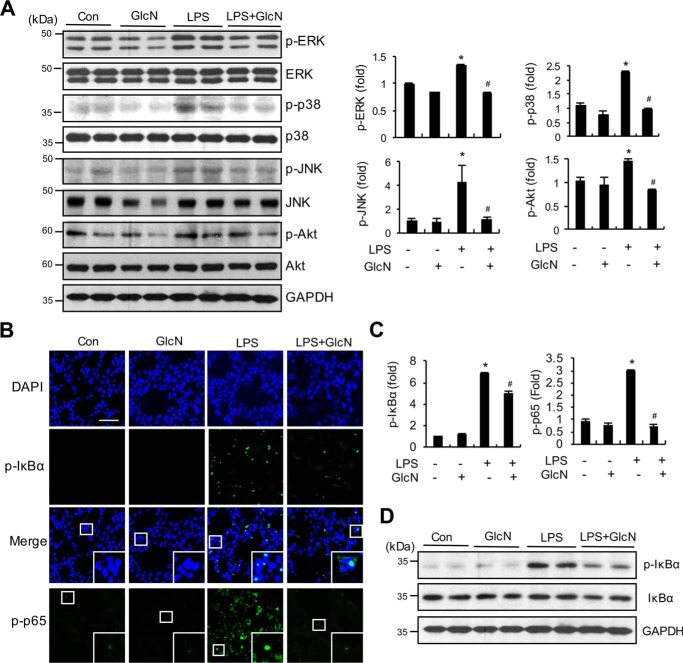
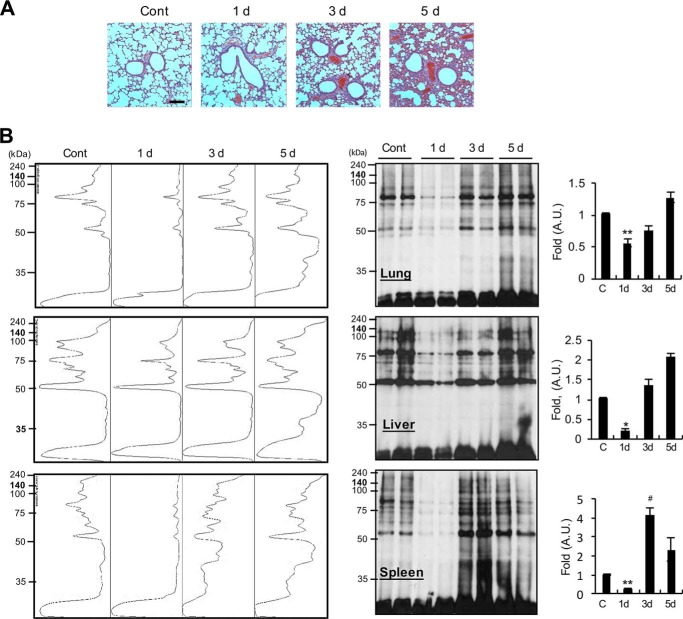
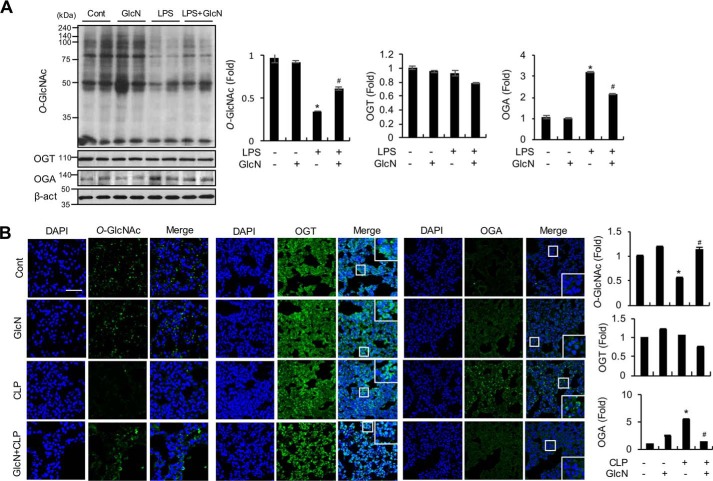
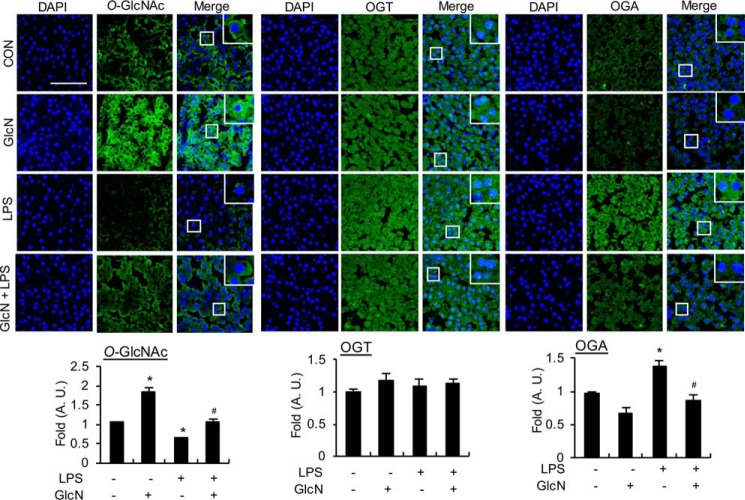
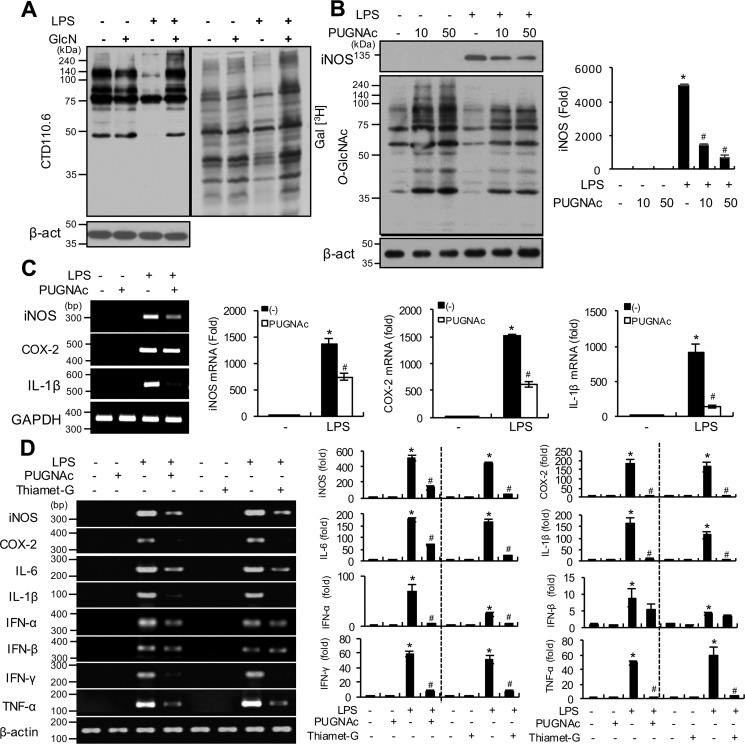
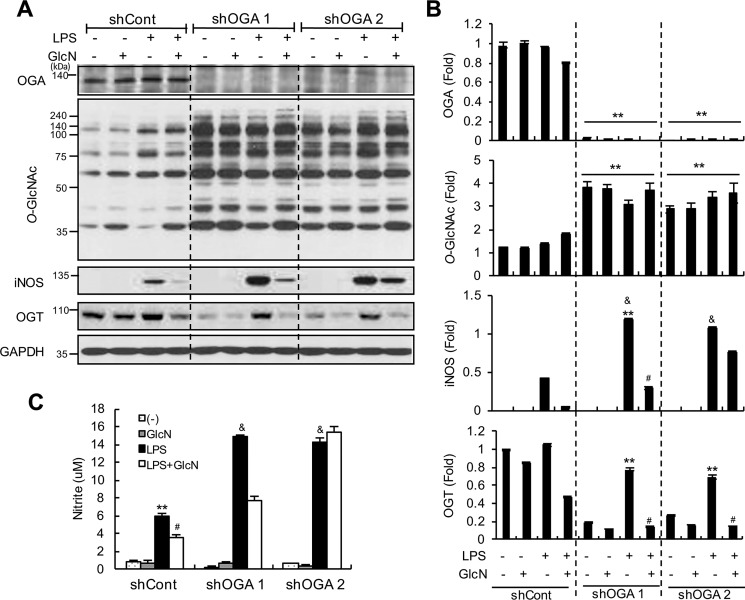
The aim of the current study was to investigate the effects of glucosamine (GlcN) on septic lethality and sepsis-induced inflammation using animal models of mice and zebrafish. GlcN pretreatment improved survival in the cecal ligation and puncture (CLP)-induced sepsis mouse model and attenuated lipopolysaccharide (LPS)-induced septic lung injury and systemic inflammation. GlcN suppressed LPS-induced M1-specific but not M2-specific gene expression. Furthermore, increased expressions of inflammatory genes in visceral tissue of LPS-injected zebrafish were suppressed by GlcN. GlcN suppressed LPS-induced activation of mitogen-activated protein kinase (MAPK) and NF-κB in lung tissue. LPS triggered a reduction in O-GlcNAc levels in nucleocytoplasmic proteins of lung, liver, and spleen after 1 day, which returned to normal levels at day 3. GlcN inhibited LPS-induced O-GlcNAc down-regulation in mouse lung and visceral tissue of zebrafish. Furthermore, the O-GlcNAcase (OGA) level was increased by LPS, which were suppressed by GlcN in mouse and zebrafish. OGA inhibitors suppressed LPS-induced expression of inflammatory genes in RAW264.7 cells and the visceral tissue of zebrafish. Stable knockdown of Oga via short hairpin RNA led to increased inducible nitric oxide synthase (iNOS) expression in response to LPS with or without GlcN in RAW264.7 cells. Overall, our results demonstrate a protective effect of GlcN on sepsis potentially through modulation of O-GlcNAcylation of nucleocytoplasmic proteins.

Keywords: O-GlcNAcylation; glucose metabolism; inflammation; lung injury; sepsis.


Conflict of interest statement

The authors declare that they have no conflicts of interest with the contents of this article

Figures

Figure 1.
Figure 1.
Effects of GlcN on survival and systemic inflammation in septic mice. A, schematic design of the experimental procedure. Mice (n = 10, each group) underwent sham or CLP operation on day 0. At 1 h before surgery, mice were subjected to intraperitoneal injection with GlcN (200 mg/kg) or PBS. B, survival of control and GlcN-treated septic mice was recorded over 12 days. C–F, mice were subjected to intraperitoneal injection with LPS (5 mg/kg body weight) with or without intraperitoneal GlcN (200 mg/kg) pre-treatment. Body weights were measured and plotted every day for 4 days after LPS injection (C). Pulmonary edema formation was measured via determination of the wet-to-dry (W/D) lung weight ratio at 24 h of LPS and/or GlcN injection (D). Levels of nitrite in plasma after 24 h LPS and/or GlcN challenge were measured with the Griess assay (E). Concentrations of TNF-α and IL-6 in plasma at 6 and 24 h of LPS and/or GlcN injection were determined using ELISA (F). All values are presented as mean ± S.E. Asterisks denote significantly increased from untreated control (*, p < 0.05; **, p < 0.01); hash marks indicate significantly decreased from LPS-stimulated conditions (#, p < 0.05; ##, p < 0.01).
Figure 2.
Figure 2.
Effects of GlcN on pulmonary inflammation in LPS-induced septic mice. A, representative histological analysis of lung of control (PBS-injected) and 5 mg/kg of LPS- and/or 200 mg/kg of GlcN-injected mice via H&E staining. Scale bar, 500 μm (upper) and 200 μm (lower). B and C, representative immunofluorescence staining (B) and quantification (C) of lung sections from PBS-, GlcN-, LPS-, and LPS + GlcN-treated mice at 24 h for detection of LY6G (red) and DAPI (blue) signals. Scale bar, 200 μm. D, representative Western blotting of iNOS and densitometric measurement in mice lung tissue at 24 h after LPS- and/or GlcN injection. GAPDH was determined as the loading control. E and F, representative immunohistochemistry (E) and quantification (F) in mice lung tissue at 24 h after LPS- and/or GlcN injection. Scale bar, 200 μm. All values are presented as mean ± S.E. Asterisk denotes significantly increased from the untreated control (p < 0.05); hash mark (#) indicates significantly decreased from LPS-stimulated conditions (p < 0.05).
Figure 3.
Figure 3.
mRNA levels of M1/M2 macrophage markers in bone marrow cells and lung tissue of LPS- and/or GlcN-injected mice. Mice were intraperitoneally injected with GlcN (200 mg/kg) or PBS before LPS (5 mg/kg) injection. At 24 h, total mRNAs were prepared from bone marrow cells (A) and lung tissue (B). Determination of iNos, Il-6, Mcp-1, Tnf-α, Mgl-1, and Mmr mRNA levels using PCR or quantitative real-time PCR. Blots are representative of three independent experiments. All values are mean ± S.E. Asterisks denote significantly increased from the untreated control (*, p < 0.05; **, p < 0.01); hash marks indicate significantly decreased from LPS-stimulated conditions (#, p < 0.05; ##, p < 0.01).
Figure 4.
Figure 4.
Levels of proinflammatory gene transcripts in visceral tissue of LPS- and/or GlcN-injected adult zebrafish. Adult zebrafish were incubated with GlcN (1 g/liter of maintained water) for 12 h before abdominal GlcN (200 μg/g) injection and subsequently stimulated with LPS (100 μg/g). Visceral tissue was separated at 24 h and inos, cox-2, il-1β, il-6, tnf-α, and ifn-γ mRNA levels were determined via PCR or quantitative real-time PCR. Blots are representative of three independent experiments. All values are mean ± S.E. Asterisk denotes significantly increased from the untreated control (p < 0.05); hash mark (#) indicates significantly decreased from LPS-stimulated conditions (p < 0.05).
Figure 5.
Figure 5.
Effects of GlcN on LPS-induced activation of MAPKs, AKT, and IκB. Lung samples were isolated from PBS or LPS (5 mg/kg)- and/or GlcN (200 mg/kg)-injected mice at 24 h. A, whole lung lysates were prepared and immunoblotted with ERK, P38, JNK, AKT, p-ERK, p-P38, p-JNK, and p-AKT antibodies. Relative densitometric intensities for P-ERK, P-JNK1, and P-AKT were quantitatively measured by normalizing to ERK, P38, JNK, and AKT levels, respectively. B and C, representative confocal immunofluorescence staining images of P-IκBα and p-P65 are shown. Nuclei were counterstained with DAPI for visualization in lung tissue (B). Scale bar, 500 μm. Positive staining for p-IκBα and p-P65 was quantitatively assessed (C). D, Western blot analysis of p-IκBα, IκBα, and GAPDH proteins from whole lung lysates. Blots and fluorescent images are representative of three independent experiments. All values are presented as mean ± S.E. Asterisk denotes significantly increased from the untreated control (p < 0.05); hash mark (#) indicates significantly decreased from LPS-stimulated conditions (p < 0.05).
Figure 6.
Figure 6.
Time course histological changes in pulmonary tissue and protein O-GlcNAcylation changes in lung, liver, and spleen in response to LPS. Mice were intraperitoneally injected with PBS or LPS (5 mg/kg). A, lung injury was assessed via H&E staining and histological examination on days 1, 3, and 5. Scale bar, 500 μm. B, total lysates from lung, liver, and spleen were prepared and O-GlcNAcylation analyzed via Western blotting using the anti-O-GlcNAc CTD110.6 antibody. Representative Western blot analysis and quantification in a spectral mode of O-GlcNAcylation are shown. Blots are representative of three independent experiments. All values are mean ± S.E. Asterisks denote significantly decreased from the untreated control (*, p < 0.05; **, p < 0.01); hash mark (#) indicates significantly increased from the untreated control (p < 0.05).
Figure 7.
Figure 7.
Changes in O-GlcNAcylation, OGT, and OGA levels in mouse lung tissue in response to LPS and/or GlcN. A, mice were intraperitoneally injected with LPS (5 mg/kg) and/or GlcN (200 mg/kg), and lungs were isolated at 24 h. Total lysates from lung tissue were subjected to Western blot analysis using CTD110.6 antibody. A representative blot is shown. Relative densitometric intensities of O-GlcNAc, OGA, and OGT were quantitatively measured by normalizing to β-ACTIN levels. B, mice underwent sham (Cont) or CLP operation on day 0. At 1 h before surgery, mice were subjected to intraperitoneal injection with GlcN (200 mg/kg) or PBS. Representative confocal immunofluorescence staining images of O-GlcNAc, OGT, and OGA were shown. Nuclei were counterstained with DAPI for visualization in lung tissue and positive staining for O-GlcNAc, OGT, and OGA (MGEA5) quantitatively measured and graphed. Scale bar, 500 μm. Blots and fluorescent images are representative of three independent experiments. All values are presented as mean ± S.E. Asterisk denotes significantly increased from the untreated control (p < 0.05); hash mark (#) indicates significantly decreased from LPS-stimulated conditions (p < 0.05).
Figure 8.
Figure 8.
Changes in O-GlcNAcylation, OGT, and OGA levels in visceral tissue of zebrafish in response to LPS and/or GlcN. Adult zebrafish were incubated with GlcN (1 g/liter in maintained water) for 12 h before abdominal GlcN (200 μg/g) injection and subsequently stimulated with LPS (100 μg/g). Visceral tissues were separated at 24 h. Representative confocal immunofluorescence staining images of O-GlcNAc, OGT, and OGA are shown. Nuclei were counterstained with DAPI for visualization in tissue and positive staining for O-GlcNAc, OGT, and OGA quantitatively measured and graphed. Fluorescent images are representative of three independent experiments. All values are mean ± S.E. Asterisk denotes significantly increased from the untreated control (p < 0.05); hash mark (#) indicates significantly decreased from LPS-stimulated conditions (p < 0.05). Scale bar, 50 μm.
Figure 9.
Figure 9.
O-GlcNAcylation changes in response to LPS and/or GlcN in RAW264.7 cells and effects of OGA inhibitors on LPS-induced inflammatory gene induction. A, RAW 264.7 cells were pre-treated with GlcN (5 mm) for 2 h, followed by stimulation with LPS (100 ng/ml) for 24 h. Whole cell lysates were prepared and subjected to Western blotting for O-GlcNAcylation using the CTD110.6 antibody (left panel) or galactosyltransferase-labeled using [3H]UDP-galactose as a substrate and exposed to X-ray film for autoradiography (right panel). B, RAW 264.7 cells were pre-treated with PUGNAc (10 or 50 μm) for 2 h and subsequently stimulated with LPS (100 ng/ml) for 24 h. O-GlcNAcylation levels of total cell lysates were measured via Western blotting using the CTD110.6 antibody. The graph represents relative densitometric intensities that were quantitatively measured and normalized to β-ACTIN levels. C, RAW 264.7 cells were stimulated with LPS (100 ng/ml) with or without PUGNAc (0.5 mm) for 24 h. Expression of iNos, Cox-2, and Il-1β mRNA were determined by RT-PCR (left panel) and quantitatively assessed using real-time PCR (right graphs). Gapdh was determined as the loading control. Results are representative of three independent experiments. All values are mean ± S.E. D, adult zebrafish were treated with PUGNAc (50 μg/g) or Thiamet-G (20 μg/g) for 2 h and injected with LPS (100 μg/g). Visceral tissues were isolated at 24 h and mRNA expression of inos, cox-2, il-6, il-1β, ifn-α, ifn-β, ifn-γ, and tnf-α determined using PCR (left panel) and quantitative real-time PCR (right graphs). Results are representative of three independent experiments. All values are mean ± S.E. Asterisk denotes significantly increased from the untreated control (p < 0.05); hash mark (#) indicates significantly decreased from LPS-stimulated conditions (p < 0.05).
Figure 10.
Figure 10.
Effect of Oga knockdown on LPS-mediated iNOS/NO induction. Oga knockdown cells were generated via stable transfection of shCont, shOga1, and shOga2. Control and Oga knockdown cells were stimulated with LPS (100 ng/ml) with or without 5 mm GlcN for 24 h. Whole cell lysates were prepared and the expression levels of OGA, O-GlcNAc, iNOS, and OGT were measured via Western blotting using anti-MGEA5, CTD110.6, anti-iNOS, and anti-OGT antibodies, respectively (A). Relative densitometric intensities were quantitatively measured and normalized to GAPDH levels (B). Nitrite levels in cell culture medium were measured with the Griess assay (C). Blots are representative of three independent experiments. All values are presented as mean ± S.E. Asterisks denote significantly increased from the untreated control (*, p < 0.05; **, p < 0.01); hash mark (#) indicates significantly decreased from LPS-stimulated conditions (p < 0.05); &, indicates significantly increased from shCont LPS-stimulated conditions (p < 0.05).

References

    1. Fleischmann C., Scherag A., Adhikari N. K., Hartog C. S., Tsaganos T., Schlattmann P., Angus D. C., Reinhart K., and International Forum of Acute Care Trialists (2016) Assessment of global incidence and mortality of hospital-treated sepsis: current estimates and limitations. Am. J. Respir. Crit. Care Med. 193, 259–272 10.1164/rccm.201504-0781OC - DOI - PubMed
    1. Hasan Z., Palani K., Rahman M., and Thorlacius H. (2011) Targeting CD44 expressed on neutrophils inhibits lung damage in abdominal sepsis. Shock 35, 567–572 10.1097/SHK.0b013e3182144935 - DOI - PubMed
    1. Rubenfeld G. D., Caldwell E., Peabody E., Weaver J., Martin D. P., Neff M., Stern E. J., and Hudson L. D. (2005) Incidence and outcomes of acute lung injury. N. Engl. J. Med. 353, 1685–1693 10.1056/NEJMoa050333 - DOI - PubMed
    1. Kolaczkowska E., and Kubes P. (2013) Neutrophil recruitment and function in health and inflammation. Nat. Rev. Immunol. 13, 159–175 10.1038/nri3399 - DOI - PubMed
    1. Kabir K., Gelinas J. P., Chen M., Chen D., Zhang D., Luo X., Yang J. H., Carter D., and Rabinovici R. (2002) Characterization of a murine model of endotoxin-induced acute lung injury. Shock 17, 300–303 10.1097/00024382-200204000-00010 - DOI - PubMed

Publication types