. 2019 Jan 11;294(2):644-661.
doi: 10.1074/jbc.RA118.005801. Epub 2018 Nov 19.

Physiological and pathophysiological characteristics of ataxin-3 isoforms

Affiliations

Physiological and pathophysiological characteristics of ataxin-3 isoforms

Daniel Weishäupl et al. J Biol Chem. .

Abstract

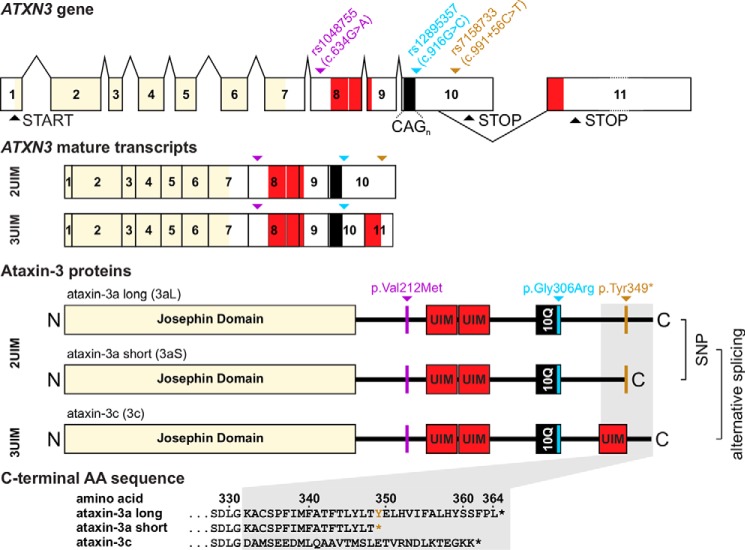
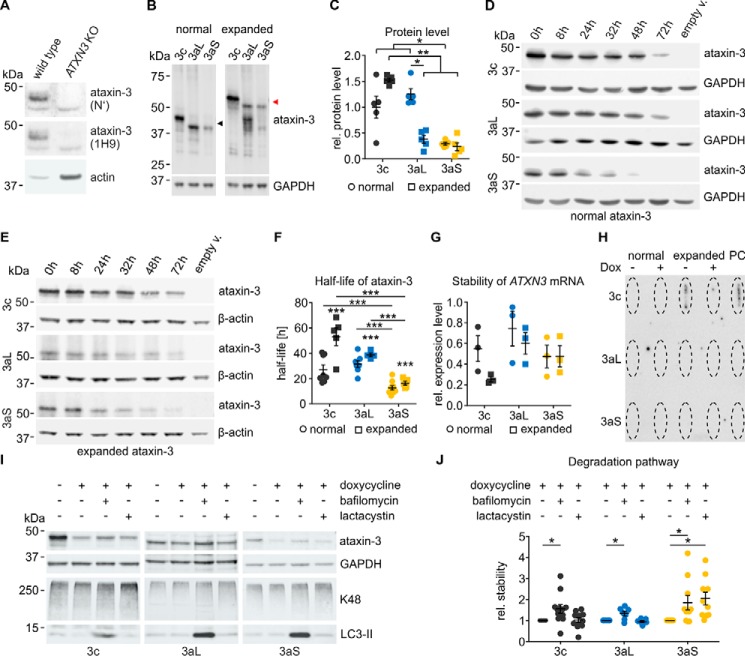
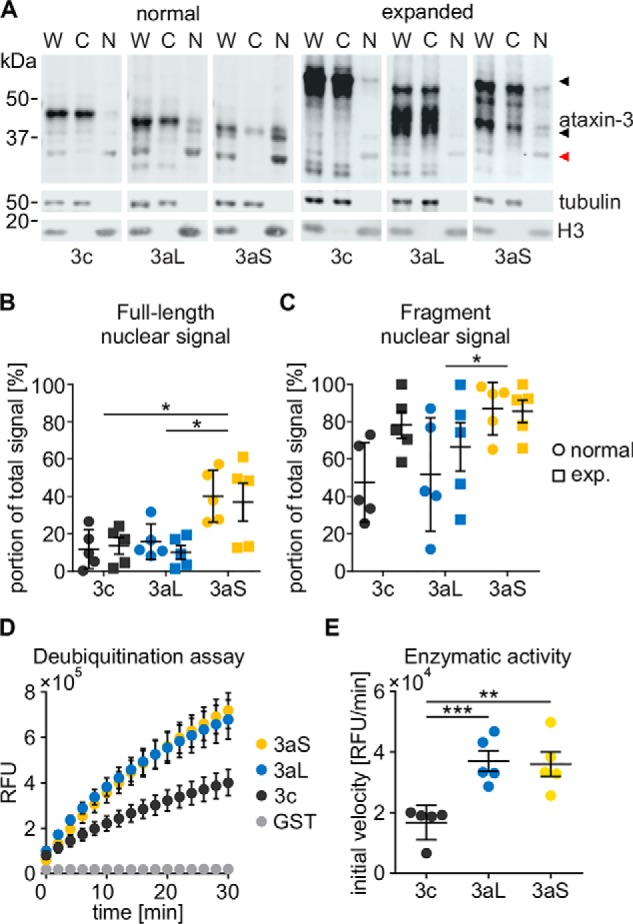
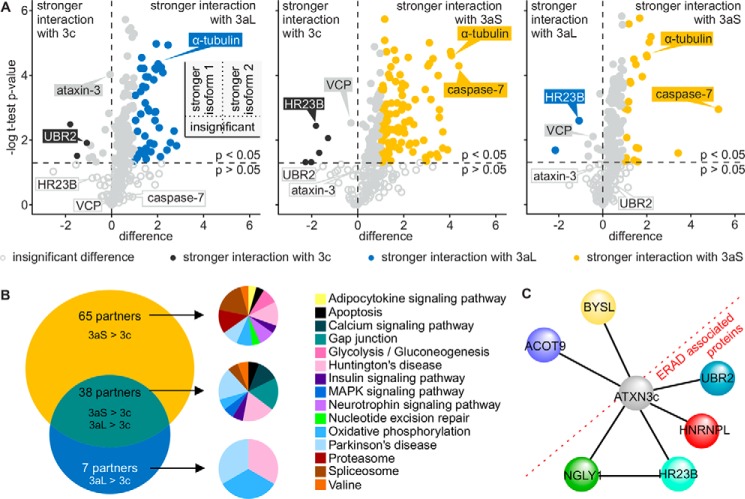
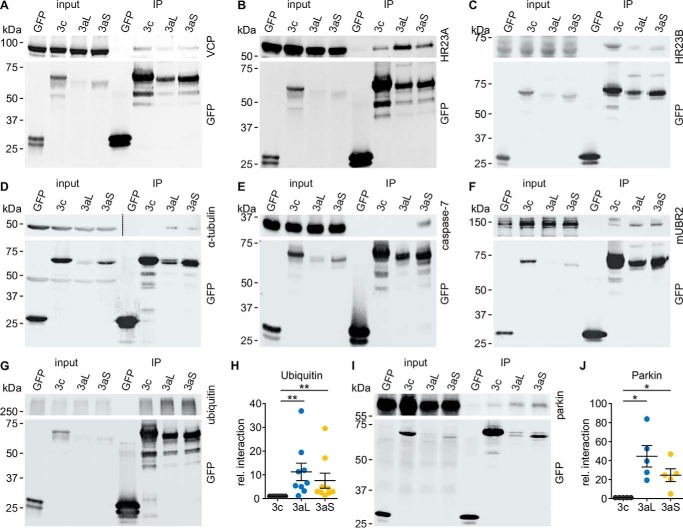
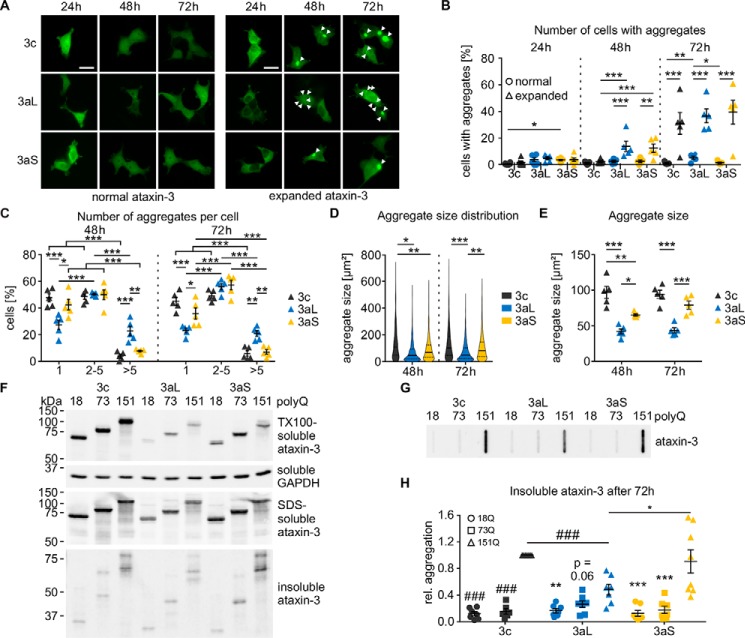
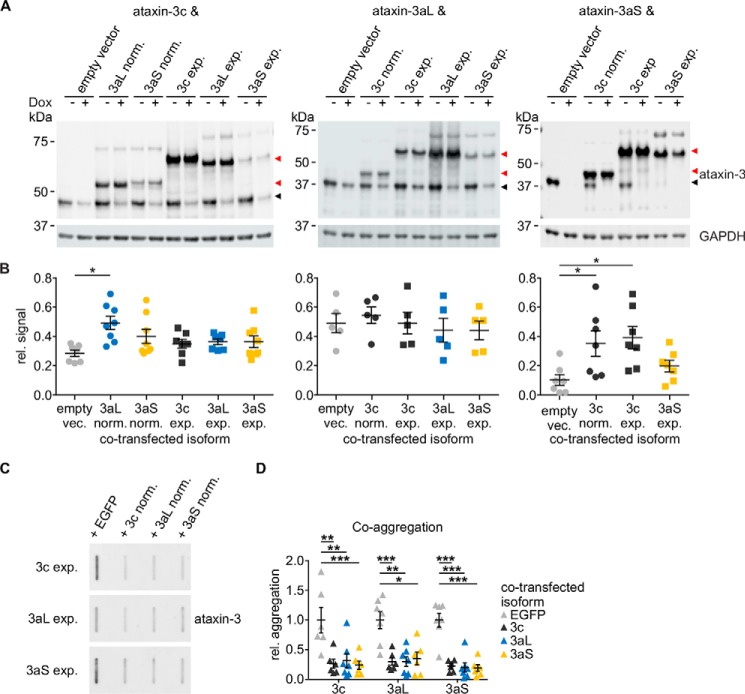
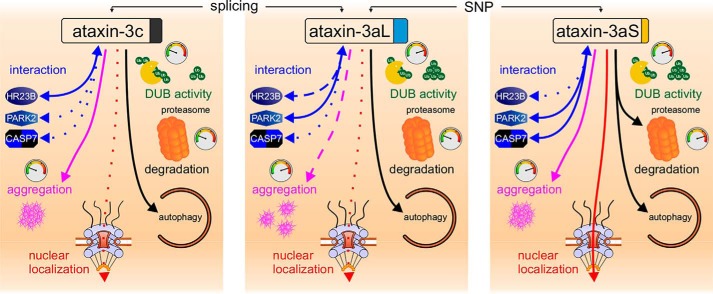
Ataxin-3 is a deubiquitinating enzyme and the affected protein in the neurodegenerative disorder Machado-Joseph disease (MJD). The ATXN3 gene is alternatively spliced, resulting in protein isoforms that differ in the number of ubiquitin-interacting motifs. Additionally, nonsynonymous SNPs in ATXN3 cause amino acid changes in ataxin-3, and one of these polymorphisms introduces a premature stop codon in one isoform. Here, we examined the effects of different ataxin-3 isoforms and of the premature stop codon on ataxin-3's physiological function and on main disease mechanisms. At the physiological level, we show that alternative splicing and the premature stop codon alter ataxin-3 stability and that ataxin-3 isoforms differ in their enzymatic deubiquitination activity, subcellular distribution, and interaction with other proteins. At the pathological level, we found that the expansion of the polyglutamine repeat leads to a stabilization of ataxin-3 and that ataxin-3 isoforms differ in their aggregation properties. Interestingly, we observed a functional interaction between normal and polyglutamine-expanded ATXN3 allelic variants. We found that interactions between different ATXN3 allelic variants modify the physiological and pathophysiological properties of ataxin-3. Our findings indicate that alternative splicing and interactions between different ataxin-3 isoforms affect not only major aspects of ataxin-3 function but also MJD pathogenesis. Our results stress the importance of considering isoforms of disease-causing proteins and their interplay with the normal allelic variant as disease modifiers in MJD and autosomal-dominantly inherited diseases in general.

Keywords: E3 ubiquitin ligase; alternative splicing; deubiquitylation (deubiquitination); enzyme degradation; enzyme kinetics; genetic polymorphism; neurodegenerative disease; polyglutamine disease; protein aggregation; proteomics.


Conflict of interest statement

The authors declare that they have no conflicts of interest with the contents of this article

Figures

Figure 1.
Figure 1.
The ATXN3/MJD1 gene consists of 11 exons with an alternative splice site in exon 10. Two full-length isoforms were described for ataxin-3 called ataxin-3a (3a, UniProt ID P54252-1) and ataxin-3c (3c, UniProt ID P54252-2), which differ in the third UIM at the C terminus of ataxin-3c encoded by exon 11. ATXN3 is modified by different SNPs; rs1048755 (purple) in exon 8 leads to the missense mutation p.Val212Met N-terminal of UIM1. The SNP rs12895357 (blue) in exon 10 leads to the exchange of p.Gly306Arg directly C-terminal of the polyQ repeat. Last, rs7158733 (ochre) 3′ of the CAG-repeat in exon 10 leads to the nonsense variant p.Tyr349*, which causes a premature stop codon in this isoform and therefore generates two isoforms: ataxin-3a long (3aL, Tyr variant) and ataxin-3a short (3aS, premature stop variant) lacking 16 amino acids at the C terminus. Therefore, three isoforms of ataxin-3 exist, which differ in their C-terminal amino acid sequence and are created by alternative splicing and the stop codon.
Figure 2.
Figure 2.
A, HEK 293T ATXN3 KO cells were generated using TALENs targeting exon 2 of the ATXN3 gene. The successful KO of ataxin-3 was validated on the protein level by Western blotting using two different ataxin-3 antibodies flanking the genomic frameshift region (N′, ARP50507; 1H9, MAB5360). Whereas the original HEK 293T cells (WT) express ataxin-3, it was no longer detected in the ATXN3 KO cells. B and C, Western blot analysis of ataxin-3 isoforms. ATXN3 KO cells were transfected with untagged pTRE ataxin-3 isoforms for 48 h (18Q (black arrowhead)/73Q (red arrowhead)). Immunodetection revealed that normal ataxin-3aS shows a lower protein level than ataxin-3c and ataxin-3aL. Upon a pathological polyQ expansion, ataxin-3aS and ataxin-3aL show weaker signals than ataxin-3c. The polyQ expansion of ataxin-3aL leads to a reduction of its protein level. Scheirer–Ray–Hare test with Conover–Iman and Wilcoxon–Mann–Whitney post hoc tests, adjusted by the Hommel method, were used: *, p < 0.05; **, p < 0.01, n = 5. D and E, the stability of ataxin-3 isoforms was analyzed using the Tet-off system. The expression of ataxin-3 (18Q/73Q) in transfected HEK 293T ATXN3 KO cells was abolished using doxycycline at the indicated time points. F, ataxin-3aS shows a significantly lower half-life than ataxin-3c or ataxin-3aL independent of the polyQ expansion. A polyQ expansion leads to an increase in half-life of all ataxin-3 isoforms. The half-life was calculated for first-order kinetics. One-way ANOVA with Tukey's HSD test was used: ***, p < 0.001, n = 5–9. G, analysis of ATXN3 mRNA stability. Quantitative RT-PCR was performed after expression of pTRE ataxin-3 isoforms (18Q/73Q) in HEK 293 ATXN3 KO cells. No differences in the stability of the mRNA were found 8 h after expression termination by doxycycline (n = 3). The Scheirer–Ray–Hare test was used: isoform, polyQ, and interaction insignificant, n = 3. H, analysis of ataxin-3 solubility. Untagged ataxin-3 isoforms (18Q/73Q) were expressed for 24 h, and expression was afterwards terminated by doxycycline for 32 h. A filter retardation assay for insoluble protein showed that ataxin-3 isoforms do not differ in solubility after 24 h of expression. PC, positive control. I, differences in the stability of non-polyQ–expanded ataxin-3 isoforms arise from different degradation pathways. pTRE-ataxin-3–transfected cells were cultured for 24 h. Expression was terminated 8 h before cells were treated with bafilomycin A1 (50 nm) or lactacystin (10 μm) for 24 h. Western blots were stained for ataxin-3 (1H9), GAPDH, Lys-48–linked ubiquitin (K48), and LC3 (LC3-II). The Lys-48 staining confirmed the inhibition of the proteasome system, whereas the increase in LC3-II confirmed the autophagy inhibition. J, an inhibition of autophagy by a bafilomycin A1 treatment led to a preservation of ataxin-3 for all isoforms. Ataxin-3aS degradation was additionally inhibited after the lactacystin treatment, indicating that this isoform is additionally degraded by the proteasome (one-tailed Wilcoxon signed rank test, Hommel-corrected; *, p < 0.05; n = 6–12). Data are represented as arithmetic mean ± S.E. (error bars).
Figure 3.
Figure 3.
A, subcellular distribution of ataxin-3 isoforms (18Q/73Q). ATXN3 KO cells were transfected with untagged pTRE-ataxin-3 isoforms and the RCA2 promoter construct. After 48 h, cells were harvested and fractionated, generating whole-cell (W), cytoplasmic (C), and nuclear (N) fractions. Ataxin-3 was detected using the antibody 1H9. Tubulin was detected as a cytoplasmic marker, and H3 was detected as a nuclear marker. Full-length ataxin-3 (black arrowhead) as well as ataxin-3 fragments (red arrowhead) could be detected. B and C, quantification of nuclear signals for full-length ataxin-3 isoforms and an N-terminal fragment. Full-length ataxin-3 shows an increased nuclear localization independent of the polyQ expansion (two-way ANOVA; *, p < 0.05). The fragment of ataxin-3aS also shows a stronger nuclear localization than that of ataxin-3aL (two-way ANOVA with Tukey's HSD test; *, p < 0.05, n = 5). D, deubiquitination assay of non-polyQ–expanded ataxin-3 isoforms. GST-ataxin-3 was purified from E. coli and mixed in a 1:5 ratio with ubiquitin-rhodamine-110. Relative fluorescence was measured every 10 s and is displayed for every 2 min. E, calculation of the initial velocity revealed that ataxin-3c shows a significantly reduced activity compared with ataxin-3aL and ataxin-3aS (Kruskal–Wallis test with Conover–Iman post hoc test with Hommel adjustment; **, p < 0.01; ***, p < 0.001; n = 5). Data are represented as arithmetic mean ± S.E. (error bars). RFU, relative fluorescence units.
Figure 4.
Figure 4.
A, volcano plots comparing the interaction of normal ataxin-3 isoforms. HEK 293T cells were transfected with pN-SF-TAP-ataxin-3 isoforms and grown in SILAC medium for 72 h. Ataxin-3 was purified by the Strep-tag. Isoform-specific purifications were combined afterward and concentrated by precipitation before the identification of co-precipitated proteins by MS. Volcano plots show a direct comparison between the p value of interactors of two isoforms (ataxin-3c versus 3aL, ataxin-3c versus 3aS, and ataxin-3aL versus 3aS) and the difference between the isoforms. The plots are divided into four quadrants (small scheme). The bottom two show interactors with insignificant differences (light gray open circle, p > 0.05); the top ones show interactors that interact significantly more strongly with one isoform, depending on the side. Although significant, interactors with p < 0.05 were only considered stronger or weaker upon a difference of at least ±1. Although sharing numerous interactions (light gray open and filled circles), ataxin-3 isoforms show divergent interactions with different proteins. Partners interacting more strongly with ataxin-3c (black filled circles), ataxin-3aL (blue filled circles), and ataxin-3aS (yellow filled circles) could be identified. Ataxin-3c and ataxin-3a show more differences in their interaction than ataxin-3aL and ataxin-3aS. B, Venn diagram comparing proteins that interact more strongly with ataxin-3aL and ataxin-3aS compared with ataxin-3c. 65 interaction partners interact more strongly with ataxin-3aS than ataxin-3c. 38 partners have a stronger interaction with both ataxin-3aS and ataxin-3aL, whereas seven partners have a stronger interaction with ataxin-3aL. A GO annotation of these proteins and analysis of KEGG pathways revealed that these interactors take part in different pathways, whereas proteins associated with Huntington's disease and Parkinson's disease can be found in all three groups. C, interaction network for proteins showing a stronger binding to ataxin-3c. Ataxin-3c shows a common interaction with HR23B and NGLY1 as well as UBR2 and HNRNPL, specifying its role in the ERAD pathway of glycosylated proteins.
Figure 5.
Figure 5.
A–F, results from SILAC-MS-MS were validated by performing pulldown assays for selected interaction partners. HEK 293T ATXN3 KO cells were transfected with non-polyQ–expanded pEGFP-C2-ataxin-3 isoforms. In the case of HR23A, HR23B (both V5)- and mUBR2 (FLAG)-tagged constructs with the interaction partner were co-expressed. Cells were harvested 48 h post-transfection, and samples were processed for a GFP-trap interaction assay followed by Western blot analysis. Input as well as immunoprecipitation (IP) was loaded onto the same gel. An interaction could be confirmed for all tested interaction partners. A, VCP; B, HR23A (V5 antibody); C, HR23B (V5 antibody); D, α-tubulin; E, caspase-7; F, mUBR2 (FLAG-antibody). The blot of the top panel of D was split into two different intensities (dashed line) to show input and IP. This panel also shows a redetection of tubulin in the GFP detection. G and H, GFP-trap interaction assay for ataxin-3 isoforms and high-molecular weight ubiquitinated proteins. Western blotting signal was normalized to ataxin-3c. The GFP-trap assay for ubiquitinated proteins shows a stronger interaction of high-molecular weight ubiquitin for ataxin-3aL and ataxin-3aS compared with ataxin-3c, indicating that ataxin-3c is binding lower amounts of ubiquitinated proteins (Wilcoxon signed rank test, Hommel-adjusted; *, p < 0.05, n = 9). I and J, GFP-trap interaction assay for ataxin-3 isoforms and parkin. Western blotting signal was normalized to ataxin-3c. Ataxin-3aL and ataxin-3aS interact significantly more strongly with parkin than ataxin-3c (one-sample t test, Hommel-adjusted; *, p < 0.05, n = 5). Data are represented as arithmetic mean ± S.E. (error bars).
Figure 6.
Figure 6.
A, microscopic analysis of ataxin-3 aggregation. HEK 293T ATXN3 KO cells were transfected with pEGFP-C2-ataxin-3 isoforms with either normal (18Q) or expanded (151Q) polyQ. Cells were fixed at the respective time points, and the relative number of cells with aggregates was counted. Representative pictures are shown; aggregates are marked with arrowheads; bar, 100 μm. B, quantification of number of cells with aggregates. First differences could be observed 48 h post-transfection. Ataxin-3c with 151Q shows fewer cells with aggregates than both 3a isoforms. The expanded 3a isoform shows significantly more aggregates than the nonexpanded one. After 72 h, all expanded isoforms show a stronger aggregation than the nonexpanded ones (β-regression with estimated marginal means contrasts for each time point, n = 5; *, p < 0.05; **, p < 0.01; ***, p < 0.001). C, the number of aggregates per cell was counted and compared between 151Q ataxin-3 isoforms. Ataxin-3aL shows fewer cells with one aggregate, whereas the number of cells with more than five aggregates is increased (two-way ANOVA with estimated marginal means contrasts; *, p < 0.05; **, p < 0.01; ***, p < 0.001, n = 5). D, analysis of the aggregate size. The aggregate size distribution of ataxin-3c differs from that of 3aL and 3aS 48 h post-transfection. 72 h post-transfection, the size distributions of ataxin-3aS and -3c aggregates differ from 3aL. At both time points, ataxin-3aL produces more small aggregates than ataxin-3c and ataxin-3aS (Kolmogorov–Smirnoff test with Hommel adjustment for multiple comparison; *, p < 0.05; **, p < 0.01; ***, p < 0.001, n = 5). Quartiles are indicated as solid (50%) and dashed lines (25 and 75%). E, comparing the median aggregate sizes of five different experiments, it could be found that ataxin-3aL aggregates are smaller than aggregates from ataxin-3c and ataxin-3aS both at 48 and 72 h. At 48 h, ataxin-3aS aggregates were smaller than aggregates formed by ataxin-3c (two-way ANOVA with Tukey's HSD test; *, p < 0.05; **, p < 0.01; ***, p < 0.001, n = 5). F, solubility analysis of ataxin-3 isoforms. EGFP-C2-ataxin-3 isoforms were expressed for 72 h. Samples were then fractionated into soluble, SDS-soluble, and SDS-insoluble fractions. 18Q and 73Q ataxin-3 were only present in the soluble and SDS-soluble fractions, whereas 151Q ataxin-3 also showed full-length signals in the insoluble fraction. Fragments of all three polyQ expansions were mainly detectable in the SDS-soluble and SDS-insoluble fractions. For technical reasons, it was not possible to specify a loading control in the insoluble fractions. However, we expect that equal protein amounts were loaded onto the gel, as the soluble fraction shows a homogeneous loading. G and H, filter retardation assay of pEGFP-C2-ataxin-3 isoforms 72 h post-transfection. Equal amounts were loaded onto the membrane. 151Q ataxin-3 isoforms show a strong formation of SDS-insoluble aggregates. Quantification revealed lower amounts of aggregates for 151Q ataxin-3aL than for ataxin-3c and ataxin-3aS (one-sample t test (###, p < 0.001) and two-sample t test (*, p < 0.05); p values were Hommel-corrected for multiple comparisons, n = 7–8). Nonexpanded as well as expanded ataxin-3 show lower amounts of aggregates compared with highly expanded ataxin-3 of the same isoform (one-sample t test (###, p < 0.001; p values were Hommel-corrected) and one-way ANOVA with Tukey's HSD test (**, p < 0.01; ***, p < 0.001, n = 6–8)). Data are represented as arithmetic mean ± S.E. (error bars).
Figure 7.
Figure 7.
A, HEK 293T ATXN3 KO cells were transfected with nonexpanded 18Q pTRE-ataxin-3 isoforms (black arrowhead) as well as either a constitutively expressing empty vector or ataxin-3 isoform (red arrowhead; nonexpanded 18Q and expanded 65Q/73Q) in combinations that are present in MJD patients. Ataxin-3 expression was abolished using doxycycline 24 h post-transfection for 32 h. Samples were analyzed by Western blotting stained for ataxin-3 (1H9) and GAPDH. For technical reasons, ataxin-3c was co-expressed with a pN-SF-TAP empty vector and isoforms, whereas ataxin-3aL and -3aS were co-expressed with a pcDNA-FLAG-V5 vector. B, quantification of the relative stability under co-expression conditions. Relative ataxin-3 signals (black arrowhead) were quantified for either ataxin-3c, -3aL, or -3aS alone or under a co-expression with another isoform (red arrowhead). Ataxin-3c is slightly stabilized under co-expression of nonexpanded ataxin-3aL compared with an empty vector control. A similar effect could be observed for ataxin-3aS under co-expression with nonexpanded as well as expanded ataxin-3c (one-way ANOVA with Dunnett's test; *, p < 0.05, n = 5–8). The stability of isoform ataxin-3aL is not influenced by the presence of other isoforms. C and D, filter retardation assay of the co-expression of expanded pEGFP-C2-ataxin-3 isoforms. Isoforms were expressed with an empty EGFP vector or with another nonexpanded EGFP-C2-ataxin-3 isoform for 72 h. Samples were analyzed by a filter retardation assay and stained for ataxin-3 (1H9). A co-transfection with nonexpanded ataxin-3 reduces the amount of insoluble ataxin-3 aggregates independent of the expanded isoform as well as of the nonexpanded isoform (one-sample t test with Hommel correction; *, p < 0.05; **, p < 0.01; ***, p < 0.001, n = 6–7). Data are represented as arithmetic mean ± S.E. (error bars).
Figure 8.
Figure 8.
Ataxin-3 isoforms show differences on physiological as well as pathophysiological levels. We found that ataxin-3 isoforms have a different stability and degradation pathway as well as a differing enzymatic activity. Moreover, they show differences in their interaction networks. On the pathophysiological level, isoforms show differences in their aggregation kinetics, number of aggregates per cell, and aggregate size. The line type shows effect strength or amount, and the tachometer is an indicator of the kinetics (10 o'clock/green, slow; 12 o'clock/yellow, moderate; 2 o'clock/red, fast).

Similar articles

Cited by

References

    1. Costa, Mdo C., and Paulson H. L. (2012) Toward understanding Machado–Joseph Disease. Prog. Neurobiol. 97, 239–257 10.1016/j.pneurobio.2011.11.006 - DOI - PMC - PubMed
    1. Paulson H. L., Das S. S., Crino P. B., Perez M. K., Patel S. C., Gotsdiner D., Fischbeck K. H., and Pittman R. N. (1997) Machado–Joseph disease gene product is a cytoplasmic protein widely expressed in brain. Ann. Neurol. 41, 453–462 10.1002/ana.410410408 - DOI - PubMed
    1. Trottier Y., Cancel G., An-Gourfinkel I., Lutz Y., Weber C., Brice A., Hirsch E., and Mandel J. L. (1998) Heterogeneous intracellular localization and expression of ataxin-3. Neurobiol. Dis. 5, 335–347 10.1006/nbdi.1998.0208 - DOI - PubMed
    1. Schmidt T., Landwehrmeyer G. B., Schmitt I., Trottier Y., Auburger G., Laccone F., Klockgether T., Völpel M., Epplen J. T., Schöls L., and Riess O. (1998) An isoform of ataxin-3 accumulates in the nucleus of neuronal cells in affected brain regions of SCA3 patients. Brain Pathol. 8, 669–679 10.1111/j.1750-3639.1998.tb00193.x - DOI - PMC - PubMed
    1. Ichikawa Y., Goto J., Hattori M., Toyoda A., Ishii K., Jeong S. Y., Hashida H., Masuda N., Ogata K., Kasai F., Hirai M., Maciel P., Rouleau G. A., Sakaki Y., and Kanazawa I. (2001) The genomic structure and expression of MJD, the Machado–Joseph disease gene. J. Hum. Genet. 46, 413–422 10.1007/s100380170060 - DOI - PubMed

Publication types

MeSH terms