. 2018 Dec;564(7734):119-124.
doi: 10.1038/s41586-018-0709-7. Epub 2018 Nov 19.

VCAM-1+ macrophages guide the homing of HSPCs to a vascular niche

Affiliations

VCAM-1+ macrophages guide the homing of HSPCs to a vascular niche

Dantong Li et al. Nature. 2018 Dec.

Abstract

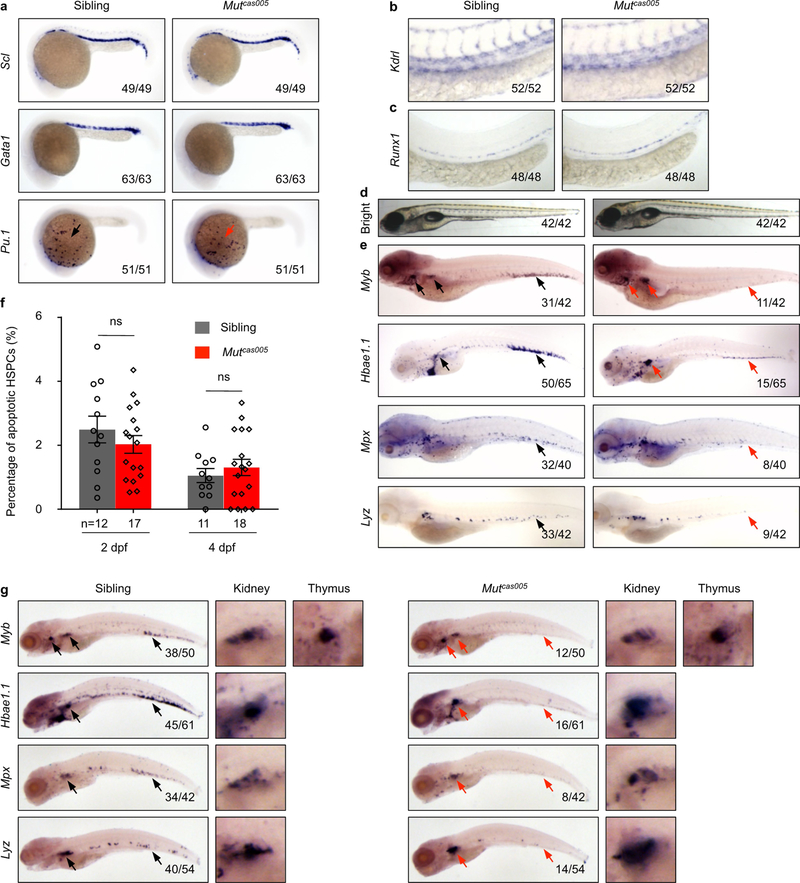
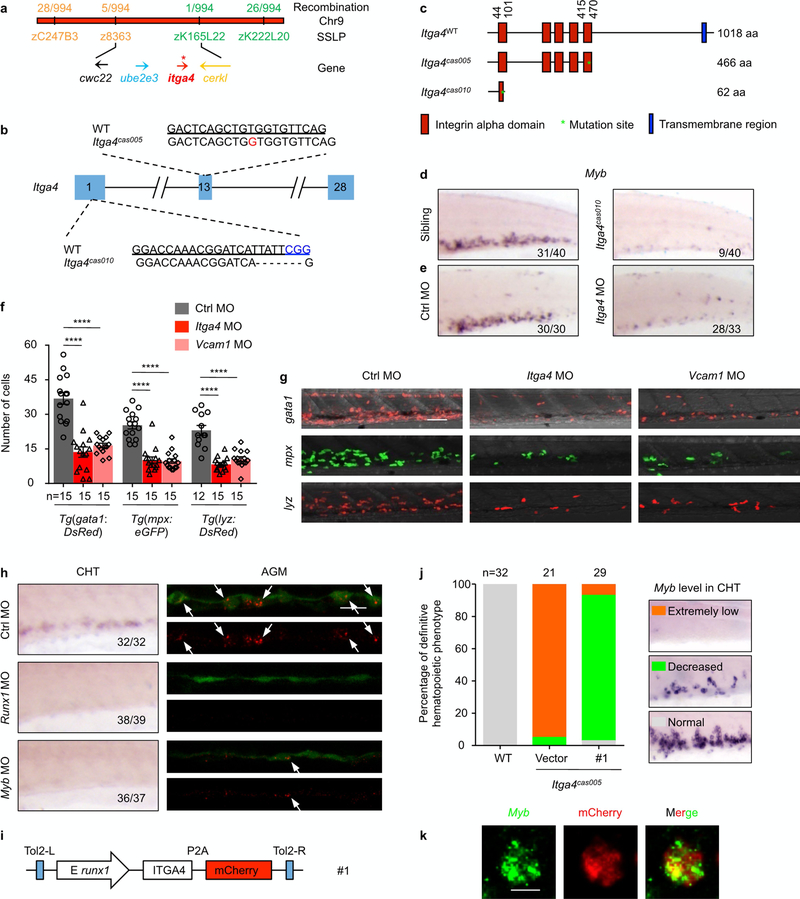
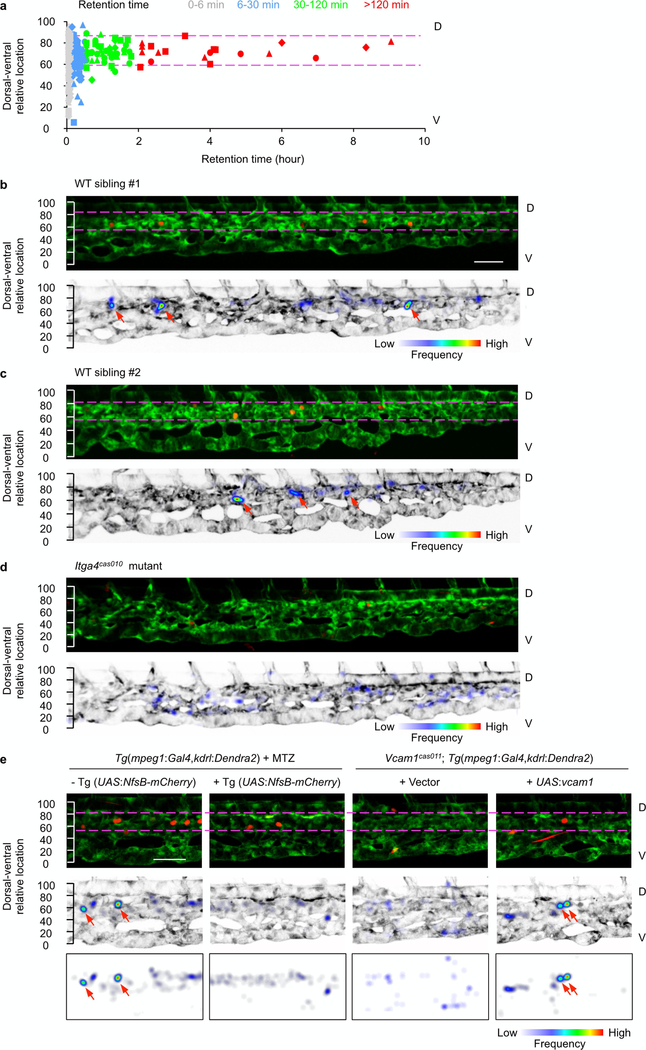
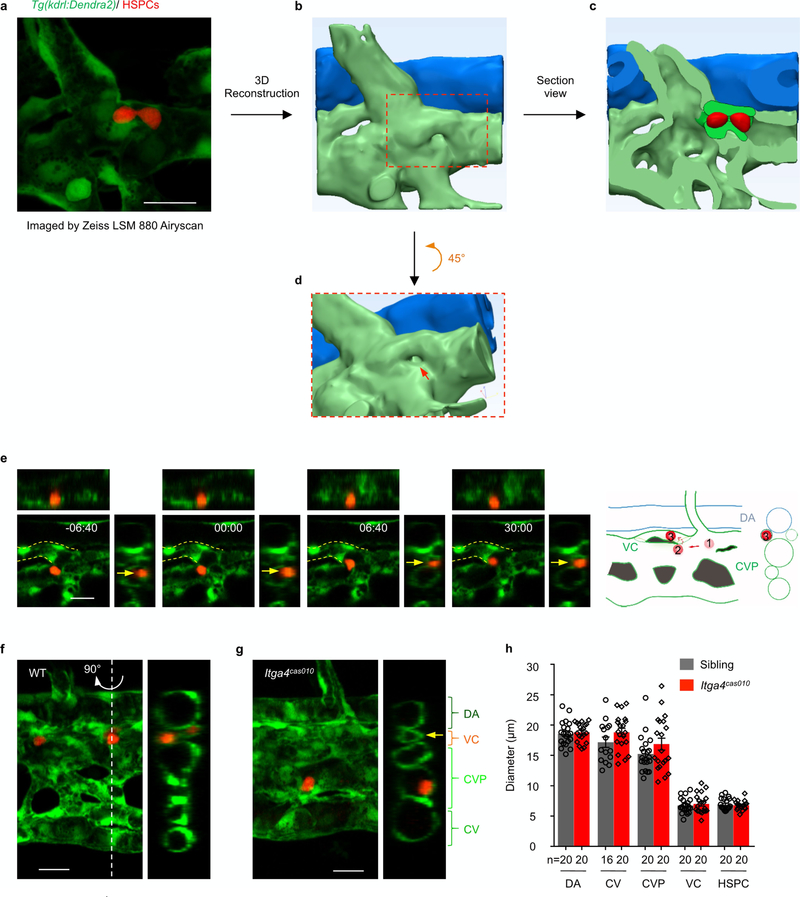
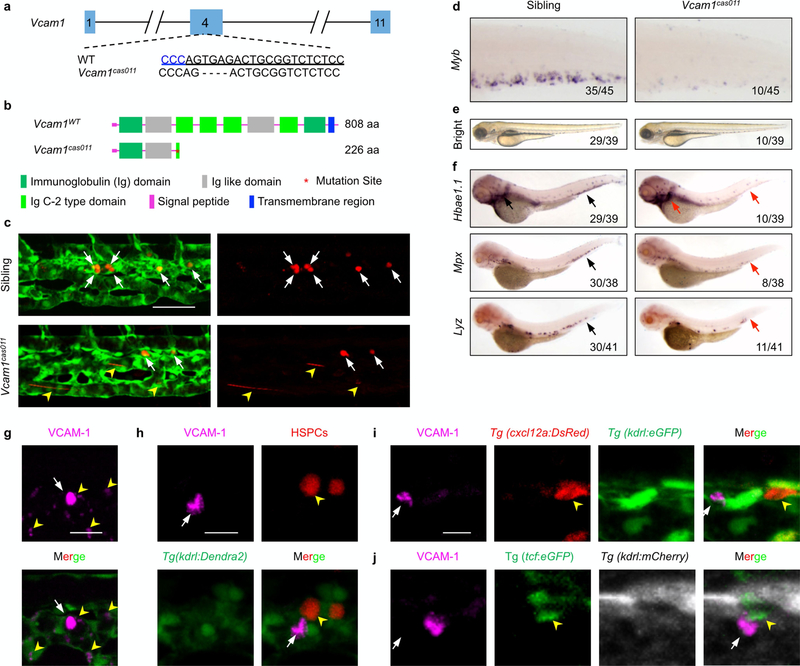
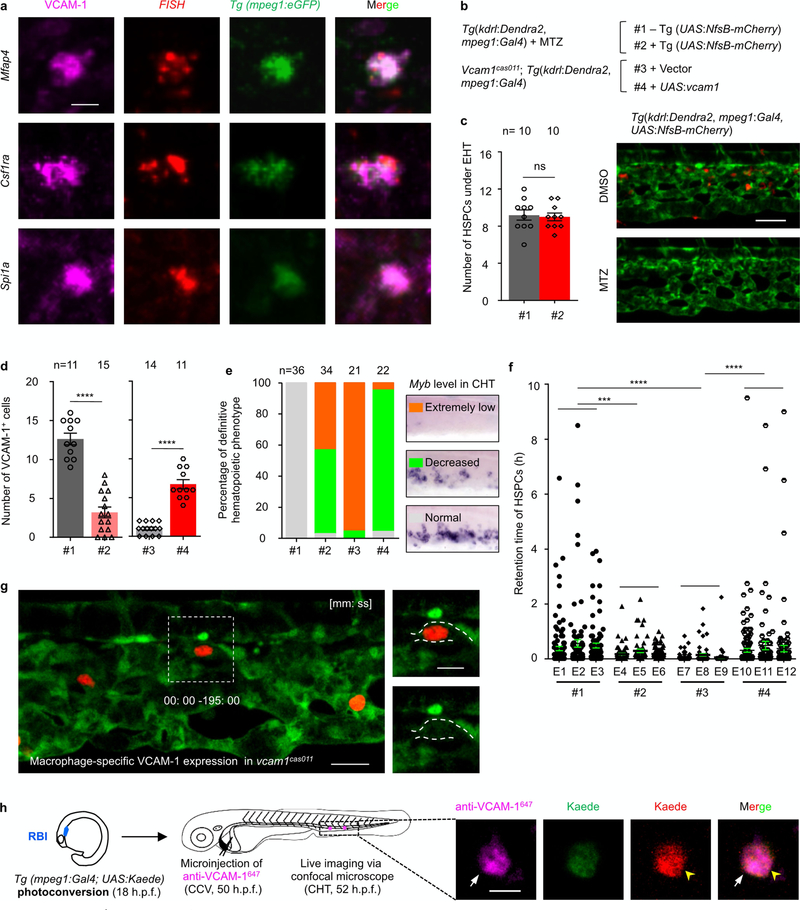
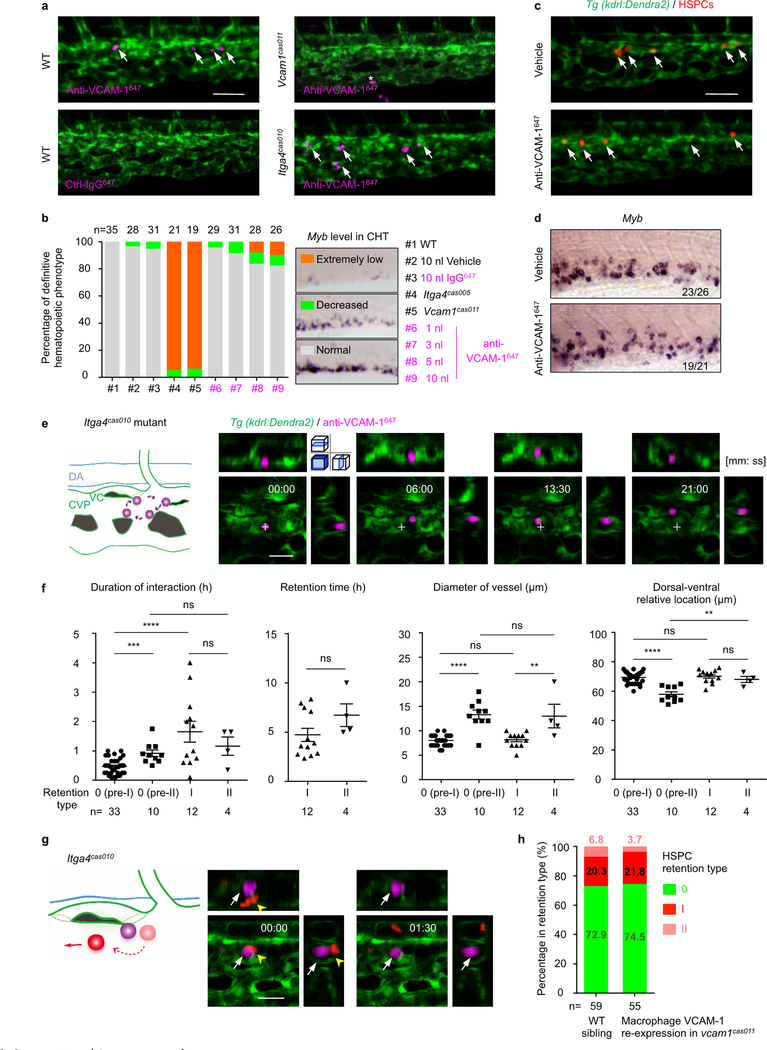
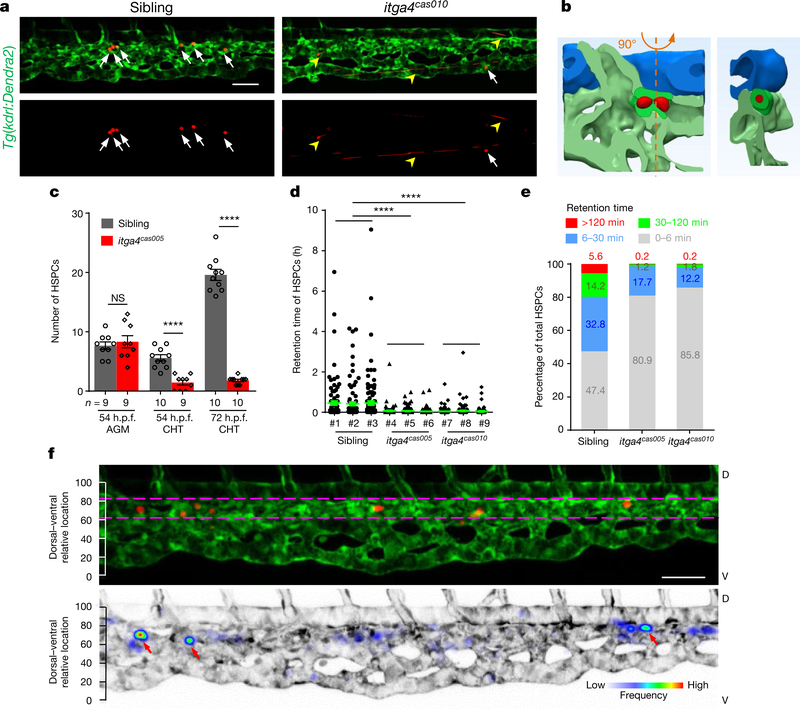
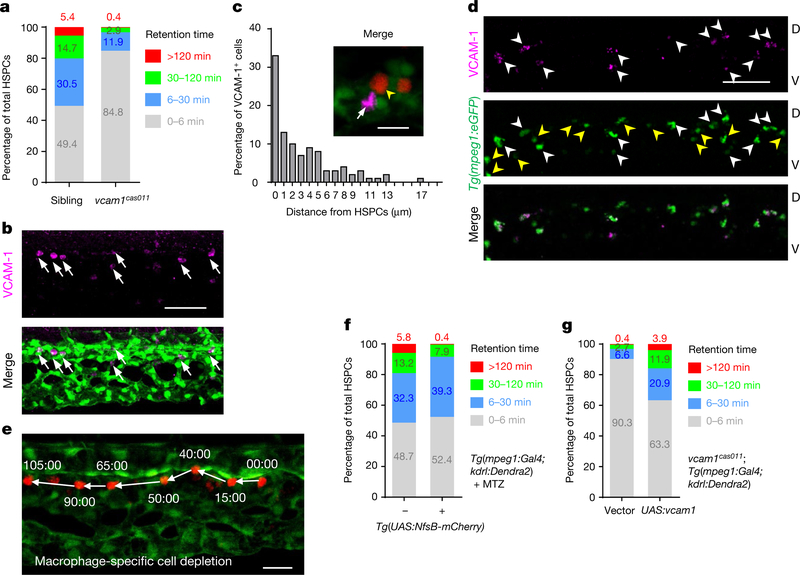
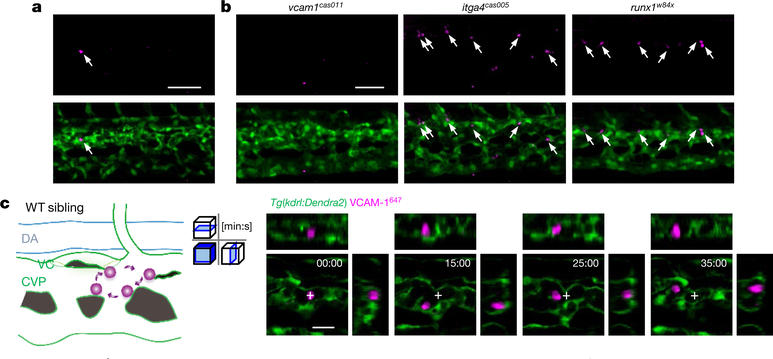
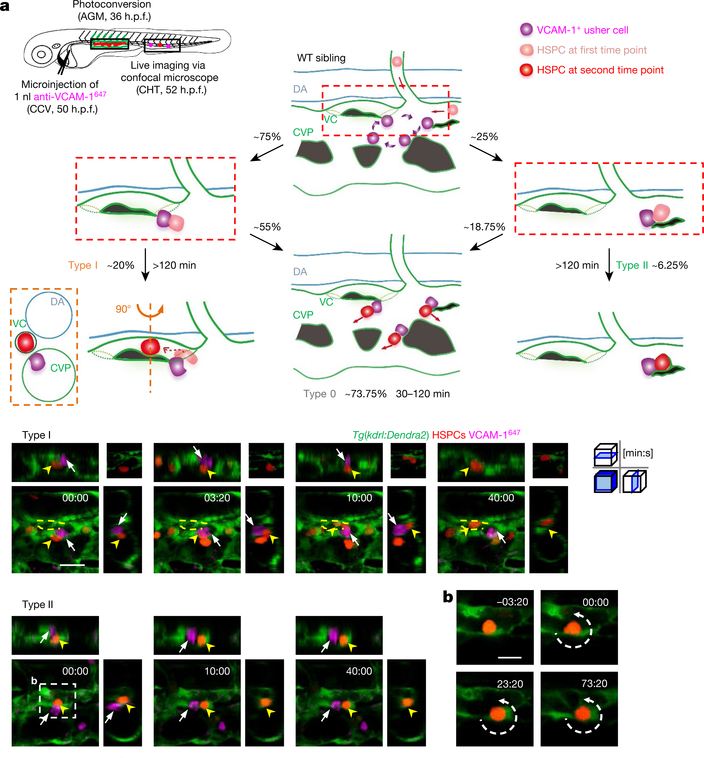
Haematopoietic stem and progenitor cells (HSPCs) give rise to all blood lineages that support the entire lifespan of vertebrates1. After HSPCs emerge from endothelial cells within the developing dorsal aorta, homing allows the nascent cells to anchor in their niches for further expansion and differentiation2-5. Unique niche microenvironments, composed of various blood vessels as units of microcirculation and other niche components such as stromal cells, regulate this process6-9. However, the detailed architecture of the microenvironment and the mechanism for the regulation of HSPC homing remain unclear. Here, using advanced live imaging and a cell-labelling system, we perform high-resolution analyses of the HSPC homing in caudal haematopoietic tissue of zebrafish (equivalent to the fetal liver in mammals), and reveal the role of the vascular architecture in the regulation of HSPC retention. We identify a VCAM-1+ macrophage-like niche cell population that patrols the inner surface of the venous plexus, interacts with HSPCs in an ITGA4-dependent manner, and directs HSPC retention. These cells, named 'usher cells', together with caudal venous capillaries and plexus, define retention hotspots within the homing microenvironment. Thus, the study provides insights into the mechanism of HSPC homing and reveals the essential role of a VCAM-1+ macrophage population with patrolling behaviour in HSPC retention.


Conflict of interest statement

Competing interests The authors declare no competing interests.

Figures

Extended Data Fig. 1 |
Extended Data Fig. 1 |. Phenotype characterization of zebrafish mutantcas005.
a, Normal primitive haematopoiesis is intact in mutcas005. WISH results demonstrate that the expression of primitive haematopoietic cell markers is identical between siblings and mutcas005 embryos at 22 h.p.f., including scl (also known as tal1; haematopoietic progenitor marker), gata1 (also known as gata1a; erythrocyte progenitor marker) and pu.1 (also known as spi1b; myeloid progenitor marker). b, The vascular development is normal in mutcas005 embryos. WISH results show no difference in the expression of kdrl (pan-endothelial cell marker) at 36 h.p.f. between wild-type siblings and mutcas005 embryos. c, The haemogenic endothelium is intact in mutcas005 embryos. WISH results show no difference in runx1 expression at 36 h.p.f. in wild-type and mutcas005 embryos. d, e, The definitive haematopoiesis is defective in zebrafish mutcas005 embryos. d, Bright-field images of wild-type and mutcas005 embryos show no obvious morphological difference at 5 d.p.f. e, WISH results of myb, hbae1.1, mpx and lyz expression in wild-type and mutcas005 embryos at 5 d.p.f. Arrows indicate the comparable position in wild-type (black) or mutcas005 embryos (red). In 5 d.p.f. wild-type embryos, myb was expressed in all haematopoietic tissues including the CHT, thymus and kidney, whereas homozygous mutcas005 embryos displayed markedly decreased myb expression in the CHT, but similar expression to wild-type embryos in the thymus and kidney marrow. In accordance, the expression of downstream haematopoietic lineage cell markers, including hbae1.1 (erythrocyte marker), mpx (granulocyte marker) and lyz (macrophage marker), also showed similar expression patterns in the wildtype (black) and mutcas005 (red) embryos to that of the myb WISH analysis. f, The percentage of apoptotic HSPCs detected by the TUNEL assay in 2 and 4 d.p.f. wild-type and mutcas005 embryos. 2 d.p.f.: P = 0.35, t = 0.96, df = 27; 4 d.p.f.: P = 0.50, t = 0.69, df = 27. Error bars denote s.e.m. g, At 7 d.p.f., myb expression in the thymus and kidney marrow was identical in wild-type sibling and mutcas005 embryos, whereas mutcas005 embryos still displayed markedly decreased myb expression in the CHT. In addition, mutcas005 embryos displayed notably decreased hbae1.1, mpx and lyz expression in the CHT but not in the kidney marrow.
Extended Data Fig. 2 |
Extended Data Fig. 2 |. Genetic mapping and verification of zebrafish itga4 mutants.
a, Positional cloning of mutcas005. After high-resolution mapping, the point mutation is flanked by the SSLP markers z8363 (5 recombinant out of 994 meiosis) and zK165L22 (1 recombinant out of 994 meiosis). This region contains the four genes cwc22, ube2e3, itga4 and cerkl. The red strip represents chromosome 9; the positions and recombination of the SSLP markers are indicated. SSLP markers on the same side of the mutation site are shown in the same colour. b, Generation of itga4 mutants via the ENU(top) or CRISPR-Cas9 (bottom) technique. The alignment of wild-type (underlined) and mutated sequences is listed. The insertion in ENU is indicated in red (an insertion of G leading to an earlier stop codon in the itga4 gene in mutcas005). The PAM sequence of gRNA is ‘CGG’ (blue). Deletions are indicated by dashes. c, According to the stop codon in the genome of itga4 mutants, SMART software was used to predict the structure of the wild-type itga4, itga4cas005 and itga4cas010 presumed protein. The molecular sizes of the presumed protein are indicated. d, The myb WISH results in wild-type and itga4cas010 embryos at 72 h.p.f. e, itga4 morphants could phenocopy itga4cas005. The validated itga4 morpholino oligonucleotide (MO) that can block the translation of itga4 mRNA was injected into one-cell-stage wild-type embryos to produce itga4 morphants. WISH results of myb expression in the control and itga4 morphants at 72 h.p.f. f, g, Representative live imaging (g) and statistical analysis (f) of Tg(gata1:DsRed), Tg(mpx:eGFP) and Tg(lyzDsRed) transgenic embryos after the injection of control or itga4 or vcam1 morpholino oligonucleotides at 84 h.p.f. Results show that downstream haematopoietic lineages were all defective owing to disrupted HSPC retention in the CHT. gata1, control vs itga4 MO: ****P < 0.0001, t = 7.42, df = 14; gata1, control vs vcam1 MO: ****P < 0.0001, t = 8.11, df = 14; mpx, control vs itga4 MO: P < 0.0001, t = 5.92, df = 14; mpx, control vs vcam1 MO: ****P < 0.0001, t = 9.41, df = 14; lyz, control vs itga4 MO: ****P < 0.0001, t = 7.16, df = 25; lyz, control vs vcam1 MO: ****P < 0.0001, t = 5.74, df = 25. h, In situ analysis of itga4 expression in the AGM (FISH, 36 h.p.f.) and CHT (WISH, 72 h.p.f.) of Tg(kdrl:eGFP) (green) embryos after injection of control, runx1 or myb morpholino oligonucleotides indicates HSPC cell-autonomous expression. i-k, itga4 has an HSPC intrinsic mechanism during definitive haematopoiesis. i, The construction of the plasmid that was applied in the itga4cas005 mutant for Tol2-transposase-mediated transient transgenesis of runx1-enhancer-driven wild-type itga4 expression. j, k, Phenotype analysis by myb WISH shows that the construct had a notable rescue effect on definitive haematopoiesis in the itga4cas005 mutant at 72 h.p.f. More than 45% of mCherry+ cells overlapped with myb FISH signalling in the CHT; a representative image is shown in k. Error bars denote s.e.m. Scale bars, 50 μm (g), 20 μm (h) and 5 μm (k).
Extended Data Fig. 3 |
Extended Data Fig. 3 |. Photoconversion of Tg(kdrl:Dendra2) cells in the AGM can specifically mark HSPCs in the CHT.
a, Schematic illustration (left) and confocal imaging analysis (right) of the HSPC labelling system in live Tg(kdrl:Dendra2) transgenic zebrafish larva. At 32–36 h.p.f., an ultraviolet laser was applied to photoconvert Dendra2 in haemogenic endothelium from green to red fluorescence in the area marked by the rectangle. Endothelial-to-haematopoietic transition was observed with egress of single red Dendra2+ cells (white arrows) from the aortic ventral wall into the sub-aortic space. b, Flow chart of the experimental analysis on HSPCs (red Dendra2+ cells) in live-imaging and confocal-imaging analysis after in situ RNA scope in identical locations. Green Dendra2 signalling could remain during the experiment, whereas red Dendra2 signalling could not (the red fluorescence of the ISV disappeared after in situ RNA scope analysis). Photoconverting the ISV in different embryos makes each embryo distinguishable. (We distinguished the embryos by the position of the photoconverted and weakened Dendra2 green ISV). After live imaging the red Dendra2+ cells in the CHT (top, arrows) at 54 h.p.f., the embryos were fixed immediately for runxl in situ RNA scope analysis (bottom, yellow arrowheads). All HSPCs (red Dendra2+ cells) carry runxl transcripts, whereas there was no signal in the negative control. c, d, Confocal images of the CHT (c) and statistical analysis (d) at 54 h.p.f. show markedly reduced numbers of HSPCs (red Dendra2+ cells) in runxl and myb morphants, compared to that in control morphants. Control vs runxl MO: ****P < 0.0001, t = 9.15, df = 9; control vs myb MO: ****P < 0.0001, t = 8.66, df = 9. e, Live-imaging analysis on individual HSPCs in wild-type and itga4cas005 mutant embryos. Three representative frames from time-lapse imaging of 52–60 h.p.f. wild-type and itga4cas005 embryos with the Tg(kdrl:Dendra2) labelling system. The HSPCs (white arrow) remained stable in the vascular niche for over 30 min in the wild-type sibling (left); however, in the itga4cas005 mutants (right), the HSPCs (yellow arrowhead) remained for less than 9 min (see Supplementary Video 2). Error bars represent s.e.m. Scale bars, 50 μm (a–c) and 20 μm (e).
Extended Data Fig. 4 |
Extended Data Fig. 4 |. The HSPCs’ retention ‘hotspot’ in the CHT.
a, Correlation analysis of retention time and the dorsal-ventral relative location of individual HSPCs in the CHT of four wild-type embryos at 50–60 h.p.f. Each shape represents one embryo (triangle, circle, square and rhombus), and each colour represent one class of retention time zone. HSPCs that remained for longer than 30 min were preferentially located in the region between the two magenta dashed lines enriched with venous capillaries. b–d, Longitudinal whole-mount images of the CHT in wild-type siblings (b, c) and itga4cas010 mutant embryos (d) in a Tg(kdrl:Dendra2) background after photoconversion and retention calculation of the frequency of HSPC appearance. e, Longitudinal whole-mount images of the CHT in Tg(mpeg1:Gal4,kdrl:Dendra2) embryos after MTZ treatment with or without a Tg(UASNfsB-mCherry) background, and vcam1cas011; Tg(mpeg1:Gal4,kdrl:Dendra2) embryos with transient transgenesis of vector (UAS:polyA) or UAS:vcam1 after photoconversion and retention calculation of the frequency of HSPC appearance. Red arrows denote retention hotspots. HSPCs were preferentially located in the region between the two magenta dashed lines. Retention hotspots disappeared in the itga4cas010and vcam1cas011 mutants after depletion of macrophages (MTZ treatment on NfsB-expressing macrophages). Scale bars, 50 μm.
Extended Data Fig. 5 |
Extended Data Fig. 5 |. HSPCs decelerate in the CHT vascular niche.
a, Representative spatial maps of the flow velocity of photoconverted HSPCs in the caudal vasculature at 54 h.p.f. Arrows show the direction of blood flow, and different colours indicate the level of velocity. b, Schematic illustration of how HSPCs enter the CHT via the circulation. c–e, Time-lapse imaging (c, d) and speed curve diagram (e) show that HSPCs arrive either from the intersegmental vessel (green arrow in c) or the CVP (red arrowhead in d) into the CHT and gradually decelerate (see Supplementary Video 3). Scale bar, 20 μm.
Extended Data Fig. 6 |
Extended Data Fig. 6 |. The representative high-resolution vascular structure and HSPC in the retention hotspot.
a, The original fluorescent image of the vessel surrounding HSPCs in the retention hotspot was captured by an LSM880 microscope equipped with Airyscan function and processed by 3D reconstruction (see Supplementary Video 4). b, 3D reconstruction of a. c, Section view of the caudal vein plexus and capillary. d, The 45° rotation view of the red frame in b. e, Time-lapse imaging (left) and scheme graph (right) show how HSPC retention occurs. HSPCs initially came into the venous plexus and then entered the venous capillary for long-term retention. f–h, Images (f, g) and statistical analysis (h) show that the diameter of various vessels in the CHT in itga4cas010 mutants (g) is similar to that in the wild-type siblings (f) at 54 h.p.f. The inner diameter of venous capillaries, but not other vessels, is close to the diameter of HSPCs. DA: P = 0.73, t = 0.35, df = 19; CV: P = 0.14, t = 1.52, df = 33; CVP: P = 0.17, t = 1.41, df = 19; VC: P = 0.63, t = 0.49, df = 19; HSPC: P = 0.67, t = 0.44, df = 19. Scale bar, 20 μm.
Extended Data Fig. 7 |
Extended Data Fig. 7 |. Characterization of VCAM-1+ cells in the CHT.
a, Generation of the vcaml mutant using the CRISPR-Cas9 technique. The alignment of wild-type (underlined) and mutated sequences is listed. The PAM sequence of gRNA is ‘GGG’ (in blue). Deletions are indicated by dashes. b, According to the stop codon in the genome, SMART software was used to predict the structure of the wild-type vcaml and vcam1cas011 presumed protein. The molecular sizes of the presumed protein are indicated. c, Live imaging of the CHT at 54 h.p.f. shows retention defects in vcam1cas011 mutants. Representative images show that most HSPCs resided within the CHT (white arrows) in wild-type siblings (top), whereas these cells went through quickly in vcam1cas011 embryos (bottom, yellow arrowheads) (see Supplementary Video 5). d, WISH analysis of myb expression in the CHT of wild-type and vcam1cas011 embryos at 72 h.p.f. e, f, The definitive haematopoiesis is defective in vcam1cas011 mutant zebrafish embryos. e, The bright-field images of wild-type and vcam1cas011 embryos show no obvious morphological difference at 72 h.p.f. f, WISH results of hbael.1, mpx and lyz expression in wild-type and vcam1cas011 mutant embryos at 72 h.p.f. Arrows indicate the comparable position in wild-type (black) or vcam1cas011 (red) embryos. g, Magnified views showed VCAM-1 was mainly expressed in individual cells (white arrow) but weakly expressed on the venous endothelial cells (yellow arrowheads). h, After photoconversion, Tg(kdrl:Dendra2) embryos are stained with anti-VCAM-1 (magenta, white arrow). The yellow arrowhead denotes an HSPC. i, Tg(cxcl12a:DsRed,kdrl:eGFP) transgenic embryos are stained with anti-VCAM-1 (magenta, white arrow) and anti-DsRed (red, yellow arrowhead). j, Tg(tcf:eGFP,kdrl:mCherry) transgenic embryos are stained with anti-VCAM-1 (magenta, white arrows) and anti-GFP (green, yellow arrowheads). Scale bars, 50 μm (c), 20 μm (g) and 10 μm (h, i).
Extended Data Fig. 8 |
Extended Data Fig. 8 |. Distinct role of macrophages and venous endothelium VCAM-1 in HSPCs retention.
a, Representative FISH confocal imaging of mfap4 (top), csf1ra (middle), spi1a (bottom) immunofluorescence with anti-VCAM-1 and anti-GFP antibodies indicates that VCAM-1+ cells in the CHT are macrophage-like cells (see Supplementary Table 2). b, The construction of the plasmid applied in c–f. c, Validation of the macrophage-specific cell-depletion system. Left, the number of HSPCs under the endothelial-to-haematopoietic transition (EHT) process in the AGM of Tg(mpeg1:Gal4,kdrl:Dendra2) transgenic embryos at 54 h.p.f. with MTZ treatment and with (#2) or without (#1) the Tg(UAS:NfsB-mCherry) background. P = 0.80, t = 0.25, df = 9. Right, live imaging of vessels (green) and macrophages (red) with or without MTZ treatment in the CHT of Tg(kdrl:Dendra2,mpeg1:Gal4,UAS :N fsB-mCherry) transgenic embryos showed that MTZ treatment could delete almost all mCherry+ macrophages. d, Quantification of VCAM-1+ cells in the CHT, detected by anti-VCAM-1 immunofluorescence, in Tg(mpeg1:Gal4,kdrl:Dendra2) embryos at 54 h.p.f. with MTZ treatment and with (#2) or without (#1) a Tg(UAS:NfsB-mCherry) background, and in vcam1cas011 mutants with Tol2-mediated transient transgenesis of vector (UAS:polyA) (#3) or UAS:vcam1 (#4) in a Tg(mpeg1:Gal4,kdrl:Dendra2) background. #1 vs #2: ****P < 0.0001, t = 9.18, df = 24; #3 vs #4: ****P < 0.0001, t = 10.03, df = 23. e, Statistical analysis shows the percentage of the three types of definitive haematopoietic phenotype (extremely low, decreased or normal) in the four experimental conditions (#1-#4) linked to d. Macrophage-specific cell depletion caused deficient definitive haematopoiesis; however, macrophage-specific VCAM-1 re-expression markedly rescued deficient haematopoiesis in vcam1cas011 mutants. f, Retention time of individual HSPCs in transgenic Tg(mpeg1:Gal4,kdrl:Dendra2) embryos at 50–60 h.p.f. with MTZ treatment and with (#2) or without (#1) a Tg(UAS:NfsB-mCherry) background, and in vcam1cas011 mutants with Tol2-mediated transient transgenesis of vector (UAS:polyA) (#3) or UAS:vcam1 (#4) in a Tg(mpeg1:Gal4,kdrl:Dendra2) background (see Fig. 2f, g). #1 vs #2: ***P = 0.0001, t = 3.85, df = 550; #1 vs #3: ****P < 0.0001, t = 6.05, df = 565; #3 vs #4: ****P < 0.0001, t = 4.37, df = 590. g, Live-imaging frame shots of HSPCs in which macrophage-specific VCAM-1 was in re-expressed vcam1cas011 mutants from Fig. 2g (see Supplementary Video 6). h, Schematic illustration shows that macrophage labelling (photoconverted Kaede+; red) was performed at 18 h.p.f. in the rostral blood island (RBI) in Tg(mpeg1:Gal4, UAS:Kaede) embryos, followed by a 1 nl anti-VCAM-1647 (0.4 ng) antibody injection at 50 h.p.f. Cell-lineage tracing of the labelled macrophages (red; yellow arrowheads) in vivo was performed from 2 h after the injection. Representative images show that macrophages from the rostral blood island at 18 h.p.f. migrate to the CHT, and are VCAM-1+. Scale bars, 50 μm (c), 20 μm (g), 10 μm (h) and 5 μm (a).
Extended Data Fig. 9 |
Extended Data Fig. 9 |. Anti-VCAM-1647 antibody labels usher cells without disrupting definitive haematopoiesis.
a, Injection of 1 nl (0.4 ng) of anti-VCAM-1647 antibody labels usher cells (arrows) in wildtype and itga4cas010 mutants in the Tg(kdrl:eGFP) background, whereas injection of either control (non-specific) IgG647 antibody into wildtype cells or anti-VCAM-1647 antibody into vcam1cas011 mutants in the Tg(kdrl:eGFP) background did not label any cells in the retention hotspots. Asterisk indicates nonspecific labelling on a chromatophore in the CHT. b, Anti-VCAM-1647 injection marginally influence definitive haematopoiesis. Statistical analysis shows the percentage of the three types of definitive haematopoietic phenotype in nine different conditions, including wild-type embryos without injection (#1), with 10 nl vehicle (#2) or 10 nl 0.4 mg ml−1 IgG647 injection (#3), itga4cas005 mutants (#4) or vcam1cas011 mutants (#5) without injection, and wild-type embryos with 1–10 nl 0.4 mg ml−1 anti-VCAM-1647 injection (#6-#9). c, d, Live imaging of HSPCs (c) or WISH analysis of the myb probe at 60 h.p.f. (d) of the wild-type CHT after vehicle or 1 nl anti-VCAM-1647 antibody injection. e, Schematic diagrams (left) and confocal imaging (right) show VCAM-1+ cells patrolling on a small scale in the CHT in itga4cas010 mutant embryos. Cross indicates the original position at the initial time point. f, Statistical analysis of the duration of the interaction between HSPCs and usher cells, the HSPC retention time, the diameter of vessels and the dorsal-ventral relative location for HSPC retention in pre-type I (type 0), pre-type II (type 0), type I and type II. Duration, pre-I vs pre-II: ***P = 0.0001, t = 4.25, df = 41; duration, pre-I vs I: ****P< 0.0001, t = 5.31, df = 43; duration, pre-II vs II: P = 0.37, t = 0.93, df = 12; duration, I vs II: P = 0.46, t = 0.76, df = 14; retention: P = 0.16, t = 1.50, df = 14; diameter, pre-I vs pre-II: ****P < 0.0001, t = 8.80, df = 41; diameter, pre-I vs I: P = 0.68, t = 0.42, df = 43; diameter, pre-II vs II: P = 0.89, t = 0.14, df = 12; diameter, I vs II: **P = 0.006, t = 3.24, df = 14; location, pre-I vs pre-II: ****P < 0.0001, t = 7.64, df = 41; location, pre-I vs I: P = 0.6, t = 0.53, df = 43; location, pre-II vs II: **P = 0.005, t = 3.41, df = 12; location, I vs II: P = 0.41, t = 0.85, df = 14. g, In itga4cas010 mutants, HSPCs encountered but failed to interact with usher cells and then went through the CHT within a few minutes (see Supplementary Video 10). h, The percentage of the type 0, type I and type II HSPC retention types in wild-type sibling and vcam1cas011 mutants in the Tg(mpeg1:Gal4,kdrl:Dendra2) background with transient transgenesis of UAS:vcam1. None of the HSPCs in the vcam1 mutants could be classified into either type I or II retention types, or were comparable with the HSPCs in Extended Data Fig. 8h. Scale bars, 50 μm (a, c) and 20 μm (e, g).
Fig. 1 |
Fig. 1 |. Live-imaging characterization of nascent HSPCs retention in the cHt.
a, Frame shots from the CHT at 54 h.p.f. show HSPCs seeding successfully (white arrows) in wild-type siblings but not in itga4cas010 mutants (fast moving, yellow arrowheads). See Supplementary Video 1. b, A representative vascular architecture view of the HSPC retention hotspot. The orthogonal view is shown on the right. HSPCs, red; dorsal aorta, blue; venous plexus, light green; venous capillary, dark green. See Supplementary Video 4. c, The number of HSPCs in the AGM and CHT ol itga4cas005 mutants and wild-type siblings at 54 and 72 h.p.f., respectively. 54 h.p.f. AGM: P = 0.59, t = 0.55, df = 16; 54 h.p.f. CHT: ****P < 0.0001, t = 6.00, df = 17; 72 h.p.f. CHT: ****P < 0.0001, t = 18.65, df = 18. NS, not significant. d, e, Retention time of individual HSPCs in each embryo (d) and percentage of total HSPCs in four classified retention time zones in group embryos (n = 3) (e) of wild-type siblings and itga4cas005 and itga4cas005 mutants during 50–60 h.p.f. Wild type vs itga4cas005: P < 0.0001, t = 8.56, df = 824; wild type vs itga4cas010: P < 0.0001, t = 7.93, df = 758. f, Top, HSPCs that remained for longer than 30 min were preferentially located in the region enriched with venous capillaries (between the two magenta dashed lines). Bottom, the frequency of the appearance of HSPCs in the entire CHT of Tg(kdrl:Dendra2) zebrafish larvae from 50 to 60 h.p.f. (retention hotspots marked by red arrows). D, dorsal; V, ventral. Scale bars, 50 μm (a, f).
Fig. 2 |
Fig. 2 |. Distinct role of macrophages and venous endothelium VCAM-1 in HSPCs retention.
a, Percentage of total HSPCs in four classified retention time zones in grouped wild-type siblings and vcam1cas011 mutants (n = 3) at 50–60 h.p.f. b, Tg(kdrl:eGFP) embryos, stained with an anti-VCAM-1 antibody (magenta, arrows), show dorsal venous plexus distribution of individual VCAM-1+ cells in the CHT. c, Percentage of VCAM-1+ cells in the CHT scored by the distance to the nearest HSPC (edge to edge, n = 100). Most (86%; 86 out of 100 cells) VCAM-1+ cells were located within 7 μm of HSPCs (the average diameter of HSPCs is about 6.9 μm). Tg(kdrl:Dendra2) embryos with AGM photoconversion were stained with an anti-VCAM-1 antibody (magenta, white arrow). Yellow arrowheads denote HSPCs. d, The staining of Tg(mpeg1:eGFP) embryos with an anti-VCAM-1 antibody (magenta) shows that VCAM-1+ cells merge with mpeg1+ cells (green) in the CHT. White arrowheads denote VCAM-1+GFP+ double-positive cells; yellow arrowheads denote GFP single-positive cells. e, Live-imaging frame shots of HSPCs in macrophage-specific cell-depletion embryos from f. See Supplementary Video 6. Time is in minutes:seconds. f, Percentage of total HSPCs in four classified retention time zones in grouped (n = 3) Tg(mpeg1:Gal4,kdrl:Dendra2) embryos with MTZ treatment, with or without the Tg(UAS:NfsB-mCherry) background, at 50–60 h.p.f. g, Percentage of total HSPCs in four classified retention time zones in grouped (n = 3) vcam1cas011 mutants in a Tg(mpeg1:Gal4,kdrl:Dendra2) background with transient transgenesis of either vector (UAS:polyA) or UAS:vcam1 at 50–60 h.p.f. See Supplementary Video 6. Scale bars, 50 μm (b, d), 20 μm (e) and 10 μm (c).
Fig. 3 |
Fig. 3 |. Characterization of VCAM-1+ macrophages in the CHT.
a, Transgenic Tg(kdrl:eGFP) embryos, stained with an anti-VCAM-1 antibody (magenta, arrows), show that the VCAM-1+ macrophage first appeared in the CHT at 32 h.p.f. b, Tg(kdrl:eGFP) embryos in the vcam1cas011, itga4cas005 or runx1w84x mutant background are stained with an anti-VCAM-1 antibody (magenta, white arrows) at 54 h.p.f. Signals in itga4cas005 and runx1w84x are similar to that in wild-type siblings, whereas there is almost no detectable signal in vcam1cas011 mutants. c, Schematic diagrams (left) and confocal imaging (right) of VCAM-1+ macrophages (labelled with Alexa Fluor 647 dye-conjugated anti-VCAM-1 antibody by intravascular injection) that patrol the CHT of wild-type embryos. VCAM-1+ macrophages were mainly located intravascularly (>91%) with round or unpolarized cell morphology (>84%). Cross indicates the original position of VCAM-1+ macrophages at the initial imaging time point. See Supplementary Video 7. DA, dorsal aorta; VC, venous capillaries. Scale bars, 50 μm (a, b) and 20 μm (c).
Fig. 4 |
Fig. 4 |. Live imaging analysis on VCAM-1+ usher cell-guided HSPCs retention.
a, Schematic illustration (top left) shows that labelling of HSPCs (with photoconverted Dendra2, red) was performed at 36 h.p.f. in Tg(kdrl:Dendra2) embryos, followed by an anti-VCAM-1647 antibody injection at 50 h.p.f. Live imaging was performed 2 h after injection (52 h.p.f.). Schematic diagrams (top) show the HSPC retention model, with accurate percentage and classification. See Supplementary Table 3. Representative images (bottom) show the interaction between HSPCs (red; yellow arrowheads) and VCAM-1+ usher cells (magenta; white arrows). VCAM-1+ usher cells guide HSPCs into the venous capillaries, leading to type I and II retention (see Supplementary Videos 8 and 9). The top right images show one slice, and the others show z-stacks. b, Enlarged view of endothelial cell remodelling around a single HSPC to form a stem-cell pocket in type II retention (see Supplementary Video 9). Scale bars, 20 μm (a) and 10 μm (b).

Comment in

References

    1. Morrison SJ, Uchida N & Weissman IL The biology of hematopoietic stem cells. Annu. Rev. Cell Dev. Biol 11, 35–71 (1995). - PubMed
    1. Murayama E et al. Tracing hematopoietic precursor migration to successive hematopoietic organs during zebrafish development. Immunity 25, 963–975 (2006). - PubMed
    1. Kissa K & Herbomel P Blood stem cells emerge from aortic endothelium by a novel type of cell transition. Nature 464, 112–115 (2010). - PubMed
    1. Bertrand JY et al. Haematopoietic stem cells derive directly from aortic endothelium during development. Nature 464,108–111 (2010). - PMC - PubMed
    1. Boisset JC et al. In vivo imaging of haematopoietic cells emerging from the mouse aortic endothelium. Nature 464, 116–120 (2010). - PubMed