. 2018 Nov 19;8(12):117.
doi: 10.1038/s41408-018-0153-9.

Next generation flow for minimally-invasive blood characterization of MGUS and multiple myeloma at diagnosis based on circulating tumor plasma cells (CTPC)

Affiliations

Next generation flow for minimally-invasive blood characterization of MGUS and multiple myeloma at diagnosis based on circulating tumor plasma cells (CTPC)

L Sanoja-Flores et al. Blood Cancer J. .

Abstract

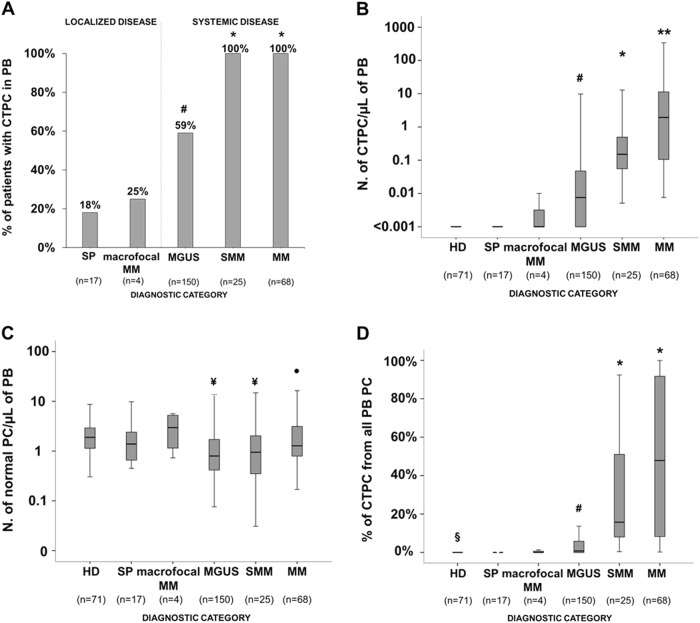
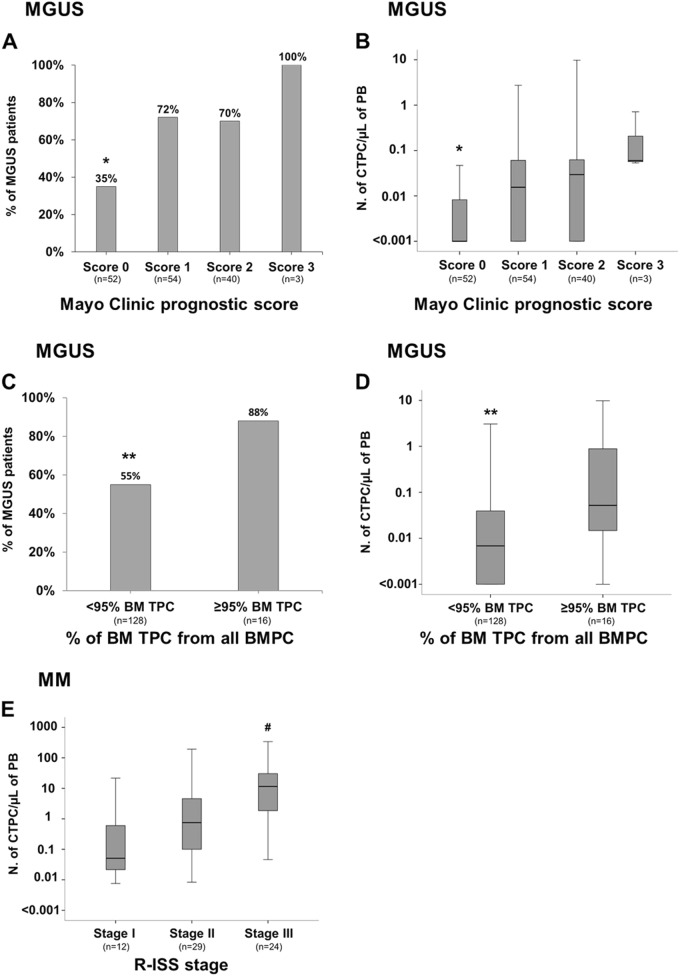
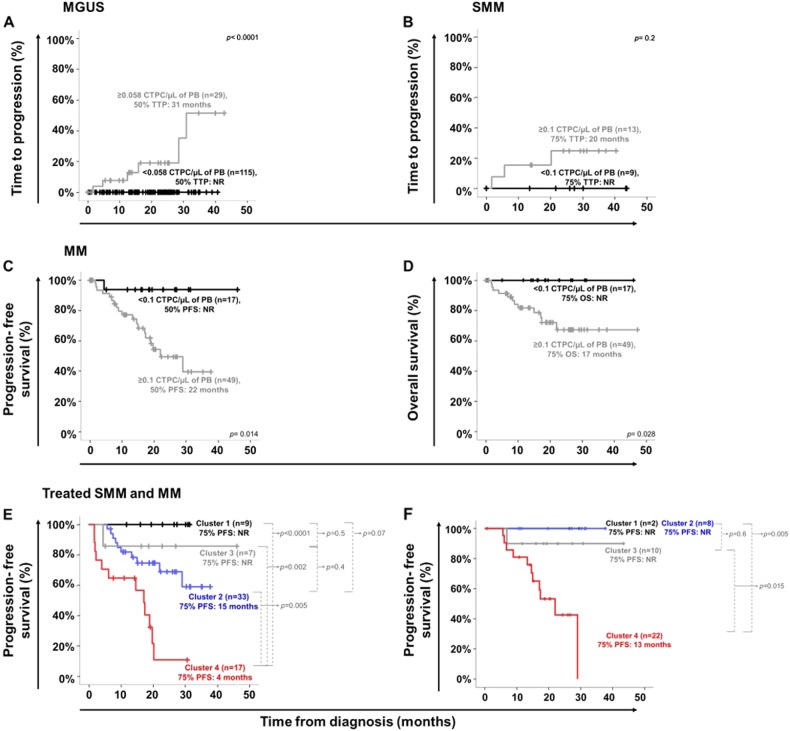
Here, we investigated for the first time the frequency and number of circulating tumor plasma cells (CTPC) in peripheral blood (PB) of newly diagnosed patients with localized and systemic plasma cell neoplasms (PCN) using next-generation flow cytometry (NGF) and correlated our findings with the distinct diagnostic and prognostic categories of the disease. Overall, 508 samples from 264 newly diagnosed PCN patients, were studied. CTPC were detected in PB of all active multiple myeloma (MM; 100%), and smoldering MM (SMM) patients (100%), and in more than half (59%) monoclonal gammopathy of undetermined significance (MGUS) cases (p <0.0001); in contrast, CTPC were present in a small fraction of solitary plasmacytoma patients (18%). Higher numbers of CTPC in PB were associated with higher levels of BM infiltration and more adverse prognostic features, together with shorter time to progression from MGUS to MM (p <0.0001) and a shorter survival in MM patients with active disease requiring treatment (p ≤ 0.03). In summary, the presence of CTPC in PB as assessed by NGF at diagnosis, emerges as a hallmark of disseminated PCN, higher numbers of PB CTPC being strongly associated with a malignant disease behavior and a poorer outcome of both MGUS and MM.


Conflict of interest statement

The authors declare that they have no conflict of interest.

Figures

Fig. 1
Fig. 1. Frequency of CTPC by NGF in PB of newly diagnosed PCN patients and distribution of TPC and NPCand their ratios in HD vs PCN patients.
Boxes extend from the 25th to 75th percentiles; the line in the middle and vertical lines correspond to the median value and the 10th and 90th percentiles, respectively. *p < 0.05 for SMM and MM vs. all other groups; **p < 0.05 for MM vs. all other groups; #p < 0.05 for SP vs. MGUS; ¥p < 0.05 vs. HD; •p < 0.05 for MGUS vs. MM; §p < 0.05 for HD vs. all other groups. PC plasma cell, PCN PC neoplasms, CTPC circulating tumor PC, NPC normal PC, SP solitary plasmacytoma, macrofocalMM macrofocal MM, MGUS monoclonal gammopathy of undetermined significance, SMM smoldering MM, MM multiple myeloma, PB peripheral blood, NGF next-generation flow, HD healthy donors
Fig. 2
Fig. 2. Correlation between the number and immunophenotype of tumor PCs in paired PB and BM samples from newly diagnosed PCN patients.
Correlation between the percentage of TPC from all BMPC and the absolute PB CTPC counts in paired BM and PB samples are shown in a, while the correlation between median fluorescence intensity (MFI) levels of expression of individual phenotypic markers in paired BM TPC vs. PB CTPC are displayed in b. In a, dots are colored per diagnostic category as follows: SP patients are color-coded as purple circles, macrofocalMM as light blue circles, MGUS cases are represented as green circles, SMM as orange circles, and MM as red circles. The dotted line represents the percentage of BM TPC above, which CTPC are usually detected in PB of PCN patients (91% vs. 9% cases with CTPC were found for patients above and below the line, respectively). In b, individual phenotypic markers are color-coded as follows: CD38, dark blue; CD56, dark green; CD45, light purple; CD19, dark purple; CD117, pink; CD81, gray; CD138, light blue; CD27, yellow; CyKappa, orange; CyLambda; brown; Vs38c, light green; SmKappa + SmLambda, black; Ki67, red; and, CD20, blue. PB peripheral blood, BM bone marrow, PC plasma cell, TPC tumor PC, CTPC circulating tumor PC, NPC normal PC, PCN PC neoplasms, MFI median fluorescence intensity, SP solitary plasmacytoma, macrofocalMM macrofocal MM, MGUS monoclonal gammopathy of undetermined significance, SMM smoldering MM, MM multiple myeloma
Fig. 3
Fig. 3. Frequency and distribution of circulating tumor PC in PB of MGUS and MM patients classified into distinct risk-groups and clinical stages, respectively.
Frequency of MGUS patients presenting with CTPC and their absolute counts according to the Mayo Clinic prognostic index (a and b, respectively; *p < 0.05 for Mayo Clinic prognostic score 0 vs. scores 1, 2, and 3) and the distribution of TPC within the whole BMPC compartment (<95% vs. ≥ 95%) (c and d, respectively; **p < 0.05 vs. ≥ 95% TPC from all BM PC). In e, the absolute counts of PB TPC in MM patients distributed according to the R-ISS stages is shown (#p < 0.05 for stage III vs. stages I and II). Boxes extend from the 25th to the 75th percentile values; the line in the middle and vertical lines correspond to the median value and the 10th and 90th percentiles, respectively. PC plasma cell, TPC tumor PC, CTPC circulating tumor PC, PB peripheral blood, BM bone marrow, MGUS monoclonal gammopathy of undetermined significance, MM multiple myeloma, R-ISS revised international staging system
Fig. 4
Fig. 4. Impact of PB CTPC counts at diagnosis on the outcome of MGUS, SMM, and MM patients.
TTP curves of MGUS and SMM grouped according to the absolute number of PB CTPC are shown in a and b, respectively. c and d display PFS and OS curves of MM patients grouped according to the absolute number of CTPC per μL of PB. In e and f PFS curves of treated myeloma (SMM and MM) patients grouped according to the absolute count of CTPC in PB detected at diagnosis and either the standard IMWG response criteria (e) or the BM MRD status (f) reached after therapy, are displayed, respectively. Patients who reached VGPR, CR/sCR or BM MRD-negativity after therapy and had low (black line) vs. high (blue line) levels of PB CTPC at diagnosis, are included in clusters 1 and 2 from both e and f, respectively; in turn, patients who did not reach VGPR, CR/sCR (e.g., PR, SD or PD) or BM MRD-negativity (e.g., BM MRD-positive cases) after therapy and had low (gray line) vs. high (red line) PB CTPC counts at diagnosis, are included in clusters 3 and 4 in e and f, respectively. TTP time to progression, PFS progression-free survival, OS overall survival, PC plasma cell, CTPC circulating tumor PC, NR not reached, PB peripheral blood MGUS monoclonal gammopathy of undetermined significance, SMM smoldering MM, MM symptomatic multiple myeloma, IMWG International Myeloma Working Group, VGPR very good partial response, CR complete response, sCR stringent complete response, PR partial response, SD stable disease, PD progressive disease

References

    1. Boyle EM, Davies FE, Leleu X, Morgan GJ. Understanding the multiple biological aspects leading to myeloma. Haematologica. 2014;99:605–612. doi: 10.3324/haematol.2013.097907. - DOI - PMC - PubMed
    1. McKenna R. W. et al. In World Health Organization Calssification of Tumours of Haematopoietic and Lymphoid Tissue IARC. pp. 200–208 (Lyon, 2008)
    1. Palumbo AU, Anderson AU. Multiple myeloma. N. Engl. J. Med. 2011;364:1046–1060. doi: 10.1056/NEJMra1011442. - DOI - PubMed
    1. Swerdlow SH, et al. The2016 revision of the World Health Organization classification of lymphoid neoplasms. Blood. 2016;127:2375–2391. doi: 10.1182/blood-2016-01-643569. - DOI - PMC - PubMed
    1. Kyle RA, et al. Clinical course and prognosis of smoldering (asymptomatic) multiple myeloma. N. Engl. J. Med. 2007;356:2582–2590. doi: 10.1056/NEJMoa070389. - DOI - PubMed

Publication types

MeSH terms