

Mechanistic Insights Into the Cross-Feeding of Ruminococcus gnavus and Ruminococcus bromii on Host and Dietary Carbohydrates
- PMID: 30455672
- PMCID: PMC6231298
- DOI: 10.3389/fmicb.2018.02558
Mechanistic Insights Into the Cross-Feeding of Ruminococcus gnavus and Ruminococcus bromii on Host and Dietary Carbohydrates
Abstract
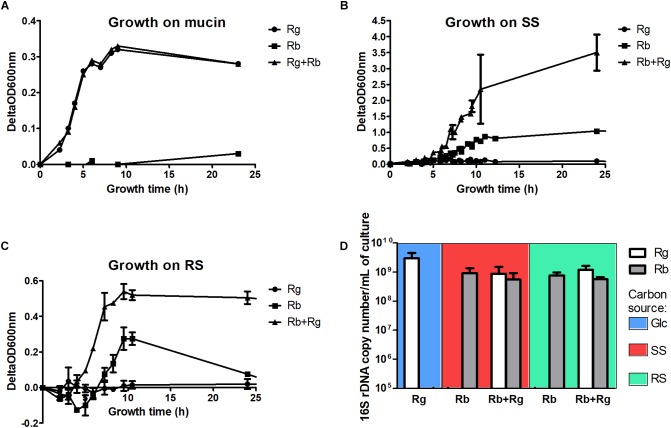
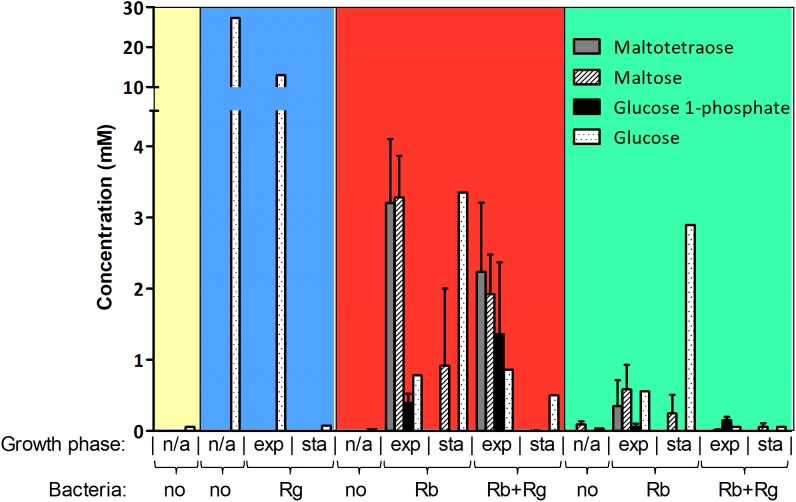
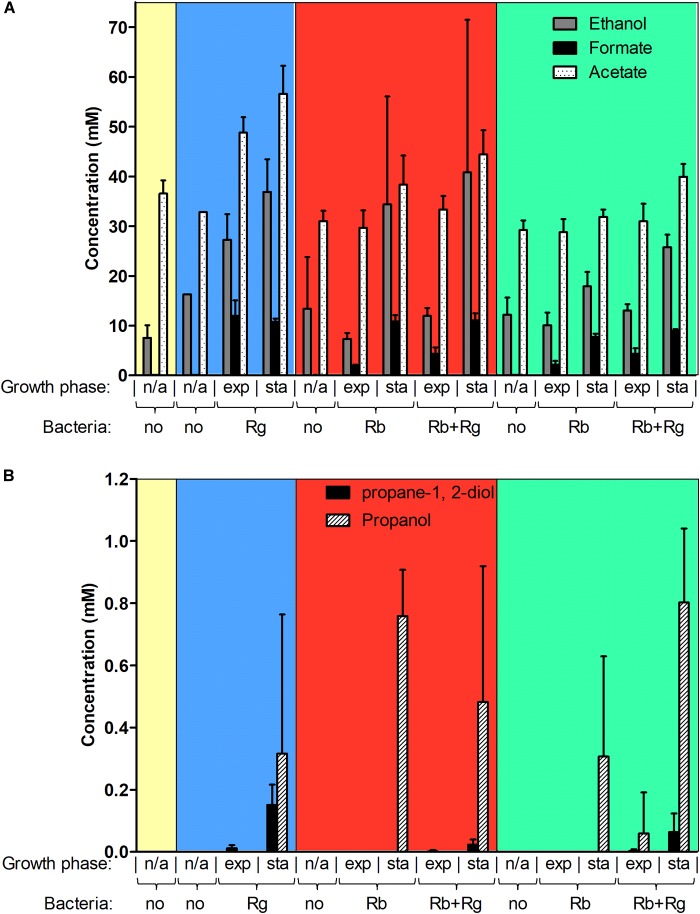
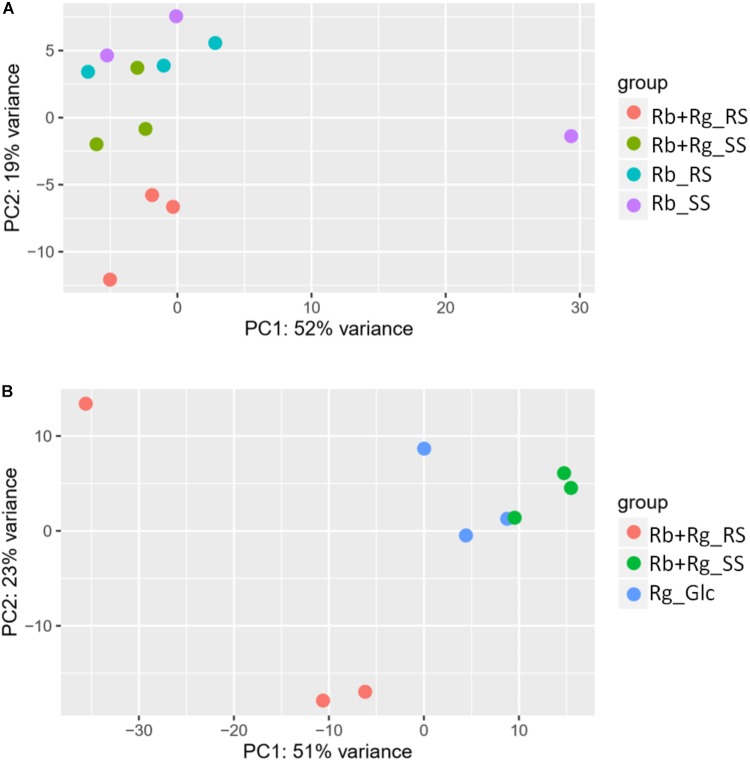
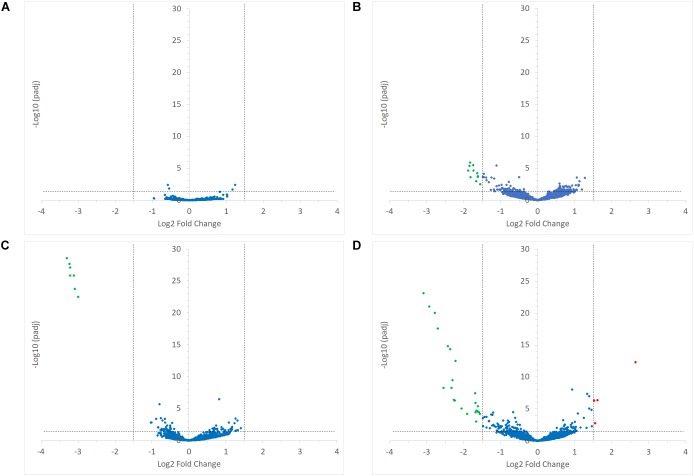
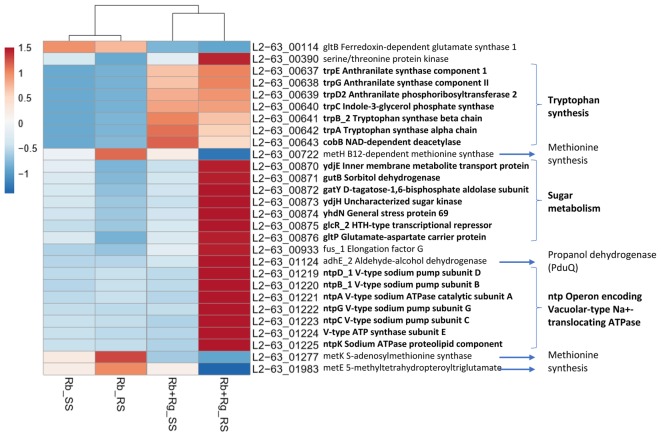
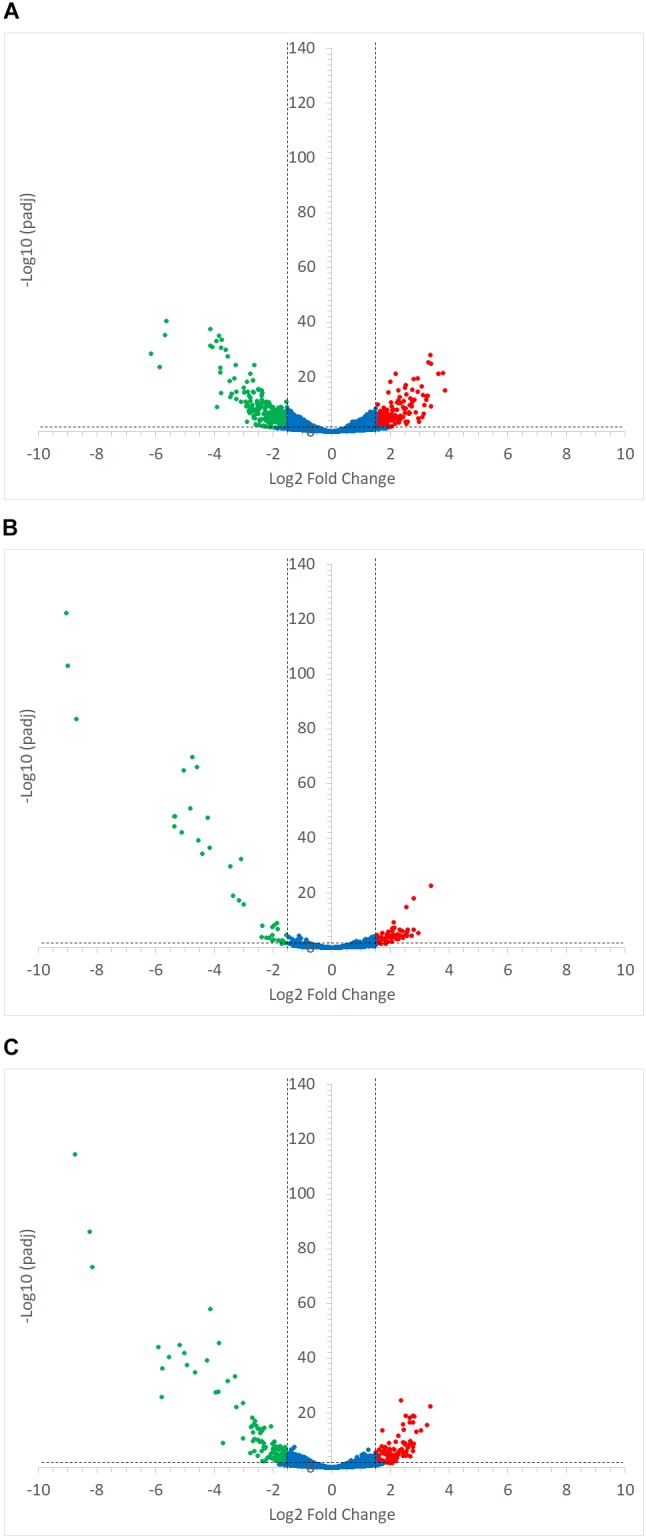
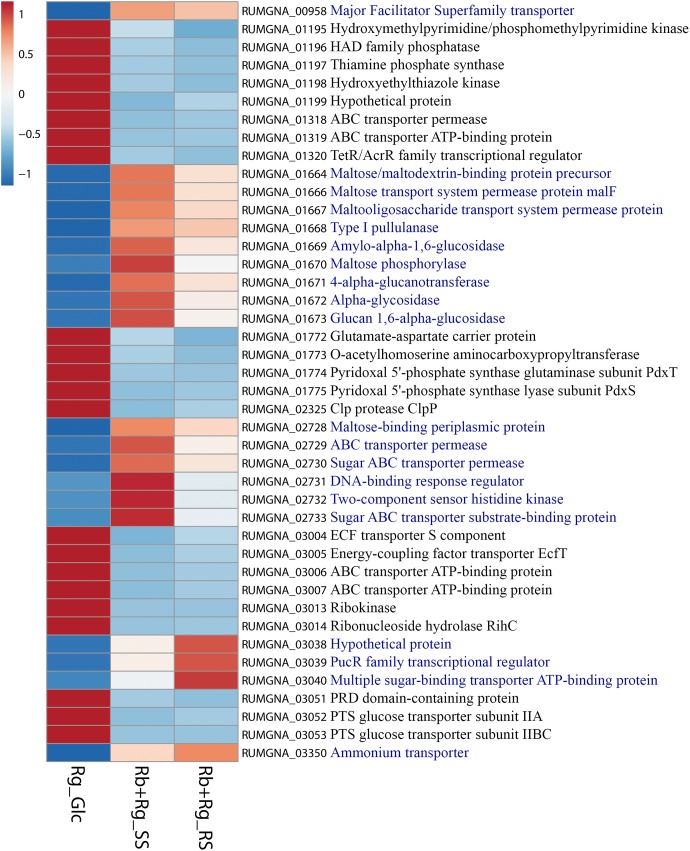
Dietary and host glycans shape the composition of the human gut microbiota with keystone carbohydrate-degrading species playing a critical role in maintaining the structure and function of gut microbial communities. Here, we focused on two major human gut symbionts, the mucin-degrader Ruminococcus gnavus ATCC 29149, and R. bromii L2-63, a keystone species for the degradation of resistant starch (RS) in human colon. Using anaerobic individual and co-cultures of R. bromii and R. gnavus grown on mucin or starch as sole carbon source, we showed that starch degradation by R. bromii supported the growth of R. gnavus whereas R. bromii did not benefit from mucin degradation by R. gnavus. Further we analyzed the growth (quantitative PCR), metabolite production (1H NMR analysis), and bacterial transcriptional response (RNA-Seq) of R. bromii cultured with RS or soluble starch (SS) in the presence or absence of R. gnavus. In co-culture fermentations on starch, 1H NMR analysis showed that R. gnavus benefits from transient glucose and malto-oligosaccharides released by R. bromii upon starch degradation, producing acetate, formate, and lactate as main fermentation end-products. Differential expression analysis (DESeq 2) on starch (SS and RS) showed that the presence of R. bromii induced changes in R. gnavus transcriptional response of genes encoding several maltose transporters and enzymes involved in its metabolism such as maltose phosphorylase, in line with the ability of R. gnavus to utilize R. bromii starch degradation products. In the RS co-culture, R. bromii showed a significant increase in the induction of tryptophan (Trp) biosynthesis genes and a decrease of vitamin B12 (VitB12)-dependent methionine biosynthesis as compared to the mono-culture, suggesting that Trp and VitB12 availability become limited in the presence of R. gnavus. Together this study showed a direct competition between R. bromii and R. gnavus on RS, suggesting that in vivo, the R. gnavus population inhabiting the mucus niche may be modulated by the supply of non-digestible carbohydrates reaching the colon such as RS.
Keywords: Ruminococcus; cross-feeding; gut bacteria; mucin; resistant starch.
Figures
Similar articles
-
Unique Organization of Extracellular Amylases into Amylosomes in the Resistant Starch-Utilizing Human Colonic Firmicutes Bacterium Ruminococcus bromii.mBio. 2015 Sep 29;6(5):e01058-15. doi: 10.1128/mBio.01058-15. mBio. 2015. PMID: 26419877 Free PMC article.
-
Ruminococcus bromii is a keystone species for the degradation of resistant starch in the human colon.ISME J. 2012 Aug;6(8):1535-43. doi: 10.1038/ismej.2012.4. Epub 2012 Feb 16. ISME J. 2012. PMID: 22343308 Free PMC article.
-
Starch-degrading gut microbes Ruminococcus bromii and Bifidobacterium adolescentis differ in their ability to degrade resistant starch type 3.Benef Microbes. 2025 Apr 29:1-20. doi: 10.1163/18762891-bja00077. Online ahead of print. Benef Microbes. 2025. PMID: 40312028
-
Some are more equal than others: the role of "keystone" species in the degradation of recalcitrant substrates.Gut Microbes. 2013 May-Jun;4(3):236-40. doi: 10.4161/gmic.23998. Epub 2013 Apr 2. Gut Microbes. 2013. PMID: 23549436 Free PMC article. Review.
-
Ruminococcus gnavus: friend or foe for human health.FEMS Microbiol Rev. 2023 Mar 10;47(2):fuad014. doi: 10.1093/femsre/fuad014. FEMS Microbiol Rev. 2023. PMID: 37015876 Free PMC article. Review.
Cited by
-
Xylanase Supplementation Modulates the Microbiota of the Large Intestine of Pigs Fed Corn-Based Fiber by Means of a Stimbiotic Mechanism of Action.Front Microbiol. 2021 Mar 24;12:619970. doi: 10.3389/fmicb.2021.619970. eCollection 2021. Front Microbiol. 2021. PMID: 33841350 Free PMC article.
-
Prebiotic Potential of Dietary Beans and Pulses and Their Resistant Starch for Aging-Associated Gut and Metabolic Health.Nutrients. 2022 Apr 21;14(9):1726. doi: 10.3390/nu14091726. Nutrients. 2022. PMID: 35565693 Free PMC article. Review.
-
Dynamic Effect of Operational Regulation on the Mesophilic BioMethanation of Grape Marc.Molecules. 2021 Nov 5;26(21):6692. doi: 10.3390/molecules26216692. Molecules. 2021. PMID: 34771101 Free PMC article.
-
Undernutrition Disrupts Cecal Microbiota and Epithelium Interactions, Epithelial Metabolism, and Immune Responses in a Pregnant Sheep Model.Microbiol Spectr. 2023 Mar 28;11(2):e0532022. doi: 10.1128/spectrum.05320-22. Online ahead of print. Microbiol Spectr. 2023. PMID: 36976022 Free PMC article.
-
Dysfunction of the Microbiota-Gut-Brain Axis in Neurodegenerative Disease: The Promise of Therapeutic Modulation With Prebiotics, Medicinal Herbs, Probiotics, and Synbiotics.J Evid Based Integr Med. 2020 Jan-Dec;25:2515690X20957225. doi: 10.1177/2515690X20957225. J Evid Based Integr Med. 2020. PMID: 33092396 Free PMC article. Review.
References
Grants and funding
- BB/L008602/1/BB_/Biotechnology and Biological Sciences Research Council/United Kingdom
- BBS/E/F/00044452/BB_/Biotechnology and Biological Sciences Research Council/United Kingdom
- BBS/E/F/000PR10353/BB_/Biotechnology and Biological Sciences Research Council/United Kingdom
- BBS/E/F/000PR10356/BB_/Biotechnology and Biological Sciences Research Council/United Kingdom
LinkOut - more resources
Full Text Sources
Other Literature Sources
Medical
Molecular Biology Databases